Understanding Fair Value Gaps in Trading: A Comprehensive Guide
Overview of Fair Value Gaps
- Definition: A fair value gap is a price range where one side of the market liquidity is offered, often confirmed by a liquidity void on lower time frame charts.
- Significance: These gaps indicate areas where price can move rapidly, creating opportunities for traders.
Analyzing the Euro-Dollar Daily Chart
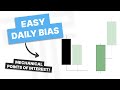
- Identifying Fair Value Gaps: The video highlights a specific fair value gap on the Euro-Dollar daily chart, marked by a blue shaded area representing a 20 pip range.
- Key Candles: The analysis focuses on the down candle that creates the fair value gap, emphasizing the importance of the low and close of surrounding candles.
- Price Movement: Price movements within this range are discussed, illustrating how buy side liquidity was offered and how traders can anticipate price returning to fill the gap.
Trading Strategies Involving Fair Value Gaps
- Time Frame Considerations: Fair value gaps can be analyzed on various time frames, with smaller time frames often revealing liquidity voids. For a deeper understanding of how to leverage analytics in trading, check out our summary on Mastering Trading Analytics: Building a Feedback Loop for Success.
- Expected Price Action: Traders are encouraged to look for price to return to fill these gaps, especially in range-bound market conditions. This concept aligns with strategies discussed in Mastering the Power of Three in Trading: A Comprehensive Guide.
- Example of a Successful Trade: The video describes a scenario where price filled a fair value gap, resulting in a profitable trade over a short period.
Conclusion and Further Learning
- Overlap with Other Concepts: The video concludes by discussing the relationship between fair value gaps, liquidity voids, and order blocks, suggesting that understanding these concepts can enhance trading strategies. For more insights on timeless trading rules, refer to Understanding WD Gann: Mastering Trading with Timeless Rules.
- Upcoming Resources: Viewers are informed about additional study materials and videos that will further explore these trading concepts in the coming weeks.
we'll be dealing specifically with the reinforcing of fair value gaps and it's a concept of trading inside the
range okay what is a fair value gap it is a range in price delivery where
one side of the market liquidity is offered and typically confirmed with a liquidity void on the lower time frame
charts in the same range of price price can actually gap to create a literal vacuum of trading thus posting
an actual price gap okay let's take a look at a euro dollar daily chart
okay and i'm going to ask you where do you see an example of the fair value gap okay i'm going to draw your attention to
it here it's a blue shaded area here on the daily chart let me explain to you
why i'm shading in that specific area of price it's about a 20 pip range
on the daily but inside of that blue shaded area
that is what is common referred to in my work as a fair value gap so take a look at what makes
that gap so significant as you can see here the candle to the
left of the down candle we're looking at that comprises the fair value gap
that's this candle here okay and to the left of that we have the higher
bearish candle and i'm drawing attention to the fact that it has a
down close but it's come off the low okay so we're looking at the low up to the close that little wick in there
if you take that same range okay and you look at our down candle that created that fair value
gap on the daily chart that range between 105 15
to approximately 105 big figure inside our down candle and in this candle here that's highlighted from the
low to the close
that price range has been traded up into once already delivering the buy side
liquidity in other words on this candle's low up to the close price had come off that low
so if it came off that low to have a higher close on that candle that means the buy side liquidity had been offered
on that range between 105 15 to 105 big figure so that means when we look at the down
candle that makes the fair value gap we're not concerned with the 105 15 to 105
big figure price range so we're going to be drawing our attention to that low here
and we'll draw that out in time but let's now look at the other candle
that frames our fair value gap the next area at which we see buy side liquidity
offered is from this green candle or up close candle to the right
of our down candle that makes the fair value gap the open to the high on this candle has
offered by side liquidity as well so we have seen price offered on the up
movement or buy side liquidity on two candles one to the left of our
fair value gap creating down candle on the daily chart and one candle to the right of it where we saw price move
higher in portion of that down candle so we have a range left that's open
and it specifically is this area right in here so we're delineating
the low of the previous candle and the high of the count to the right of the down camera that creates that little
pocket of space so between 105 big figure
down to 104.75 about 25 pips
that is our fair value gap and it's been left open there's been no trading outside of the
movement of that range except for that down candle and no up movement at all on this time
frame now when we're looking at fair value gaps
okay it's important to remind you that if we're studying a specific time frame the gap occurs on the time frame you're
looking at you can break this down further into smaller time frames but in the smaller
time frames you'll probably end up seeing a liquidity void where the gap would be indicated here on
this time frame on a lower time frame it would many times appear as a liquidity void where it's multiple candles that
create that open space of range okay so now we have our daily chart here we have our specific levels in mind that
we're watching and the two little line segments delaying one candle is low and one candle is high in between those two
reference points we have that big down candle and the exposed area in between that is the fair value gap that only the
cell side liquidity has been offered so imagine that paint brush analogy i've used many times in the past
on the down candle that creates the lowest low here there's a range with the candle before
it and the candle after it where it has left a pocket of porous price action or only delivered on the
downside we're going to expect price to eventually want to trade back up into
that little gapped area so this area in here that's where we're looking to see it fill in
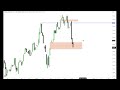
that's the nature of a fair value gap so when we look at price and we're zoomed in a little bit now here with a
four hour chart okay and you can see that the two specific price levels again are
delineated as well and we have a low delineated
for potential liquidity run on sell stops below the low price does in fact go down below that
previous low and well now we can expect to see what form
a turtle suit or false break below an old low why would we reasonably expect it to go
back up to fill in that gap well because we've already taken the sell side liquidity out
by running an old low we have equal highs here delineated also on our chart on a four hour basis and
right above those equal highs we have our fair value gap eventually price does in fact trade back
up closes the fair value gap in that trade or that idea is now complete while it doesn't look like a great deal
of money or pips offered it's a very highly profitable and probable
condition in the marketplace where we can see these fair value gaps and double tops where buy stocks will be
resting above it and if you see a turtle soup run below an old low you're in a range
this time of year going into the end of the 2006 trading year going into the
holidays uh trading is going to be range bound and when you're in a range bound consolidation type format or profile for
the marketplace this is the style trading you want to be doing looking for stops and looking for fair value gaps so
it was well over 100 pips of a move and it only took about two days to to complete that little price swing
and in fact this range of price action in the form of a fair value gap was actually detailed to you
in the beginning of this week where we delineate it on the daily chart the fair value gap as outlined here
and on the daily chart you can see it's been filled in here so while there's a lot of information
about fair value gaps and breakaway gaps and measuring gaps that's going to be coming your way in the form of the
december study notes just understand that everything has been shown here is reversed
for buy side liquidity runs where the market will come back and closing a fair value gap that's below the marketplace
to seek to fill in the sell side liquidity i want to take a quick look at something
else because i mentioned that the gaps fair value gaps liquidity voids
order blocks and liquidity pools they kind of overlap a lot of in a lot of different ways that you're probably not
aware of yet and that's what the benefit of having the pdf files study notes and also the supplementary
teachings that's going to happen next week monday through friday while we're away from live trading and live sessions
with the ict mentorship you will be getting a daily video supplementing these specific
techniques and concepts for the month of december so to help you really dial in on the concepts going
forward so that we are prepared and primed for the content for january 2017. but i want to take you back over to the
charts and give you something by way of understanding the overlap of liquidity voids and fair value gaps
okay folks we're looking at at 104.75 level i have the charts trained in on a five
minute euro dollar and we're seeing the very moment that that 104.75 level was
pierced here on the 19th this is the second time it trades through
that 104 75 level and i want to just draw a special attention to
this area up here okay and now i'm going to show you what it
looks like when we have a a run above an old high which is what this is 104.75
it's also run on liquidity in the form of a liquidity pool so it's running buy stops
but also it's hitting that fair value gap also so straight into the fair value gap
and i said in lower time frames many times this will create a liquidity void you see a movement lower here on this
candle and then we have another candle here look what happened
the next candles open is down here so you have this gap in here so price trades up into that and closes
that in right there see that price then
moves lower significant break lower and then lower
and ultimately trading through to where the cell stops were mentioned earlier
okay let's take a look at it on a 15-minute basis here's the
first time it trades up into that 104 75 level closing that fair value gap
and then here's the second time it trades up into it running out the previous high
the previous high this time was at 104.77 this candle's high comes in at 104.78
so it trades to it just by one pip now watch the difference here we have a down candle here a lot of
movement lower but it comes off that low watch what happens now we gap
we get from this candles close 104 72 to an opening on this candle
of 104 70. now it's only two pips difference but that creates a what a gap
so we can be a seller at a more refined price level mentioned and earlier time we said that we could
be a seller at 104.70 on a limit when price trades back up to that level
if it doesn't give us an opportunity to go on a limit we can trade it right as it hits it
live it can be in front of the charts right there there's your cell now here's the thing look at the body's clothes
on this candle right here the close is 104.72 that's exactly the high on this candles
close 104.72 the wick trades through the body but the bodies of the candle
completely close in here so this gap between these two candles these two black down candles
this gap in between the bodies have perfectly been filled in with this up candle so this is exactly what i'm
referring to as efficiency in terms of the price delivery if this movement lower has been offered
on the downside okay now think look closely this candle is high
comes in at 104.78 the close is at 104.75 the next candle
it opens at 104.76 i'm sorry 104.74 and then it creates a high
at 104.76 so it moves two pips up so from the
opening to the high is buy side liquidity offered
then it trades down for a down close then we gap down here there's a gap of buy side liquidity from
these two candles from this candle's opening that's exactly where this price goes on
the upside from the open to the high the open is 104.63 the high is 104.74 which is the opening here
104 74. that's the last point at which the buy side liquidity is offered on the up movement then it's all down from the
opening it fills in that perfect delivery of price right there
and then at that moment when you see this live you can be a seller at that moment
and price does exactly what we mentioned earlier when we're looking at the higher time frame
this delivery here price from this candle is low up to the close buy side was offered here and buy side
was offered from the opening to the high here so there's a gap closure here on all the downside movement here so this
has all been closed in so efficiently we could look for this range being delivered lower
we have to consider back here where price was delivered on the buy side here so this low
comes in at 104.55 so if we drop that down to there 104 55 that's where the last point at which the
low had traded up to the close so buy side liquidity has been delivered
here it's all sell side liquidity at this moment here it's all sell side now nothing over here
until we get over here so we created a gap down here price trades up hits it here hits it
here we could be a seller at 104.55 or 104.50 looking for a move down below 104
15 to 104 10. there's your run right there
perfect delivery of price hits it here hits it here look at the high on that candle
104 55. 104.55 the low on this candle 104 55. the buy
side all green candles up then it comes down so this is all efficiently traded it's a full block of delivery deficiency
up and down both ranges on both sides of the delivery of price dubai and the south side have been offered in here
from this low to this high once we break this low here we're all on sell side now
it comes right back to it here perfect delivery efficiently priced at 104
55 does it twice time to sell it off and wait for it to
run the cell stops below this low and this low down here let's just put a line on it so you can see
right there and watch the delivery
boom perfect so perfectly delivered down into the cell stops below the low lows
so hopefully this has been a little bit more insights into how the liquidity pools
and liquidity voids and fair value gaps draw together in an overlapping
scenario but again there'll be a lot more scenarios to outline in your pdf file for the summer's content
so i wish you good luck and good trading
A fair value gap is a price range in the market where one side of liquidity is offered, often indicated by a liquidity void on lower time frame charts. These gaps are significant as they represent areas where price can move quickly, creating trading opportunities.
Fair value gaps can be identified by looking for specific price ranges on charts, such as the Euro-Dollar daily chart highlighted in the video. These gaps are often marked by a shaded area, indicating a range (e.g., a 20 pip range) where price movements occur.
Traders can analyze fair value gaps across various time frames, with smaller time frames revealing liquidity voids. It's advisable to look for price to return to fill these gaps, especially in range-bound market conditions, which can lead to profitable trades.
Key candles, particularly the down candle that creates the fair value gap, are crucial for analysis. The low and close of surrounding candles help traders understand price movements and anticipate when price may return to fill the gap.
Yes, fair value gaps can be applied to various trading styles and time frames. Understanding these gaps can enhance trading strategies, whether you are a day trader or a swing trader, by providing insights into potential price movements.
Fair value gaps and liquidity voids are interconnected concepts in trading. Fair value gaps indicate areas of price movement, while liquidity voids highlight the absence of orders in those areas, making it essential for traders to understand both for effective strategy development.
The video mentions additional resources and upcoming materials that will delve deeper into trading concepts like fair value gaps, liquidity voids, and order blocks. You can also explore related summaries on trading analytics and timeless trading rules for further learning.
Keep this summary
Save it to LunaNotes and it becomes a real note in your library — editable, searchable, and ready to turn into flashcards or a diagram. Free to start.
Save to LunaNotesOr summarise for another video.
This summary and transcript were automatically generated using AI with the Free YouTube Transcript Summary Tool by LunaNotes.
Related summaries

Mastering Fair Value and Market Maker Perspectives in Price Action
This in-depth guide explores fair valuation from both equilibrium and market maker viewpoints. Learn how to identify discount, premium, and equilibrium zones, liquidity gaps, and voids to anticipate price movements and optimize trade entries. Understand institutional order flow and market maker strategies to align your trading with smart money actions.

Understanding Liquidity in Price Action Trading for Market Efficiency
This comprehensive guide explores liquidity in trading, focusing on how buy and sell orders create high and low resistance liquidity runs. Learn to identify key price levels where liquidity clusters, understand market maker behavior, and apply these insights to optimize trading strategies with minimal resistance and higher trade probabilities.
Daily Candle Closure Trading Framework for Reversals and Continuations
Discover a practical trading framework using daily candle closures and wick sizes to identify market reversals and continuations. This guide explains how to leverage previous day highs/lows, equilibrium levels, and intraday price action to enhance your trade decisions across multiple timeframes.
Mastering Market Maker Models: Forex, Indices & Stock Trading Insights
Discover expert analysis on the dollar index, forex pairs, gold, crude oil, and major indices, emphasizing anticipation over reaction in trading. Learn practical market maker buy and sell models, smart money reversals, and actionable strategies for consistent trading success.

Mastering Equilibrium vs Premium Markets: Advanced Fibonacci Trading Strategies
This tutorial delves into the dynamics of premium markets versus equilibrium, focusing on impulse price swings and Fibonacci retracement levels. Learn how to identify optimal trade entries, manage stops, and take profits using practical examples on daily and hourly charts for consistent, professional trading outcomes.
Most viewed summaries

A Comprehensive Guide to Using Stable Diffusion Forge UI
Explore the Stable Diffusion Forge UI, customizable settings, models, and more to enhance your image generation experience.

Kolonyalismo at Imperyalismo: Ang Kasaysayan ng Pagsakop sa Pilipinas
Tuklasin ang kasaysayan ng kolonyalismo at imperyalismo sa Pilipinas sa pamamagitan ni Ferdinand Magellan.

Mastering Inpainting with Stable Diffusion: Fix Mistakes and Enhance Your Images
Learn to fix mistakes and enhance images with Stable Diffusion's inpainting features effectively.

Pamamaraan at Patakarang Kolonyal ng mga Espanyol sa Pilipinas
Tuklasin ang mga pamamaraan at patakaran ng mga Espanyol sa Pilipinas, at ang epekto nito sa mga Pilipino.

How to Install and Configure Forge: A New Stable Diffusion Web UI
Learn to install and configure the new Forge web UI for Stable Diffusion, with tips on models and settings.
Found this summary useful?
Take it with you. One click puts it in your own LunaNotes library.
Save to LunaNotes