What is Liquidity in Trading?
Liquidity refers to how quickly a market or asset can be bought or sold without dramatically affecting its price. It centers on the presence of buy and sell orders resting at specific price levels, known as areas of liquidity.
Liquidity and Price Action
- Buy and Sell Orders: Liquidity is primarily composed of buy stop orders placed above swing highs and sell stop orders placed below swing lows.
- Reference Points: Traders seek reference points where liquidity is likely to be concentrated, offering high-probability trading opportunities. For a deeper understanding, see Mastering Fair Value and Market Maker Perspectives in Price Action.
Market Maker Perspective on Liquidity
- When the market moves away from a previous high or low, stop loss orders often rest just beyond these points, creating liquidity pools.
- These pools attract market makers who aim to trigger these stops, moving price to capture liquidity before reversing. Learn more about this in Mastering Market Maker Models: Forex, Indices & Stock Trading Insights.
High Resistance vs. Low Resistance Liquidity Runs
High Resistance Liquidity Run
- Occurs when the price must navigate through many previous highs and lows, facing considerable resistance.
- Example: Moving back toward an old high after multiple lower lows and highs, the market encounters stiff resistance from numerous liquidity levels.
- Typically less probable and harder to trade for longs due to stacked resistance.
Low Resistance Liquidity Run
- Characterized by clean breaks and quick moves through liquidity levels with minimal retracement.
- Example: Price breaks an old low and quickly climbs with little resistance, easily running through buy stop orders.
- Offers clearer and easier trading opportunities with minimal resistance.
Trading Strategy Based on Liquidity
- Identify old highs and lows where liquidity is likely to rest.
- Observe whether the price is in a high resistance or low resistance liquidity run.
- Favor trading during low resistance liquidity runs for easier price movement and minimal resistance.
- Avoid trading against high resistance zones unless supported by major market events (e.g., FOMC announcements).
- Align trades with institutional order flow, focusing on breakouts beyond significant reference points. For context on institutional order flow, see Understanding Market Efficiency: How Smart Money Drives Price Movements.
Additional Insights
- Liquidity understanding removes reliance on traditional indicators, placing confidence solely on price and order flow.
- Institutional models defend old highs and lows, making them critical levels for stop loss and take profit placement.
- Price action around these levels indicates whether they are being defended or targeted for liquidity runs.
By mastering these liquidity concepts, traders gain a purer, more strategic understanding of price movements, improving entry and exit timing, and aligning with institutional trading patterns for better market outcomes. To enhance your mindset and approach, consider Mastering Smart Money Mindset and Price Action for Market Success.
what is liquidity liquidity refers to the degree to which a market or asset or security can be quickly bought or sold
in the market without affecting the assets price dramatically
when we look at price it doesn't matter what time frame you're looking at
time is irrelevant for right now the
specifics about price action as it relates to liquidity we as price action traders we're looking
specifically for reference points where we can hone in on where there is a high probability of liquidity resting in the
marketplace now liquidity as it relates to ict concepts it relates to buy orders and sell orders
it's as simple as that when we have a swing in the marketplace as we note here
and the market trades lower our understanding is there is someone that went short here
this position would be net positive or profitable as the market moves lower
as the market turns around if those same positions were still held their open profits would be eroding and
at some point at this point right here they would be at a losing position our understanding is if there's a short
position or traders that are bearish on the marketplace if they have positioned a profitable trade here
and moved lower their stop loss order would be resting right above this high
or generally many times just rate at that high the market tends to find an interest in
going back to where that large body of interest
or what we call liquidity in the marketplace it would be by
liquidities as the market finds these lows down here as the market rallies away we are our
understanding is that there's going to be buyers that have positions that are net positive or profitable
as it trades higher at some point when the market starts to trade back down lower
back into the area in which the buy orders would have originated from
their open profits would be eroding until eventually moving into this area here
it would be at a net loss position so when we look at when we look at price the idea is
we're not looking for specific patterns for the sake of patterns we're looking at where
existing orders will reside so essentially what you do is you're
targeting areas at which the market has already seen a willingness to go higher or lower in this case we see a
swing high and the market moves lower we view that as a smart money trader or as a market
maker perspective we know that there's going to be buy stop or buy liquidity above that high
when we look at the lows when the market moves away from these lows we see that as cell liquidity
identifying both of these positions on both sides of the marketplace we're going to teach a concept called open
float while that's not going to be covered in this specific tutorial or this month of
training it's important to understand that the beginning foundations to understanding
liquidity as it relates to buying and selling in the marketplace our first fundamental understanding is
is that there's going to be liquidity above old highs and below old lows when we understand that we can see that
they will eventually target these same levels moving price just above the previous
high knocking out the liquidity that would be resting just above those highs in the
form of buy stops the low old lows the market will seek liquidity for the sell side or the cell
stops taking those orders out understanding this premise when we view
price action it removes all of the retail minded perspective but heavily leaning on
indicator based ideas when we adopt these principles with study of price it gives us the most
truest purest view of how price is
we have no confidence or direct relationship to our directional
bias on price relative to anything except for price itself if the market's moving from an old high
we know that there's going to be liquidity resting above that old high if the market's moved from an old low we
know there's going to be resting liquidity below those lows it's just that simple
now there's another concept when we understand liquidity the market has a tendency to run out old
highs and old lows but it has a very difficult time to do that when the market has conditions like
this when the market moves higher okay generally we can see a move higher
and then it moves lower here now in the context of this entire move lower there's a lot of peaks and troughs here
a lot of peaks and troughs the idea is if this is an old high back here
for this high to be ran out okay or to seek the liquidity resting above that old high
if this is where the current market action is right now or current price at market price
for it to get all the way up there it has to encounter a lot of resistance in the form of old lows
and old highs so you have the old lows acting as standard
resistance then you have the old highs
acting as buy stop liquidity so even if the market's going to go up
if the market's going to seek the liquidity above this high how do we know it's going to stop there
it could go another level higher for these buy stops and it could reach for this level of buy
stops and then maybe this buy stop level here in
the direction to run all these buy stops it's got to go through a lot of resistance in the form of these old lows
just to get back up to this old high when the market presents these opportunities and again this is not
specific to any time frame it's universal but when we see the market give this
this very thick area of resistance okay it's a lot of
price action that the market has to trade through to get back to an old high of significance
we view this as a high resistance liquidity run the market's going to have a very hard
time getting through all these previous lows and previous highs just to run out the liquidity that will be resting above
this old high when we trade we are not looking for these
opportunities while there are opportunities to trade with this in mind
in other later teachings it's important to understand that this is the least probable
trading condition to look for longs because you have so many levels of resistance and old
highs to encounter before you get back to the old significant high we understand that the market has been
presenting lower lows and lower highs and somebody in this market is obviously
would be being profitable those individuals with stops above this
old high in the form of a fund they're actually very highly defended because of this type of price action so it's going
to take a very sharp economic
market release the data kind of like non-farm payroll or fomc that type of event will knock through all of these
levels of resistance to run out that liquidity but generally without that type of influence or injection of
volatility these old highs generally are well defended
obviously the opposite can be said when we see the market make a low of some kind it could be a take a
long time really to form this but the old low would obviously have sell stops below it or sell liquidity
and as the market makes higher highs and higher lows if we're seeing price action right here we can't reasonably expect
the market to just drop straight down and make a run on the sell stops below this low without encountering first all
of these higher lows and higher highs as the market went
higher so to get through each one of these highs
okay there's going to be a lot of resistance to just run down out the stops that would be resting below
this low again just like we just mentioned with the high resistance liquidity run
for old highs the same is true here for high resistance liquidity runs on an old low
it's going to be very difficult for price to reach down through all of this price action and
the more time it's spent in this area again the more unlikely it is to make a market move all the way down to this old
low despite the fact that there may be really high levels of liquidity resting
below that whole low without the evidence of a significant market driver coming into play with like an fomc
interest rate announcement or non-farm payroll or something that would be completely
unexpected in the marketplace black swan event something like that that's generally the only type of thing you see
that will cut through this type of price action to get to the sell side of the liquidity here
so for shorts we avoid these types of occurrences there are opportunities that we'll learn
with trading with this profile or this market condition for high resistance liquidity runs but
for now we want to understand that this is the element of price action that we want to trade very less
frequent in now obviously there's going to be times when the
market really provides us an opportunistic time to take action in the market and trade with price action
and have very little resistance in our trades and obviously that comes by way of trading
in low resistance liquidity runs a low resistance liquidity run would be in the form of something similar to this
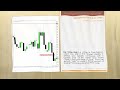
now the east crude depictions while they are rather elementary in the way that they're being
shown here the concept is very easy to see in price action as we'll look at when we get done looking at the actual
crude diagrams i've shared here if we see the market come off the old high okay and it comes down rather
quickly if there is a very sharp or
one-way type direction very little retracements of any kind when we see this okay once that market breaks below
an old low from that point at which it breaks the old low
until it gets through
a short term high in other words the market comes down makes a low here starts to trade off comes down makes a
higher low once it starts running through if we get a market break through
this short-term high this run here begins its climb back up into the range that's created by this
low being broken so it's being defined by this level here all the way down
to this high once it's broken this area of price action is deemed
low resistance now every time that a new short-term high is formed
before this low is retreated to or retested as resistance every time there's a new
short-term high what's going to form above that short term high
it's going to have by stop liquidity so buy side liquidity is going to be above these old highs if we
get a buy signal after a retracement we know that there's going to be very
little resistance for that move to go higher running out the buy stops just above
these short-term highs as we get closer to coming up into hitting this load that's been violated here
then we start encountering high resistance liquidity runs so the probabilities fall off
precipitously once we get back to the area which the range is defined in terms of low resistance
then it becomes a high resistance liquidity run to make any higher highs or run on
higher highs it becomes a lot more resistance to do that because we move back into an area where the market has
moved in a range this expansion
okay that's the easiest part of trading when we can trade inside that range so every
time we create another short term high in here if we get a buy signal that buy signal will have very little
resistance to get through the old high that it retraced from and you continuously look for those
until you fill in that break on this old low once it gets back to this old low over
here the market goes into what is referred to as a high resistance liquidity run anything higher than
this price point here becomes a high resistance liquidity run much like everything else i've always
taught everything i teach one-sided obviously is easily communicated by using the
reverse of it or just turning it upside down this is a
sell side of the marketplace low resistance liquidity run we have a consolidation in here the
market expands goes into expansion it breaks above a short-term high so at the moment the short-term high is broken
here market structure is bullish and then we go into a real quick run-up the market will create a high
start to break down and once the market starts trading below an old low the market will have a
very easy time trading back down into the point which the short-term high was broken on the upside so all this one-way
direction price action where all of it looks this one-sided for buys only very little retracements this is the easiest
time to trade in the marketplace right in here it's defined by the short-term high
that's broken on the upside here that's where you would begin your point which it's deemed a low resistance liquidity
run so you're focusing primarily on selling short every retracement is going to find very
little resistance going lower to run out the previous low there's going to be what resting below
these lows sell stop liquidity so the market goes lower breaks below
this short term low here expands has a small little retracement what's going to be forming below this short-term low
bottom chasers folks that want to be long but we understand that the market has
broken an old high here and had real quick sudden price action very little retracements so
we have very little resistance on the downside getting back to that point at which market structure broke so between
this point here and where the market breaks down this low here this is the easiest area to
trade in price action because you have very little resistance allowing price to just
cut through all that but you're waiting for a short term load form and every time a short term low
forms there's going to be cell stop liquidity resting below those lows okay so let's take a look at more
examples of a high resistance liquidity run and a low resistance liquidity run and what makes those
uh two types of liquidity runs different we have an old high back here noted here and the market starts to move lower and
we showed this example of price action here with this old high violating this old high here
selling off these old lows being violated here and the market starts to rally up
notice there was very little resistance in the marketplace where this high eventually traded lower taking out the
liquidity resting below these lows here this run from this high taking out these lows
is referred to as a low resistance liquidity run because we have a longer term high to the left of us and
the market has shown a willingness to take out a low and then we came back above cleared out a stop above the high
retraced had an unwillingness to go above this up candle here
so institutional order flow as you'll learn more about throughout this entire mentorship
moves back to bearish and expands to the downside expands down to the downside
to run out these stops below these lows the market rallies up again and fails to get above this swing high
this run higher is a high resistance liquidity run
the fact that it's going to have very difficult time getting above this high is because we've already priced in a
longer term high the intermediate term high and this high is going to have a very
hard time struggling to get through this height it's going to have very difficult time
getting through it so this rally up if we were buying long here we know that there's going to be a high probability
that this is not going to be running out the high is going to be in intact it's going to be defended and the higher high
over here will be defended so when price goes back up into this high
this actually becomes a low resistance liquidity run to see price come all the way back down to take out this low here
the fact that we keep this old high in place and every low
that forms has very little resistance as each time it moves through it's like a hot knife through
butter very little resistance down every time a low is formed price goes through those lows this equal lows here price
trades through those this short term low here price trades through it these short term lows here price trades through it
so the the bias is bearish so you want to be focusing primarily on
a market rally to take out short term lows
or intermediate term lows the difference between that is every rally is going to be viewed as a high
resistance liquidity run it's going to have very difficult time getting above the previous highs sometimes it will
happen but generally you're going to find that it's going to have a very difficult time doing that
but because that's built into price action having a high resistance liquidity run here it turns into a
low resistance liquidity run for you to see a move below the short-term lows every short-term low is an
opportunity to seek liquidity or the market to expand down after a retracement up to take out the
stops that rest below the marketplace at every old low every single blow
that you see in price once we identify where the market is in terms of high resistance or low
resistance liquidity we can find old lows to the left market respects it here comes back but then now
we have a lot of liquidity resting below this low here and this low here and the market runs right through it
small little retracement there's more liquidity below this low here so it's going to expand down through it
we have old lows back here so the market's going to do what it's going to retrace a little bit and then do what
expand down to take out those stops below this old lower here the same thing is seen when the market
finds a low in the market the market creates a
smaller consolidation makes it a long-term low rallies up
retraces moves into consolidation rallies through again so now we have a lot of price
action here so this old low is going to be well defended the fact that we have a retracement
going lower each time every time the market retraces that's going to be in the form of a high resistance liquidity
run it's going to find very stiff resistance with
violating old lows the old lows are going to be actually defended and you're going to see
buying coming in the marketplace your focus is going to be primarily on the highs every short-term high is going to
have very easy runs through them that forms a low resistance liquidity run
the resistance levels are going to be very weak
the support or lows are going to be very strong because the market's going to be
capitalizing only on the buy side just the reverse of what we saw over here on the sell side everything's going
to be supporting bearish prices so every retracement higher sets up another price leg to go lower aiming for the lows to
be violated we've changed the tide here and we made an old low so every time the market
retraces lower that sets up new buying opportunities to take out the short-term highs or immune term highs above the
marketplace because what's going to be resting above those highs buy stops and you want to be buying low
and selling to willing buyers above the current market action and that's what the market makers do so every time the
market trades down it's actually just a new low resistance liquidity run to make a run above an old high and it makes it
very easy to find trades this way market trades down smaller retracement its old high will be easily ran out low
resistance liquidity run market trades back and has a retracement
very little resistance to get back up to this old high it runs cleanly through that
another retracement here the liquid is going to be resting above this old high and eventually the market expands
through it as well [Music] and eventually the market trades
through those lows as well okay so there's many elements to the things i've thought in this month's teaching looking
for clean highs where the levels are just too clean when the market shows those types of
levels it's going to be very opportunistic for you to build the idea that there's going to be buy stops above
that so any little retracement sets the tone for another drive through that and the market continues to find an ease
of getting back through old highs at some
point you're going to look at price action and it's going to be very
crystal clear that the more price action there is around a
specific level or a high or a low that is indicating a levels being defended
on an institutional price model so you're going to see very
easy trading when you trade away from that level and by doing that you're going to be
getting yourself in sync with the institutional order flow then your trades will find very low resistance in
the form of profitable exits and very little draw down
Liquidity in price action trading refers to how easily an asset can be bought or sold without significantly changing its price, often centered on buy stop orders above swing highs and sell stop orders below swing lows. Understanding liquidity helps traders identify areas where many orders accumulate, which creates high-probability trading opportunities and improves entry and exit timing.
Market makers target liquidity pools—clusters of stop loss orders beyond previous highs or lows—by pushing the market to trigger these stops, capturing liquidity before prices reverse. This behavior shapes price movements and offers traders insights into likely reversal points and optimal trade setups.
A high resistance liquidity run involves price moving through many previous highs and lows, facing stacked resistance levels, making it harder to trade longs. Conversely, a low resistance liquidity run features clean, quick price breaks with minimal retracement through liquidity levels, offering clearer and easier trading opportunities.
Traders should first identify key old highs and lows where liquidity rests, then observe whether the price movement reflects a high or low resistance liquidity run. Favoring trades during low resistance runs and aligning with institutional order flow, such as breakouts beyond significant reference points, helps improve trade probability and market alignment.
Liquidity-focused trading discourages dependence on traditional indicators because it emphasizes pure price and order flow analysis. This approach better reflects institutional behavior and market efficiency, enabling traders to anticipate movements based on liquidity levels rather than lagging signals from conventional tools.
Since institutional models defend old highs and lows where liquidity clusters, these levels become critical for placing stop losses and take profits. Recognizing price action around these points informs whether these levels are being defended or targeted, allowing traders to optimize risk management and exit strategies.
Practical steps include identifying significant liquidity areas like prior swing highs and lows, monitoring whether the price is in a low resistance liquidity run, and timing entries on breakouts beyond these levels. Avoid trading against strong resistance zones unless supported by major market events, ensuring alignment with smart money flows for better trade success.
Keep this summary
Save it to LunaNotes and it becomes a real note in your library — editable, searchable, and ready to turn into flashcards or a diagram. Free to start.
Save to LunaNotesOr summarise for another video.
This summary and transcript were automatically generated using AI with the Free YouTube Transcript Summary Tool by LunaNotes.
Related summaries

Mastering Fair Value and Market Maker Perspectives in Price Action
This in-depth guide explores fair valuation from both equilibrium and market maker viewpoints. Learn how to identify discount, premium, and equilibrium zones, liquidity gaps, and voids to anticipate price movements and optimize trade entries. Understand institutional order flow and market maker strategies to align your trading with smart money actions.

Understanding Market Efficiency: How Smart Money Drives Price Movements
This comprehensive guide unpacks the market efficiency paradigm, revealing how a small group of smart money traders—primarily banks and institutional players—control price movements, not the large retail crowd. Learn to recognize the distinct phases of price delivery, including consolidation, expansion, reversal, and retracement, and apply this knowledge to enhance trading strategies.

Understanding Impulse Price Swings and Market Protraction in Trading
This summary explores impulse price swings and market protraction, explaining their characteristics and time-sensitive behavior in global trading sessions. Learn how protraction phases manipulate market sentiment around key time markers like New York and London openings for strategic trading decisions.

Mastering Equilibrium vs Premium Markets: Advanced Fibonacci Trading Strategies
This tutorial delves into the dynamics of premium markets versus equilibrium, focusing on impulse price swings and Fibonacci retracement levels. Learn how to identify optimal trade entries, manage stops, and take profits using practical examples on daily and hourly charts for consistent, professional trading outcomes.
Understanding Fair Value Gaps in Trading: A Comprehensive Guide
This video delves into the concept of fair value gaps in trading, explaining how they represent price ranges where market liquidity is offered. It provides a detailed analysis using the Euro-Dollar daily chart to illustrate how these gaps can indicate potential trading opportunities and liquidity runs.
Most viewed summaries

A Comprehensive Guide to Using Stable Diffusion Forge UI
Explore the Stable Diffusion Forge UI, customizable settings, models, and more to enhance your image generation experience.

Kolonyalismo at Imperyalismo: Ang Kasaysayan ng Pagsakop sa Pilipinas
Tuklasin ang kasaysayan ng kolonyalismo at imperyalismo sa Pilipinas sa pamamagitan ni Ferdinand Magellan.

Mastering Inpainting with Stable Diffusion: Fix Mistakes and Enhance Your Images
Learn to fix mistakes and enhance images with Stable Diffusion's inpainting features effectively.

Pamamaraan at Patakarang Kolonyal ng mga Espanyol sa Pilipinas
Tuklasin ang mga pamamaraan at patakaran ng mga Espanyol sa Pilipinas, at ang epekto nito sa mga Pilipino.

How to Install and Configure Forge: A New Stable Diffusion Web UI
Learn to install and configure the new Forge web UI for Stable Diffusion, with tips on models and settings.
Found this summary useful?
Take it with you. One click puts it in your own LunaNotes library.
Save to LunaNotes