Understanding Market Perspectives: Smart Money vs. Uninformed Traders
- Smart money comprises institutional players and liquidity providers controlling price movements.
- Uninformed or speculative traders rely heavily on indicators, often misinterpreting market signals.
- The mentorship encourages abandoning indicator reliance to better observe smart money behavior. For a deeper dive into how institutional players influence price movements, see Understanding Market Efficiency: How Smart Money Drives Price Movements.
The Importance of Mindset Shift
- New traders have an advantage by adopting the smart money mindset early.
- Experienced traders must unlearn counterproductive habits tied to speculative trading.
- Recognizing that markets are manipulated by entities with superior information is key.
Core Trading Principles Covered
- Four primary drivers shaping price action: retracement, expansion, reversal, and consolidation.
- Emphasis on a broad foundational understanding before focusing on specific chart patterns or techniques. For foundational price action concepts, refer to Beginner's Guide to Price Action Trading: Trends & Consolidation Explained.
Practical Chart Work and Record Keeping
Recommended Chart Setup:
- Daily Chart: Display 9-12 months to identify major highs and lows.
- 4-Hour Chart: View at least 3 months to observe intermediate trends and clean price levels.
- 1-Hour Chart: Show 3 weeks to analyze daily ranges and intraday behavior.
- 15-Minute Chart: Include 3-4 days for detailed short-term price action.
Key Observations to Log:
- Rapid price movements away from specific levels.
- Recent highs and lows that have not been retested.
- Clean highs/lows (clusters of equal highs or lows) indicating liquidity points.
- Times and kill zones when these levels form (London vs. New York session).
Developing Analytical Discipline
- Maintain separate charts for different analyses to avoid clutter and confusion.
- Daily logging of price action supports clarity and professional-grade market understanding.
- Understanding market efficiency as a mechanism favoring smart money liquidity requirements. Explore more on market efficiency in Understanding Market Efficiency: How Smart Money Drives Price Movements.
Avoiding Premature Forecasting
- Resist the urge to predict price direction early in your learning.
- Focus on building experience through exposure and methodical data collection.
Long-Term Mentorship Goals
- Progressive monthly integration of deeper reference points on charts.
- Empower traders to identify order blocks, liquidity voids, and other institutional footprints. This is explored further in Mastering Market Maker Models: Forex, Indices & Stock Trading Insights.
- Foster flexibility in trade execution by reading market conditions over rigid adherence to preconceived ideas.
By embracing this structured approach, traders align with smart money tactics, developing skills through detailed market observations and disciplined record-keeping, laying a firm foundation for consistent trading success.
okay folks welcome back this is the third teaching of a series of eight for the first month of the ict
mentorship okay we're going to continue continuing on our theme of understanding the
mindset that you have to have going into the marketplace looking at things in a little bit reverse order
then you're normally taught from a retail perspective and this is one
this is one of those teachings that you're going to have that if you're new you actually have the advantage here
for folks that have been trading for a while that have adopted bad habits or
an understanding or a belief that they have an understanding it's going to be a little bit expensive
for them because they're going to have to purge some of the things that they
either subscribe to or wrestle with it until they either do or elect not to use this insight at all
i mapped out a a crude depiction here and i've been using it for months actually um as a
teaching tool but we're gonna really hammer it down in this mentorship because it's imperative
that you know how we as traders are supposed to be viewing
marketplace uh data delivery um reverse psychology whatever the psychology of this
informed money is it's going to be diametrically opposed to that of the uninformed or speculative
money or quote unquote dumb and when we have these ideas when we look at price okay the first thing we
have to do is establish who is the victim here you know generally there's a victim always in
every crime and the perspective that the speculative
uninformed money has is that number one they don't acknowledge that there's a smart money
there is not an entity out there that has uh quote unquote the right things always on uh the right perspective
or that a market is rigged or controlled or manipulated or has any influence over long-term price delivery
the uninformed money okay or those that are uninformed in regards to
how smart money actually operates and exists in the in the marketplace their actual perspective really is that
indicators are the answer and uninformed money their perspective holds
belief that price moves by indicators influence okay and the influence of an indicator being
overbought or sold that is what the precursor is to a market moving higher or lower and i can tell you i subscribed
to that for years as a new trader and it took a long time for me to actually be broken away from
that type of mindset so if you're new and you haven't been exposed to indicator itis and you're not
infected with that yet you're actually pretty good uh in in terms of advantage uh those that like
to use it indicators are going to have a little bit of a struggle with this mentorship because
i'm telling you basically you need to get that out of your system get that off your charts because it is not how you're
going to be able to see smart money in fact we're going to be able to use these indicators to be
uh informed as to what the uninformed traders are actually uh thinking so when we talk about sentiment next month
you'll have a lot more understanding about what that is how it's developed and what you can do with it
now obviously we only exposed one side of the the paradigm here by
specifically dealing with the speculative uninformed monies perspective uh you're not here to really
so much learn about those individuals because obviously no we all know that there's a losing crowd in the
marketplace and your idea of uh you know being a part of that group is foolish so we're here only to
focus on what the smart money view is on the marketplace and that begins by understanding that there is a huge vast
enormous new pool of liquidity coming into the marketplace every single day
even though there's new busted accounts all the time the statistics stated tell us that 90 of traders lose their money
large funds are in the same category not every fund is profitable just because there's a lot of people that are
investing money into this fund or this fund manager does not no way guarantee that that fund will exist a year two
years five years from now so we as informed traders our perspective is to
hold the perspective of what a liquidity provider or smart money view is on the marketplace and they put a spotlight on
the aspects of uninformed money because that's what makes the world go around in the marketplace the smart money is there
to provide liquidity but they're doing it at a exchange premium in other words they're putting in in
trades that they're gonna most likely come back to to either offset or neutralize for their
interests and we'll talk more about that as we go but for now understand that the smart money knows in fact that there is
a large body of uninformed money out there contrast that with what we spoke of concerning the uninformed money's
perspective is there's a lack of an entity out there that has a smart money perspective on the price they don't have
an opinion or an idea based uh perspective that there is someone or
some entity or entities out there that have a smart money perspective or that the banks would actually
you know trade against large uh firms or funds that that goes against the grain of what a free market
is so when we have a smart money perspective in the marketplace we
actually use their perspective as everybody else is liquidity
and price is delivered to engineer efficiency for the smart money entities only
it's not anything outside that so to hold the perspective of a liquidity provider you are adopting a
smart money perspective and everybody else is liquidity
and the liquidity is going to be in the form of buy stops sell stops pending orders above and below the market highs
that are most recently formed on your charts once we understand that there's two
distinct perspectives that's what creates the market efficiency paradigm both of
both groups okay have their individual perspectives the one that is smart money they have
the unique perspective of understanding already what the uninformed money is going to believe about the marketplace
and that gives them their edge on top of that they're actually in control of price just like anything else if you own
a storefront or if you're owning a business and your commodity is sold who sets the price for that commodity you
you're the store owner well currency is owned by the bank and they set the price on the value of that bank note or that
digit on your screen that says you have xyz number of dollars in or francs or pounds or whatever it is that you're uh
you measuring your currency in that's east that value is set by the central bank that has printed that money
and why this is such a uh speed bump for people's understanding is beyond me because if you look at the
state of the world we're in right now obviously corruption and deceit is the name of the game so
it's not a shock to hear if you first time being exposed to this that the central banks are in absolute control of
what their price of their currency is and they can set it at any time at any price they want don't believe me look at
what they did with the swiss franc and the euro when it was d-pegged instantaneous wipeout okay
so once we understand both perspectives okay intimately okay we no longer have a at odds
perspective on the marketplace we don't vilify the market maker we don't vilify smart money we don't beat up or
make fun of the uninformed money in fact what we do is we find a balance in between that and we don't think in terms
of victim or aggressor we just think in terms of efficiency because the markets are always going to trade in an
efficient manner but it's slanted and more prone to lace the pockets of the smart money
because they have the advantage of pricing wherever they want price to go to and they already know what the
perspective is of the uninformed money and they also know how to manipulate that perspective at any given time based
on chart patterns based on indicators based on just reactions to market news now as we go through this mentorship
we're going to be focusing primarily on your understanding of these four primary drivers in price delivery it's
retracement expansion reversal and consolidation now we're not going to talk specifically about that but i want
you to understand that all the things we're teaching here they're all frameworks for you to understand those
four general principles we can't teach specific
contexts or topics without having a broad based understanding of foundation and that's
what this entire month of september is doing it brings everybody to a reference point to start at the same location some
of you that are advanced that watch a lot of my free tutorials over the years you need to put that aside for a moment
and start with this perspective in mind and i promise you it's going to deliver everything that you skipped over we're
going to fill in all those gaps but understanding that the interbank price delivery algorithm okay to
understand that it's going to have to come by exposure and exposure creates experience that experience is going to
give you the understanding going into the charts seeing what they ex what they should be doing with price what you
should be seeing in price by seeing each individual component explained in detail and context
each individual part or component of the hole will be able to dovetail nicely and you'll understand how everything fits
together but suppress that desire to feel like you have to have techniques and and
patterns and intricate secrets about how the chart does this or chart does that
you have to have the framework in mind and the foundation of why these things exist otherwise all those little things
ain't going to make any sense to you when i'm calling on you to refer to them so with all that
what specifically should you be focusing on right now as a new student in this mentorship
the first thing you need to know is there are very little things you should be
bringing into your expectations and what your understanding should be
in other words basically what i'm saying is you need to have no previous knowledge brought in with
this kind of like put everything aside and assume it's very difficult for those who
have already gone through different disciplines of trading because they have to try to forget what
they already know and even if they've made money with it which is the worst thing that could have
ever happened is if anything outside of institutional order flow led to your profitability it really was just
coincidence and coincidence can happen for a long time i did it for nine months and was all pure luck and then it no
longer worked again so understanding right now what it is specifically you're supposed to be doing
that's important as a new mentor student the first thing you need to be doing is creating a daily price action log with
price charts now i know some of you don't want to do this some of you have resisted me uh
telling you for years to do this but i'm telling you you all are here and you've paid for this mentorship you paid for
the understanding and expecting experience that i've gained over the last 23 plus years
i can tell you how i got it was doing the very things i'm going to tell you to do in this
specific video it starts here if you skip this video if you skip what i'm teaching you in this video if you ignore
what i'm telling you what to do in regards to what specific things you should start with right now it does not
mean okay just because you've been trading longer than anybody else and because you have i understand what
optimal trade entry is because you understand what an order block bullish embarrasses before because you
understand what a liquidity void is that is not an advantage okay you need to go back to square one and understand that
this is strength in your development if you don't do these types of things you're actually going to hurt your
development you're going to hurt and stunt your growth throughout this mentorship
so go back to square one you're the new student do everything that's been
described here and advise because this is where the money starts coming in if you have these things in place and you
start right at this very core principle it will develop we're going to be focusing on this throughout the entire
12 months every month we're going to build on what rules and what things that you're supposed to be looking for in the
charts but for right now primarily the only thing i want you to be doing is starting with a daily chart
okay your daily chart needs to show 12 months no less than nine months view you have to have that much perspective on
your chart don't have so much of a perspective you have multiple years on your chart
12 months to nine months ideally okay you have a four hour chart and your four hour chart needs to have three
months of price action viewed the 60 minute chart or one hour chart has to have at least three weeks view
and the 15 minute chart needs to have at least three to four days view that means for every chart here i'm recommending a
specific amount of data that needs to be displayed for that respective time frame what you need to resist doing right now
is you need to resist the urge to forecast price movements that's not for your stage of development right now
do not try to rush ahead and try to figure out what the market's going to do next because that's going to be a
problem for you and it's only going to lead to frustration we will get you there and it's going to happen in due
time but for now resist that urge but there are some things you need to be specifically dealing with these charts
you need to note where price shown a quick movement from a specific level in other words if it's
run quickly higher or lower from a particular level that's noteworthy you need to note that on your chart you need
to also note recent highs and lows that haven't been retested that means if a high's formed on your chart if the price
has not come back up to that level in recent time okay you need to make a special note of that because it's going
to probably be influential going in the future vice versa just contrarily speaking you're going to be able to look
for the lows that have formed that have not been recently traded to and that low will be influential later on in future
price delivery as well note areas on the charts where price has left clean highs and clean lows
basically that looks like two equal highs that formed in close proximity to one another um
when we whenever we see a high go up and form and then it trades away from that for a little while and comes right
back to it and doesn't make a new high or maybe it falls just a little bit shorter just a little bit above it
i note that as a clean high and usually buy stops will form above that and the market will usually come back up there
and run through that it doesn't mean it won't continue through it but it's usually a big
bullseye for a price to want to go up into that area and the reverse is said for double bottoms or equal lows when a
low is formed and another low is equally formed in close proximity to the initial one
that's a big area for sell stops to pull or build up underneath those lows and the market tends to have a willingness
to go down there and test that liquidity that means the market will go down into that area whether it continues to go
lower or if it goes down and then reverses there's conditions that we look for to frame all that and you will know
when to expect the specific conditions but for now i want you to start practicing looking for that in your
charts and having them noted on your chart note what days the highs and the lows
form and this is for the weekly range and you
want to know what time of day that occurs what kill zone is it the high and low of the
week forming in london or is it forming in new york because all those things are going to lend well to
prognostication and what should happen going forward and you want to note the daily high and
the daily low every single trading day and you want to note when the daily high and the daily low forms for every
individual uh trading day now what does that look like well it
starts off with a bare bones chart this is a daily chart and i'm using the swiss franc here it could be any chart any
pair but you want to start with one currency pair and then it's mentorship you want to specifically deal with one
i would recommend you doing something apart from the british pound and the euro only because you're going to see me
specifically dealing with that in this individual mentorship but you want to be doing something with a
currency pair that is not being utilized in this mentorship that way you're getting a unique perspective that you
yourself have arrived at using this as a guideline but the first thing you want to do is
obviously note the most recent highs in the recent lows where markets have shown a willingness to repel from that's
the first thing you want to note because this is how you identify order blocks this is how you identify liquidity voids
this is all the beginning frameworks of that but you need to be able to note those recent highs and recent lows
that's what's been done for you here next you're going to drop down into a four hour chart and those same levels of
this noted on the daily chart are shown here and there's more highs and more lows
that come into visibility by doing a lower time frame perspective we went from again
the chart was a daily chart before now we're looking at the same levels just
drop down into a four-hour chart those levels will be transposed immediately to what the four-hour chart shows then you
go through doing the same thing you're looking for areas where it's too clean equal highs and equal lows and close
proximity to one another and you look for where the market has moved quickly away from a particular level when it
creates these real big candles or bars okay on your chart you want to note that because they're going to be influential
in your expectations of where price should go and where they should not go you're going to go down to an hourly
chart okay an hourly chart you're going to be looking at individual
days okay over a course of one or two weeks and you can get the weekly range
defined with the hourly chart and you can look at the intraday highs and lows with an hour already charge a really
good bellwether chart if you're a short-term trader or a day trader that's like the daily chart for uh you know the
barometer whether you should be a buyer or seller and we'll teach all those things all those instant details will be
taught in this mentorship for now you'll be taking all those levels you found on the daily chart the four hour and
transposing those to an hourly chart now you want to keep this chart okay in this format
separate from all the other charts that i'm going to talk about now okay anything else we talk about in terms of
what we're specifically looking for they don't get utilized on the same chart you create another chart so you're
going to have two individual independent us swissy charts okay but you're going to carry
the information on two separate charts that way you don't have charts that are too busy have too many things on there
and you get confused and all kinds of things that we're worrying about then you'll kind of create another swiss
franc chart okay and for that you're going to use a 15-minute chart and when it's loaded obviously it's going to be
naked bare nothing on there and the 15-minute chart looks like a lot of noise it doesn't give you any
perspective without any frames of reference and you want to take the course of action we talked about
using the daily the four hour in one hour chart do that same thing with the
individual 15 minute chart but you only need to be applying it to the last 15 i'm sorry last
three days three to four days and using those reference points in the last three to four days on a 15-minute chart
okay you're gonna be looking at also the daily highs and the daily lows and you can see this is how i do my charts on a
15-minute basis you're actually going to see me actually do this very practice every single day going forward starting
with this week that we're going to enter into the mentorship i note the previous days highs in the
previous days lows and then draw them out to where zero gmt is which is eight o'clock in that evening time in my time
frame and in this delivery of data with this platform this is how i know my daily highs and
daily lows it's important to note also the days of the week now i'm not going to give you all the specifics here
because you're actually going to be watching me do it on a day-to-day basis so you'll be able to get a rough idea
in this tutorial but more specifically you can actually see me actually creating documents
for my individual record keeping so you're going to see actually how i do my charts how i log
them and yes even after 23 years of trading i still do this it's important to do it it's
understanding it's clarity it gives you perspective and it's what professionals do sorry it's just there's no way around
it the folks that are really concerned about the market they have logs they keep journals these are the
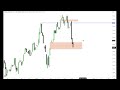
types of things they do if you notice real quick why noting the previous day's highs in previous days
lows if you look at wednesday's data okay you see the little
delineation where it says wednesday if you look at the previous day obviously it would be tuesday in the course of a
normal week the high that was formed on tuesday on wednesday price came right up there
and ran through that around the 97 90 level uh notice it did not continue through
that it just went up through the previous days or tuesday's high then it sold off
when it sold off it went all the way down where did it go down to just any old level it went down
to tuesday's low just breaching it by a pip or two and then came back off into consolidation
then look at what happened on thursday thursday we had price retraced back into the range that was created from
wednesday's high down into wednesday's low thursday starts today with trading and
consolidation it rallies up closes in a range okay that was formed from wednesday's
high and wednesday's low then it sells off and where does it sell off to moving just below
then it pulls off that low and goes into consolidation then we have friday
the market just goes straight on up rolls right on through thursday's high
and creating a new high prior to friday the weekly high was formed on wednesday it ran out the stops and all the
liquidity that would be resting above wednesday's high all done on friday so we're going to be
using these reference points and giving you a lot more insight about specifics and what you're doing
with it but for now i want you to know that this is what you're going to be doing
going forward every single trading day you're going to document price action you're going to build on your
understanding every month i give you more reference points to add to your charts and why
it's important what specific what the information will do for you what uh with advantages it gives to you by
having it and by having your charts very uniformly organized like this
when you're trading your chart is going to have its independent uh analysis you're not going
to have all these things on your chart but these charts are always going to be referred to while you're watching price
because by having three charts okay because you're gonna have one that's executable
in other words what you're watching on the setup right now because you never want to marry the ideas that you have in
your analysis you need to reflect on them but you don't want to be so cast iron can't do it any other way it has to
be that way otherwise if you're watching real-time price action if you see something that doesn't make sense for
what the underlying conditions that you're expecting occurs in the marketplace
you won't have the flexibility to switch gears or go to the sidelines you'll just hold on to the market with strong
conviction and that that's imposing your will that the market's going to do what they're going to do and it's not going
to happen because you want it to happen it's going to happen because it's going to happen and we try to get in sync with
what the market's going to do whether it's going to be moving sideways whether it's going to go higher whether it's
going to lower we don't know any of those uh directions with a great deal of certainty we just know probabilities
and but we know how to go into the marketplace looking for these types of things over and over and over again they
repeat and you'll be able to find those repeating uh occurrences in price action after
going through this mentorship
Smart money refers to institutional players and liquidity providers who control price movements in the market, while uninformed or speculative traders often rely on technical indicators and may misinterpret market signals. Understanding this distinction helps traders align with the behaviors of market movers rather than following potentially misleading indicators.
Adopting a smart money mindset means recognizing that the market is influenced by informed entities with superior information, which requires abandoning reliance on conventional indicators. By focusing on price action and market structure like institutional players do, traders—especially beginners—can develop clearer insights and avoid common pitfalls associated with speculation.
The four main drivers shaping price action to focus on are retracement, expansion, reversal, and consolidation. Understanding these foundational concepts provides a broad base before diving into specific chart patterns or trading techniques, enabling a more nuanced interpretation of market movements.
To analyze price action effectively, use multiple timeframes: the daily chart spanning 9-12 months to identify major highs and lows; the 4-hour chart covering at least 3 months for intermediate trends and clean price levels; the 1-hour chart showing 3 weeks for daily ranges; and the 15-minute chart with 3-4 days for short-term behavior. Logging observations such as rapid price moves, untapped highs/lows, and liquidity points during specific sessions further enhances your analysis.
Daily logging helps maintain analytical discipline by providing a clear record of price behavior and relevant market conditions, supporting professional-grade understanding. Keeping separate charts for different analyses prevents clutter and confusion, allowing traders to focus distinctly on each timeframe and aspect without mixing data, which improves clarity and decision-making.
New traders are advised to avoid premature forecasting or predicting price direction too early in their learning process. Instead, they should build experience through systematic observation and data collection. Trade execution should remain flexible, based on reading current market conditions rather than rigid adherence to preconceived ideas, allowing adaptation to the strategies employed by smart money.
The mentorship program aims to progressively integrate deeper reference points on charts, enabling traders to identify institutional footprints like order blocks and liquidity voids. This structured approach fosters skills in detailed market observation and disciplined record-keeping, ultimately aligning traders with smart money tactics to achieve consistent trading success over time.
Keep this summary
Save it to LunaNotes and it becomes a real note in your library — editable, searchable, and ready to turn into flashcards or a diagram. Free to start.
Save to LunaNotesOr summarise for another video.
This summary and transcript were automatically generated using AI with the Free YouTube Transcript Summary Tool by LunaNotes.
Related summaries

Understanding Market Efficiency: How Smart Money Drives Price Movements
This comprehensive guide unpacks the market efficiency paradigm, revealing how a small group of smart money traders—primarily banks and institutional players—control price movements, not the large retail crowd. Learn to recognize the distinct phases of price delivery, including consolidation, expansion, reversal, and retracement, and apply this knowledge to enhance trading strategies.
Mastering Market Maker Models: Forex, Indices & Stock Trading Insights
Discover expert analysis on the dollar index, forex pairs, gold, crude oil, and major indices, emphasizing anticipation over reaction in trading. Learn practical market maker buy and sell models, smart money reversals, and actionable strategies for consistent trading success.
Complete Trading Mastery: From Basics to Million-Dollar Strategy
Discover a comprehensive 10-hour guide teaching you how to trade markets effectively from scratch. Learn to analyze market structures, identify key trading patterns like head and shoulders, apply confluence strategies, and manage risk to grow from beginner to a profitable trader. This video includes live trade breakdowns and real-time insights from a seasoned trader’s journey from $100 to six figures.
Ultimate Beginner's Day Trading Guide 2025: Mindset to Strategy
Discover the comprehensive day trading tutorial for 2025 designed for beginners. Learn essential concepts such as mindset, risk management, market structure, and strategic tools like liquidity, order blocks, and fair value gaps. Built on years of experience, this guide offers a step-by-step approach to developing profitable trading skills with an emphasis on consistency and discipline.
Mastering Trading Psychology: Randy How's Insights on Emotional Mastery
Discover the essential psychological challenges traders face and learn expert strategies from renowned trading psychologist Randy How. This comprehensive summary unpacks how mastering emotions, relinquishing control, and developing discipline are key to consistent trading success.
Most viewed summaries

A Comprehensive Guide to Using Stable Diffusion Forge UI
Explore the Stable Diffusion Forge UI, customizable settings, models, and more to enhance your image generation experience.

Kolonyalismo at Imperyalismo: Ang Kasaysayan ng Pagsakop sa Pilipinas
Tuklasin ang kasaysayan ng kolonyalismo at imperyalismo sa Pilipinas sa pamamagitan ni Ferdinand Magellan.

Mastering Inpainting with Stable Diffusion: Fix Mistakes and Enhance Your Images
Learn to fix mistakes and enhance images with Stable Diffusion's inpainting features effectively.

Pamamaraan at Patakarang Kolonyal ng mga Espanyol sa Pilipinas
Tuklasin ang mga pamamaraan at patakaran ng mga Espanyol sa Pilipinas, at ang epekto nito sa mga Pilipino.

How to Install and Configure Forge: A New Stable Diffusion Web UI
Learn to install and configure the new Forge web UI for Stable Diffusion, with tips on models and settings.
Found this summary useful?
Take it with you. One click puts it in your own LunaNotes library.
Save to LunaNotes