Understanding Equilibrium vs Premium in Trading
In this session, we explore the differences between equilibrium and premium markets, building on prior teachings that focused on equilibrium versus discount scenarios. The key concepts center on identifying price movements within defined ranges and using Fibonacci retracement levels to anticipate market behavior. For a deeper foundation in price action, see Beginner's Guide to Price Action Trading: Trends & Consolidation Explained.
Identifying Impulse Price Swings
- Look for clear impulse price swings that constitute a larger impulse leg.
- Use these price swings to anchor Fibonacci retracements, typically drawing from the high to the lowest low within the price range.
Utilizing Fibonacci Retracements
- The crucial retracement zones to monitor are between 62% and 79%, regarded as optimal trade entry (OTE) levels.
- Markets trading above the 50% retracement level, or equilibrium, are considered to be in a premium state, indicating overbought conditions ripe for selling opportunities.
Differentiating Equilibrium and Premium Markets
- Equilibrium is identified as the 50% retracement level.
- Premium markets exceed this level, moving towards the 62-79% retracement zone.
- Price action failing to surpass the equilibrium level signals no immediate selling opportunity.
Executing Trades in Premium Markets
- Sell short when price retraces into the premium range (above equilibrium) and approaches the 62-79% Fibonacci levels.
- Anticipate potential stop runs above prior highs, a phenomenon known as turtle soup, which tests stop-loss levels before reversing lower. This strategy aligns with concepts outlined in Mastering Smart Money Mindset and Price Action for Market Success.
- Take profits below previous swing lows to maximize gains while managing risk.
Practical Examples and Trade Management
- Use daily and hourly charts to locate impulse swings and define ranges.
- Recognize that setting stops above previous highs during premium market conditions offers favorable risk-to-reward ratios.
- Maintain discipline in taking partial profits at initial swing lows to avoid full stop-outs due to market volatility.
Trading within Consolidations and Ranges
- Price often moves sideways in consolidations; trading premium and discount levels within these ranges remain highly effective.
- Breaking out of the range is not necessary to profit; understanding and trading within established ranges provides consistent opportunities. Further insights can be found in Complete Trading Mastery: From Basics to Million-Dollar Strategy.
Key Takeaways for Traders
- Define clear impulse swings and anchor Fibonacci retracements accurately.
- Identify equilibrium (50%) and use premium levels (62-79%) as key selling zones.
- Expect and plan for stop runs (turtle soup scenarios) when price breaches old highs.
- Use multiple time frames (daily and hourly) to confirm setups.
- Trade ranges confidently without depending on trend direction.
By mastering these concepts, traders can enhance their ability to sell into strength, effectively manage risk, and harness consistent profits by understanding equilibrium and premium price dynamics.
welcome back folks this is ict with a fifth installment of the eight in the continuing series for the first month of
the ict mentorship for the month of september uh the previous tutorial in session four
we looked at equilibrium versus discount in this session we're looking at equilibrium versus premium
we went through a great deal of content in regards to discount versus equilibrium so
we won't have to spend so much time with this tutorial because everything we're selling here is basically diametrically
opposed to what you would expect to see in the equilibrium versus discount
teaching so looking at what we have when we look for
premium markets markets that are in a premium now when we talk about commodities later on in this mentorship
uh the the topic of premium will come up again but when i'm referring to premium as it
relates to price action uh i'm actually referring to the current range that we're uh trading in
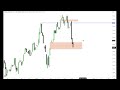
and the first thing we look for is an impulse price swing which is we have an
impulse price point here we have another impulse price one here we have another impulse price swing here
so the first thing we look for in price is an impulse swing and we see one here
we see another one here we see another one here and
these three price swings actually make up one larger price swing
which is an impulse leg or impulse swing by itself by its own right so
when we define our ranges okay the use of the fibonacci is helpful in this case because we can take
the fib draw from a high down to a price low and i'm using this low here because it's
the most lowest in contrast to this high
and price comes all the way back up to what i have taught in many years the optimal trade entry which is a
standard 79 to 60 retracement level on the fib now i didn't create that but
if it was just simply looking at that alone 62 percent to 700 levels uh looking for buys and sells there
everywhere we loaded it would be no no work at all in terms of uh taking trades but obviously you probably learned very
quickly there's much more to it than just pulling a fib over top of price swings
we have in this larger price swing we have a
smaller price swing here okay and we have the high down to this low and the market starts to retrace
equilibrium or half of the impulse price swing has to be at least touched and then once
it hits that we watch for price to reach up into this area here then there's other
disciplines out there and other mentors other teachers will say that the 50 retracement level is a good level to
trade at based on price swings i don't agree with that um i understand that sometimes it's going to work but what i
want to do is i want to be selling at a market that's at a premium level for a market to be at a premium in this
current price range here and it's assuming none of the price action from this high
down all the way to the right has not happened yet so you'd be watching price in this initial range
and price did not get back up to the midway point or 50 percent of the uh the range that was created from the high
to low that's all equilibrium is is fifty percent on the fit let's have to tell them describing it but the concept
is is you have to see a market price a move above the halfway point once it
does that start it starts going into what is referred to as a premium market that means it's at a really high price
relative to its current trading range we don't need overbought never sold indicators to help us
classify an overvoter we're sold market we just simply need to know the current price range we're trading in and if we
get above the 50 level okay we start getting into what would be deemed as overbought or at a premium level
on this pricing here it obviously never gets above the 50 and everything touches it so it never gives us an opportunity
to get short relative to this time frame or this price swing
so there would be nothing to do there the next price leg here
okay the same thing from this high to this low not nothing in terms of that price swing there it doesn't get back up
to the 50 uh level but look closer there's another smaller price swing that has formed right in here
okay so we could look at that measure the high to the low and the market gets right to
a pre uh i'm sorry equilibrium but does not stay above to go to a premium market it only goes right to the fibonacci 50
level or what we deem as equilibrium so price goes to an equilibrium price point and then immediately sells off this
would be a missed opportunity in regards to looking at equilibrium to premium the reason why we
want to focus primarily on the 62 or 79 trace levels in that range to be selling short
is because the market's going to be really pressed higher and would be really
in terms of overbought never sold it would be very overbought and it would be expecting a willingness to to sell
softer and go lower there's going to be times when the market does not give that scenario to you and you just got to let
those particular price links go without you the next price swing
is this high to this low market trades back up to equilibrium here and move this over so you can see a
little bit better okay so market trades back to equilibrium goes back above it into a
premium market and it goes right on through what would be deemed as an optimal trade
entry okay or selling at a premium so here's a wonderful thing about this you can look at this and say okay if i'm
measuring this high to this low and i'm going to be selling i'm above equilibrium i want to get short
in this area between 62 and 79 chasing level okay you look over here
maybe there's something over here institutionally um in terms of a bearish order block or something like that you
can define we're going to say that that's not there we're going to say that we went short just purely on price
action retracing back into the fibonacci level here it comes all the way up and hits you where your stop would be
when you see these conditions where the market trades above equilibrium and goes through the levels of 62 and 79 certain
trace levels what that does is it gives you a condition that we saw in the equilibrium to discount if it
takes out a previous low when it's in discount it's probably going to be a turtle suit by
in this case it's going to be a turtle soup cell it's going to be reaching for stops above
the impulse swings high and you see that here it goes up runs
out the stops here and then goes lower where is it going to go where do you take profits at below lows it's already
established in the marketplace here and here you see that's exactly what the market does
you can also use when you're defining your ranges all price swings from high down to low
okay you you want to anchor your your fibonacci on the market goes down from this high all
the way down to here okay and creates that low as soon as we start seeing it bounce up
you need four candles remember it's the same thing we just saw on the equilibrium to discount
teaching once you see a a swing low form you're watching that fourth candle to show willingness to go higher it does
but then you simply wait here's the equilibrium price point this this fifty percent level in the fifth
price goes through that so now you're gonna be watching it you're gonna want to see if price gets to sixty two the
seven tracing levels it does and it does it while it's running out that high here so two scenarios one you
could have used this high down to this low and got a stop out in the initial
uh 62 to 700 tracement levels where we saw earlier but it ran right through it if you had not anchored your fib to this
high to this low you would never see this optimal trade entry okay or return to a
premium to go short is above the equilibrium price point and it takes out an old high
so we're running stops at an old high and we're going back into what would be a premium market we're above the
equilibrium price point of the range high and the range low and we take stops out
that's really really good in terms of probabilities and the market goes down and sweeps out a previous low remember
when we were looking at the equilibrium discount every time we were buying we were taking profits at above an old high
okay so when you see that all we're seeing is the reverse of that in the equilibrium versus premium market so
we're always looking to sell at a premium premium is defined by has to be above the equilibrium price point or 50
50 level of the fibonacci anchored on a swing of clear
discernible price action in other words if it looks sloppy if you if it doesn't really look like a solid price swing and
obviously obvious price swings are the ones we look at we're not looking at anything it looks questionable if it's a
pure price swing we measure it and this is a high this is a low and we went through all
potential stages of all these high to low high to low high low scenarios really nice scenario here again taking
profits initially below this low here when it would hit that and then you'd hold out for a potential run for some of
your trade to be taken off below this low here now the market goes into another uh area
of premium relative to equilibrium we go back to this larger price swing
here this low all up to this high the market goes right into the 79
79 retracement level hits it perfectly to the pit and then rolls down where do you take
your profits at you're gonna be looking to take profits at below this low here
okay and into the order block down in here which is what you see right there
okay you have another range that you can use
this high to this low okay
now what's up what's really nice about this is if the market's in a consolidation this type of trading
is your go-to okay a long protractionary state in the marketplace where it goes up and down no no real movement higher
in one direction or lower in one direction it just stays in a large consolidation you want to be trading
turtle soups or understanding where premium and discount are if you have the high here and you pull
it down to the low here when the market gets above equilibrium right in here it goes right into the 17.5 or what would
be the optimal trade entry sweet spot okay or ote and the market is a sell-off there where
where do you look to take your profits at below and old low
or below this low right there every time the market makes a swing low
you have to take a look and it only takes three candles this is why i do not use the
williams uh fractal it requires five candles i only need three candles so we have a candle low here a lower candle
low here a small smaller little candle in here the market
blows through that that would be your uh your target right there you would take first profit then you would come back
and end up taking your stop out right there now if you get a stop
and say you don't take first profit the slave doubles advocate for a moment say you're greedy you're impatient you're
developing you just don't want to do anything to take some profits out
or it couldn't happen for you you didn't do it like that the mark comes back and takes your stop loss out
if you see that scenario okay you're gonna be looking for old highs to be breached
while we're above the fifty percent uh level so we're in pre we're at a deep premium okay so markets are overbought
right in here the market runs through this previous high so we're in turtle soup scenario
we could be looking for turtle soup cells mark comes up starts to come down
one more time runs through you takes your stop out again this is going to happen in your trading
do not try to avoid it because it's going to happen same scenario
we have an old high mark goes back above it if it's at a premium and you've defined the range here
you take this scenario as a cell on turtle suit basis for each above an old high sell short
we're going to take profits at below the first low that's here the next low is right here
then we have another range created here so while we're watching this form soon as we see a swing low form this candle
here we know they're probably going to want to run back up into this range here now we have a new range
the impulse price swing is this high down to this low
here's equilibrium price expands to equilibrium once we start seeing that we watch does it get to 62 it does the
bodies of the candle stop perfectly right there you could sell short right there what's nice is you're going to see
the bottom of this candle is up candle that's a bearish overblock which you'll learn more about
that's a cell by itself where you look to take profits at below the old low right in here
it goes right down below that and does what trades back up higher
if we use the price swing from that high we just anchored two to this low
the same thing occurs here we have this high all the way down to this price low price comes all up into the 79 trace
level above equilibrium we start watching it now we're in an area where the price is going into equilibrium i'm
sorry from equilibrium up into premium okay premium is above equilibrium in a range that's been defined from high to
low and look what's happening we're running out an area of stops above it or high
again very very good uh probabilities for getting short take that as a turtle suit inside of a
premium based market and you could look to take profits on a swing low
here's your swing low here the market trades down through that you'd have to take profits below here
market trades down in two small little consolidation here and i'm not going to define anything else that's
in this chart because i could do all kinds of other things to it would look like sugar coating but
you'll learn other things to look at and it has to do with this can over here so we'll refer to this candle later on
and uh recapitalize bullish shoulder blocks and bear shorter blocks but
the market creates another range this high down to this low here so this high down to this low market
goes above equilibrium here where is it going to go to we want to watch it go to at least 62 percent tracing level it
does that goes right after the 70.5 ote optimal trade entry and then sells off where you take profits at below swing
low right here's the swing low take profits right there now they're not astronomical trades okay they're not
enormous trades but to get short in here at 98 big figure and covering below the low on this
candle here at 96.94 that's over 100 pips nothing wrong with that this is a daily
chart we're trading off of again this is helping these folks that cannot be doing
day trades okay you don't need a great deal of movement on a daily chart to make a decent amount
of pips we're going to go back to this high and use that same old low here okay
from this high down to this low if you went short here based on stop run above here and we're at a premium we're above
the equilibrium we've defined our range we're looking to sell into strength it's scary when you first start looking at it
as a new trader but that's exactly what you want to be doing as a professional trader you want
to be selling at premium prices think about it you could sell something if you own it say you own a car and you
want to sell your car do you want to sell it at a discount that doesn't make any sense you want to sell at a premium
so professional traders sell their long positions or they sell new short positions at premium prices
ain't no better place in the world to sell short or sell longs above an old high because there's going to be willing
buyers right there in the form of buy stops so when we see this area here we get
short from this area here going short and if you just took profits once this low
formed that low comes in at 39 97 39 and the open is
97.99 so we're going to say we went short somewhere around about 98 big figure the low comes in at 97.39 so that
means your stop i'm sorry your limit order take profits would be below 97.39 so you get the low here say you're
aiming for 10 pips below that low below this low right here you'd be looking for
97.29 roughly 97 30. that's 70 pips using a setup that's on a daily chart you're not interested
trading you're not looking at five minutes 15 minute charts you know you're not you're not being forced to do what
ict does most of his teachings through intraday uh trading but the same concepts appear in these higher time
frame charts so don't discount it that i'm teaching you in a 15-minute basis because all the concepts are universal
and i know it's hard for you to understand that as a new trader because it just seems like i can't be watching
that chart so therefore i can't trade that's not true that's not true at all so
by having these ideas of looking at price over the course of a premium market if we go down to a
say we go down to an hourly chart okay and what's nice is you don't have to trade with a bias
most people are always asking me hey looking can you give me a a a way of trading with a a daily bias give me the
trend direction michael i need to know that well you don't really need to know that you don't need to know it
and the reason why you don't need to know it is because you need to know how to trade inside of a range
because those ranges are always there whether you're in a trending market whether you're in consolidation or
whether in a reversal market those profiles will always give you ranges to trade in and you don't need to
break out of the range to make money we have a swing high here why am i using that swing high michael
not this one here not this one here because this is the most recent one prior to this down move i could use this
one here but i'm going to use this because it has more price action around it
this high down to the lowest low okay market trades up to the equilibrium in here
okay does it get to premium no it doesn't get up there yet it comes down off of this a little bit then trades
right up into 79 tradesmen level right in here closes in a range which we'll talk about
in the next teaching over here the market sale that sells off
and where you're going to be looking to take profits at you have a small little swing low here you have a certain real
good swing low here so if you're getting short up here and on an hourly basis
say we got short at 97.70 nice round number to get out that level here's 42 pips to
get out below this low here 60 pips so if you go 10 pips below that that'll give you
oh nice 70 pips and give you a nice 70 pips and there
look at the reaction going 10 pips below here yeah this range low
from that high up here where we would have been selling at based on the concepts again it's all hypothetical in
hindsight here but the conceptual idea is the same going forward range is 60 pips 10 pips below will be
70. you got at least four pips below that for uh for spread to take you out and absolutely does that and it doesn't
go very much a little at all
Equilibrium markets are defined by price retracing to the 50% Fibonacci level, indicating a balanced state between buyers and sellers. Premium markets occur when price moves above this 50% level, into the 62-79% retracement zone, signaling overbought conditions that often present selling opportunities.
To identify impulse price swings, look for strong, clear directional moves that form a larger impulse leg within the chart. Anchor your Fibonacci retracement from the highest high to the lowest low of this move, which helps pinpoint strategic retracement levels for potential trade entries.
The 62-79% retracement zone, known as the optimal trade entry (OTE) area, often coincides with premium market conditions where price is likely to reverse after a strong impulse swing. Entering trades in this zone allows traders to capitalize on probable trend continuation or reversals with favorable risk-reward setups.
A 'turtle soup' stop run occurs when price briefly exceeds prior swing highs to trigger stop-loss orders before reversing lower. When trading premium markets, expect these false breakouts; place stop-losses just beyond these highs and consider partial profit-taking at initial swing lows to protect against volatility and minimize losses.
Yes, trading within established ranges using premium and discount Fibonacci levels is effective even without breakouts. Understanding price dynamics within consolidations allows you to sell into strength or buy into weakness confidently, providing consistent trading opportunities without relying on trend direction changes.
Using multiple time frames, such as daily and hourly charts, helps accurately identify impulse swings and retracement levels by confirming the strength and validity of trade setups. This approach enhances entry timing, risk management, and overall trade confidence when engaging in equilibrium versus premium market strategies.
First, identify a price retracement above the 50% equilibrium level reaching into the 62-79% premium zone. Enter a short position in this optimal trade entry area, anticipate a potential stop run above previous highs, set your stop-loss just above these highs, and plan to take profits below prior swing lows to maximize gains while managing risk effectively.
Keep this summary
Save it to LunaNotes and it becomes a real note in your library — editable, searchable, and ready to turn into flashcards or a diagram. Free to start.
Save to LunaNotesOr summarise for another video.
This summary and transcript were automatically generated using AI with the Free YouTube Transcript Summary Tool by LunaNotes.
Related summaries

Mastering Fair Value and Market Maker Perspectives in Price Action
This in-depth guide explores fair valuation from both equilibrium and market maker viewpoints. Learn how to identify discount, premium, and equilibrium zones, liquidity gaps, and voids to anticipate price movements and optimize trade entries. Understand institutional order flow and market maker strategies to align your trading with smart money actions.
Mastering Market Maker Models: Forex, Indices & Stock Trading Insights
Discover expert analysis on the dollar index, forex pairs, gold, crude oil, and major indices, emphasizing anticipation over reaction in trading. Learn practical market maker buy and sell models, smart money reversals, and actionable strategies for consistent trading success.

Understanding Impulse Price Swings and Market Protraction in Trading
This summary explores impulse price swings and market protraction, explaining their characteristics and time-sensitive behavior in global trading sessions. Learn how protraction phases manipulate market sentiment around key time markers like New York and London openings for strategic trading decisions.
Complete Trading Mastery: From Basics to Million-Dollar Strategy
Discover a comprehensive 10-hour guide teaching you how to trade markets effectively from scratch. Learn to analyze market structures, identify key trading patterns like head and shoulders, apply confluence strategies, and manage risk to grow from beginner to a profitable trader. This video includes live trade breakdowns and real-time insights from a seasoned trader’s journey from $100 to six figures.
Beginner's Guide to Price Action Trading: Trends & Consolidation Explained
This free beginner-friendly video course introduces the fundamentals of price action trading, focusing on understanding uptrends, downtrends, and consolidation. Learn how to identify market trends, avoid common pitfalls, and set up essential trading tools for success.
Most viewed summaries

A Comprehensive Guide to Using Stable Diffusion Forge UI
Explore the Stable Diffusion Forge UI, customizable settings, models, and more to enhance your image generation experience.

Kolonyalismo at Imperyalismo: Ang Kasaysayan ng Pagsakop sa Pilipinas
Tuklasin ang kasaysayan ng kolonyalismo at imperyalismo sa Pilipinas sa pamamagitan ni Ferdinand Magellan.

Mastering Inpainting with Stable Diffusion: Fix Mistakes and Enhance Your Images
Learn to fix mistakes and enhance images with Stable Diffusion's inpainting features effectively.

Pamamaraan at Patakarang Kolonyal ng mga Espanyol sa Pilipinas
Tuklasin ang mga pamamaraan at patakaran ng mga Espanyol sa Pilipinas, at ang epekto nito sa mga Pilipino.

How to Install and Configure Forge: A New Stable Diffusion Web UI
Learn to install and configure the new Forge web UI for Stable Diffusion, with tips on models and settings.
Found this summary useful?
Take it with you. One click puts it in your own LunaNotes library.
Save to LunaNotes