Understanding Fair Value in Forex Trading
Fair value in trading encompasses two critical perspectives: the equilibrium price formed by equal distance between highs and lows, and the market maker's valuation based on price efficiency and liquidity. For an in-depth understanding, see Understanding Fair Value Gaps in Trading: A Comprehensive Guide.
Equilibrium Price and Trading Ranges
- Equilibrium Definition: The midpoint between a defined high and low in a trading range represents fair value or equilibrium.
- Price often consolidates near this midpoint before the next directional move.
- Recognizing the position within the current trading range (upper third, middle, lower third) helps identify if the market is at a premium, equilibrium, or discount. This ties closely to Mastering Equilibrium vs Premium Markets: Advanced Fibonacci Trading Strategies.
Discount and Premium Markets
- Discount Market: Trading occurs in the lower third of the recent impulse price swing, considered favorable for buyers and accumulation by market makers.
- Premium Market: Trading in the upper third signals potential selling or distribution areas.
Liquidity Voids and Gaps
- Defined as sharp, large-range price movements with minimal wicks, representing areas where price moved too quickly, leaving little trading volume.
- Market makers aim to revisit these gaps (fair value gaps) to balance inventory by filling untraded price levels.
Market Maker’s Perspective on Fair Valuation
- Market makers accumulate long positions at discount levels within a range and distribute or liquidate these positions at premium levels.
- Price movements between buy stops (above highs) and sell stops (below lows) represent institutional order flow driving the market. To explore this concept further, review Mastering Market Maker Models: Forex, Indices & Stock Trading Insights and Understanding Market Efficiency: How Smart Money Drives Price Movements.
Identifying High-Probability Trade Setups
- Look for price moving into the lower third of a significant range near equilibrium to consider long positions aligned with market maker accumulation.
- Observe liquidity pools and order blocks, areas where large traders have previously entered or exited positions.
- Confirmation comes from price testing and respecting equilibrium levels and liquidity gaps.
Avoiding Retail Pitfalls
- Retail traders often misinterpret premium prices as opportunities to buy, risking entry near market maker distribution zones.
- Adopting the market maker's mindset involves viewing price through the lens of fair value, discount, and premium, rather than chasing momentum. For mindset and price action mastery, see Mastering Smart Money Mindset and Price Action for Market Success.
Practical Application and Trade Management
- Anticipate consolidation phases and the subsequent breakout direction by analyzing price behavior around fair value and liquidity zones.
- Plan exits near premium levels where market makers are likely to liquidate positions.
- Use Fibonacci retracement levels thoughtfully; price action context is paramount to avoid getting trapped in false signals.
Conclusion
Mastering fair valuation requires understanding price as a product of market maker activity within defined trading ranges and liquidity environments. By shifting perspective away from retail biases and focusing on institutional order flow, traders can anticipate market moves with greater clarity, improving timing and risk management in their trading strategies.
e welcome back folks this is ICT with a sixth installment of the eight teachings
of September 2016 ICT mentorship we're going to be specifically dealing with Fair valuation
in this teaching and fair valuation comes in the form of two perspectives fair value in
regards to equal distance of a higher low or what we would call equilibrium or fair value for the perspective on
valuation in regards to market makers and I'm going to combine both of them to give you the perspective that you have
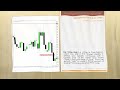
to have when you look at Price this is actually a chart that we mapped out in advance talking about a
lot of these very specific things here uh in the week that of this tutorial's uh production uh September 24th
2016 um we called Australian dollar higher based on the things that I'm going to cover here I was aiming for
7665 as a weekly objective and you can clearly see here the market did in fact hit
that what led to these ideas behind me giving these upside objectives from an area down here well first
you have to understand there's a lot of overlap from what we just covered in the previous two sessions that being
equilibrium to Discount and equilibrium to premium obviously if you're a buyer if you want to be buying you want to be
looking at a discount Market that means trading in a lower third of the current trading range that the market has uh
presently or currently created in its most recent impulse leg or impulse price swing the cells are best taken in the
most current trading range or impulse price swing upper third portion of that range okay that's a premium Market we're
selling at a premium when the market returns back to an area of fair
value that is a fair value for the market maker to either sell or Buy in this case we're going to cover
again both Concepts in regards to equilibrium and the fair valuation for Market maker participation in in price
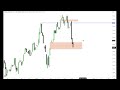
action this swing here just making this High here the market broke down and it quickly ran
away and this is what we call a liquidity void where the market makes a sudden movement lower and it's large
ranges very little Wicks very quick movement that is a void that means the price spent very little time trading at
these price levels and it was in a hurry to get down to this area here where it started trading more efficiently back
and forth from both sides of the candle and ultimately having a retracement this range in here soon as
we see pockets of price action where there's sudden movement lower just like we saw a quick sudden movement lower
here this up candle at the bottom of that that's where we start watching and measuring fair value
and the down candle here very next candle is up candle so we start looking at the range between this up candle and
this up candle between those two up candles there's what's referred to as a fair value Gap okay a fair value Gap the
reason why this is important is because there was no up candle or up movement between the break of that
low and the high of this candle here it was all just straight down movement so nothing filled in in this area once
price broke this low it left it open basically it's like a gap the same thing occurs here when this up candle is
broken here on this candle once it started breaking lower there's a gap between this candle's
low and this candle body or Wick okay so I Define it by the body I like to use those the
range in which it causes this void okay when price is below that this is going to be fair value okay the Market's going
to want to come back to that because there was very little trading in there just like we said there was a gap
because there was no movement up in this area here between this up candle's low and this up candle high this area in
price action only saw down movement didn't have any up candle movement only down movement all this
down here is down candle price action only big range so this is a liquidity void the fact that it creates it in big
ranges and speed that's what defines it now because price moves so quickly in these areas fair
value is established because there's going to be a willingness to want to see price trade back up into these levels in
here and close in all this in other words there's going to be up movement later on it won't happen immediately
always sometimes it takes a little bit of time sometimes depending upon the time frame you're looking at it may take
a great deal of time but when price starts to move High we know that we'll try to trade into
this range here and fill that in at a later time that is where market makers view
fair value now equilibrium or fair value in regards to equal distant uh range between high and low of a defined high
and low range that being if we have this low here and this High here if we Define
that with F okay we have equilibrium right here or 50% of that range from this
high this High to this low there's equilibrium okay look how the bodies of the candle stay above that but we have a
lot of work around that equilibrium price point that in that in itself is
significant because it's showing you that the market ran through a short-term high once it ran through it it came back
down right back to the middle of the range or fair value which is equilibrium at this moment price could stay in this
consolidation for a period of time of any length we don't know how long price is going to stay in a consolidation but
at equilibrium you need to refer to where the most recent price swing took place
in other words if we're at equilibrium here or at fair value thek Market can go either way at this price level the
easiest way to determine where its most probable direction is is where did Market structure break most recently did
it break a swing high or did it break a swing low most recently well there's no swing low in here of any significance
but there is a swing high up here that it broke through here so when we made this low price ran through it clearing
out these highs right on this up candle price come back down into equilibrium do we toine the range from
here to here as you're looking at Price you always want to get a feel for where you're at in regards to the most current
trading range also notice that we are in the lower portion of the range defined by this high and this low so we're in a
real low area where it would be deemed over sold so we have a range concept blending with the fact that we're moving
back in the middle of a smaller consolidated trading range with a market structure break of recent high in here
broke that high and it came back to equilibrium so the highest probability in terms of direction is going to be
going short or going long well obviously it's going to be going long but the the mechanics behind it was that the fact
that we broke this swing High we have this void in here okay we had weakness in the dollar which we're
not going to talk so much about correlation between dollar based analysis but we're only specifically
dealing with price action alone here but what led to this bullish move in the Alti dollar this week was the fact that
we moved back into a fair value or equilibrium so that way it's fair value for the market makers to build in Long
positions or build a net long book that means they're building accumulating long positions the down candle right before
this move up through a short-term high that is a bullish older block so price comes down into that hitet at the same
time it's hitting at equilibrium and it's deemed fair value it's fair value because the market traded back down into
an area where it wants to be bought again and where it should be expected to see buying pressure come in we don't
want to buy it up here because we've already broke a swing High what are we doing up there we would be we would be
buying at a premium that's not what you want to do so you're going to blend a couple things when you're looking for
high probability setups to get Fair valuation you're going to be looking at the current range from high to low in
this area right here we're in the lower end of that range so we have a lot more upside to build in a premium like we
just discussed in the previous tutorial okay Market will go to a premium okay the Market's buying at a
discount okay and it's at equilibrium it's at Fair valuation because we're in the low end of the the range from this
high to this low and we have all of this open price action right in here so the markets want to going to want to come up
there and close that in it doesn't have to come all the way back up to this candle's low which is a bearish order
block this up candle right before the down move all this is needed to give us a
directional bias we have a swing high in here where we know what's going to be resting above
that buy stops so we know that there is a strong likelihood that because we're in
the low end of the total range which is this low to this high so this is the parent price this High to this low we
created a short-term low that was higher we broke through a swing High came back down into equal distance of the high to
the low that is equilibrium we're now at Fair valuation for what for Longs the market makers can build a net long book
at this price level now if they're going to do that they're going to look for fair value above the marketplace where
they can do what sell their positions at a fair value for them up here if Traders are buying this chasing price are they
buying at a fair value no they're buying at a premium remember that we just discussed in
regards to equil uh equilibrium to premium the range from this high to this low we're above 50% level and here we're
in that upper portion of the optimal trade entry or 62 to 79% rement level I'll show you what that looks
like the low to the high 79% retracement level
70.5 62% retracement level so the market goes right up into 79% retracement so we're in premium here we're we're below
equilibrium here so we're at a discount down here relative to the range down here we're at
discount okay in terms of looking at the the low to high this is where the premiums built in if we reverse
it and look at the range in opposite terms defining it from low to high we're below the 79% retracement level so
we're really at a deep discount really really deep discount because we're below equilibrium relative to the Range High
and the low we're even below the 79% retracement level here so in terms of really being
suppressed in terms of the total range high to low we are at a deep discount in the middle of a current small little
trading range from this high to this low so we're at equal distance price price measurement of high middle
low in into total end or lower onethird of the range of the parent price swing that we see here right in here okay even
if you didn't see this high to low as the parent price swing this price swing high to low still gives you the same
context just in a SL a smaller scale so you have high to low we're in a lower 1/3
here and we're in Deep Discount here's equal distance or equilibrium we're below it so we're at discount so fair
valuation for the market makers to build a book long would be so many overlapping factors there they could be building
long positions or accumulating long positions here looking for what liquidity above the marketplace that
means where above these highs that initially it just sold off of then you have the buy stops above here
so the market runs through that takes those stops runs through this short-term High here and then what does it do goes
into consolidation now if it's a turtle soup and it wants to go lower after blowing out buy stops it should go lower
quickly it doesn't do that it's staying in a sideways consolidation in fact during this week actually gave live
sessions explaining how this Market was po pointing to higher prices it went back into consolidation which means it's
going back into what it's building equilibrium okay so equilibrium is building again in that small little
range so you define the high and the low right there and look how much price action spends around the
middle point at equilibrium price point okay so it's hanging around fair value okay one Spike move lower doesn't
see price go lower any any significance doesn't break the range and it expands to the
upside once it expands to the upside it starts filling in all of this again this is another area of fair value the
Market's fair for those long positions for the market maker that have already accumulated Longs on it's this is a good
area in this shaded area I'm going to extend this out in time over here all of this is a good place for them to
sell the Longs that they started accumulating down here look how much time they whip back and forth in that
range all these Wicks okay they're selling they're selling they're selling all the positions they accumulated here
accumulated here and down here on the initial rundown into the support once this range has closed in
the next area of of concern is above this short-term High so I have our void filled in right here
it's filled in so this is no longer of area of Interest no no more now we still look for higher prices why would we
still look for higher prices because they went long here okay so if they're going to look to sell their position
where would they look to sell their positions at discount prices or premium premium but the premium price
that speculators would trade at by buying and chasing price it's a premium to price Chasers people
that feed off the desire of being in a price move that's already been moving higher it's fair value to the market
maker to liquidate their positions at this small little pocket between this lows this up candle's low and this up
candle's high so we can now create a new specific area of fair value for the market maker to liquidate their long
positions in here right in here so drawing that out in time that's what you see here price
coming right into the bottom of that candle hits it perfectly to the PIP bodies of the candle are still deep
inside the Shaded area for fa Fair valuation what makes it fair is because they bought it at a deep discount and
they're liquidating at a premium it's fair for them to accumulate here and it's fair for them to liquidate see
market makers have to deal in terms of valuation for their Longs and their shorts and they have to do that same
valuation for their exits on both sides of the marketplace so when we see inefficiency in price like we see here
with these candles just only going down no up movement in it only going down here no up movement in it until later on
all of this area they're scaling out their positions that they accumulate down here here and
here when price moves in defined trading ranges there's going to be equilibrium equilibrium is in itself
fair value that means the market makers are holding in a consolidation when that consolidation
gives way the strongest move out of that consolidation on a long on a hard time
frame chart will give you a great deal of prognostication for directional bias so what I mean by that is if we look at
price let we take a look at it like this we can look at Price like from this high down to this
low so we have a range defin there okay the Market's in this range here consolidates it goes right back to
equilibrium hangs around equilibrium dips down below below equilibrium so even if we're monitoring this range from
this high to this low we're below the equilibrium price point so are we at a premium right here or are we at a
discount we're at a discount Traders on the retail level they're going to see this as a selling
point they're going to want to get short because they're going to see this High to this low coming up to 62% retracement
level me I said in the last two sessions is not enough this look simply looking at Fibonacci you can get tripped up in
Fibonacci if you don't understand what price is actually telling you so getting short here is not what you want to do
even though you've seen price movement going lower it's only coming down to an area of fair value for the market makers
to accumulate Longs in an area of discount so you're having an overlap of three things you're looking that total
range from this high to this low or this High to this low we're in the lower portion or onethird of of the range so
we're in high probability for a discount Market to be in in effect you're also below the equal uh price point or
equilibrium between the low to this high so it's consolidating near that but it now it went below it again so we are in
an area where the market makers can buy especially if you combine that with areas of institutional orderflow so if
you're looking to buy what would you be looking for an area to run out below the stops in other words sell stops below an
old low we don't see so much of that happening here it doesn't need to do that it's only returning down to this
down candle which is a bullish order block a down candle before the market moves higher that's where Market support
really relies um well not really resides in okay uh up candles before the market drops down that up candle is exactly
where resistance is in institutional basis so that's where selling occurs so when we see price action like this we
can Define things in terms of fair value in relationship to how the market maker is going to perceive price the way they
value price in terms of the current range that it's trading in the same way the algo uh delivers price where are we
at in proximity to the current total range we have a nice impulsive price swing high to low here we are in the
lower portion of that range here we have built-ins buy stops Above This High Above This High here above this High
here and we have value valuation Gap okay your value Gap Market's going to want to come back up there because it
spent very little time in this area it was all down movement all down movement no no buying was actually occurring in
here no buying was occurring in here it was all on the sell side one way flows so the market ran up into just to close
in where only selling took place and no real buyers so now when price comes back up
to that level and they shoot it up there like that that's going to make a run on stops above the swing high and it's
going to close in the range between this up candle and this up candle here which is a a fair value Gap so when we're
looking at Price action it's a couple things you need to keep in consideration the total range you're trading
in the equilibrium price point relative to the most recent trading range high and low and we defined several of them
here we did this High to this low with this high and this low and this high in this
low so we have multiple things lining up with the fact that for fair value sake the market is a deep discount here
and it's most likely going to trade higher and we have reference points that we can look for where the market makers
should aim but ultimately this is the fair value Gap that they wanted to get back up into and the reason why the
basis was of me calling 7665 for the week was I want to be just below where I ultimately think it's going to go and
the level at which if we look at the high uh the low comes in at 7675 and I
want to be about 10 Pips or so before the actual level I think is actually going to be hit I want to be getting out
just a little bit before that and one more instance of the things I talk about before it happens in the charts and why
those things actually materialized in price action so price returns back to fair value fair value in the perspective
of the market maker not fair value in in the scope of buying it this is at a premium okay remember that market
efficiency Paradigm I started you all with how you perceive the marketplace is not how how retail is going to see price
they're going to see this as the Market's going to probably keep going up because it's been going up well this is
an area of distribution you want to be thinking accumulation down here reaccumulation
distribution scaling out all through these areas in here because you don't know if it's only going to come up that
little bit of that that range over here in the Shaded liquidity void you don't know if it's going to fill in that and
then go lower So when you buy things down in here a deep discount you have to scale some of it out but the beginning
basis points of valuation in terms of the market makers you have to look at the total
range look at where the market has moved away from quickly and those areas of liquidity voids and liquidity uh uh
pools above old highs here and here and here there that is going to be fair value for the market maker to distribute
long positions if we were looking at a sell position or short position we would be looking for areas in which where the
market in the past has moved up a great deal with speed and we would be looking for lows where stops would be building
up below it or liquidity pools in the in the form of sell stops we would look for the lower end of
the most recent range for valuation so that way you would know by looking at things with that market efficiency
Paradigm you're not looking at things like retail you're looking at it in the scope of okay I am the bank I'm I'm
making a book here where's the most efficient price levels for me to unload my Longs or unload my short positions
we've already mentioned it so far in the teachings just for September the easiest way to understand
institutional orderflow from the beginning starting point of it all is understanding that markets move
from buy stops and sell stops and sell stops to buy stops and it moves from fair value
to Discount to Discount to premium to premium to fair value it moves back and forth between these three reference
points are we at a discount are we at a premium are we at fair value all those things combined together
they give you the clues as to what we're seeing in terms of the market Maker's uh action are they accumulating are they
manipulating are they Distributing all those factors we're going to be bringing those closely knit
ideas into a more easily understood premise when we look at Price we'll be able to see these
things unfolding in in advance and you'll be able to see what should take place and it's very encouraging to see
your study and these individual components start to flesh out and have a greater understanding about price action
so in closing fair value is not fair value in the realm of retail it's in the realm of fair value
of liquidating or accumulating from the market makers perspective fair value in discount is
fair value for buys for Market maker buying fair value in premium is fair value for Market maker selling either
establishing new shorts or exiting or scaling out long positions
discount below equilibrium in the lower ends of the range that's a discount Market that's an area at which the
market makers can buy or look to cover their short positions do not look at the marketplace
in this retail mindset that we're all trained to do we we have the same well we drink from it's the same regurgitated
stuff but it's wrong to understand how these markets are are delivered to us in in in the form of price action when this
price is delivered to us it's not random it's very specific of where it wants to go why it wants to get there that's what
that's what we're giving you in this uh mentorship it's very specific detailed perspectives that are generic they
repeat themselves over and over again and because they repeat themselves and because they're the same phenomenon that
take place almost on a daily basis there's nothing for you to fear if you mess it up and you don't get the trade
to pan out right or if you miss a move do not worry about it wait for the market to give you indications of where
Fair valuation is then you'll be able to anticipate the market Maker's next scale in or scale scale out it may be the
liquidation of a long position that's been underway that may give you uh prognostication for a future move it may
be the in the Inception of a new price leg while you're waiting for this area to be ret traded to we'll build on this
idea for now but I want you to think in terms of where we at relative to the most current range are we in the lower
end are we near the low of that current range and are we working around an equal distant equilibrium price point between
a recent high and low by defining price in current trading ranges like this you'll be able to see where the market
makers will expand the price so when there's expansion you know prior to that expansion there's been what it's
consolidation so as you study more examples of when markets are in consolidation you'll be able
to forecast The Next Movement out of the consolidation we don't break we don't play the Breakout game we anticipate the
breakout we know that the indications through price action will give us Clues as to what side of the marketplace it's
going to break out and when we get into Commodities we have actually a great advantage of that by using open interest
but for Forex you don't need it so much you can still see it in institutional orderflow so I'm going to close this
teaching here with the promise that we're going to come back at the end of this series of eight sessions um in your
notes that will accompany your uh month's summary you'll have great detail of
uh specific notes and and things that you need to be aware of as it relates to Fair valuation uh liquidity pools voids
uh liquidity gaps all those things we we'll be building more foundation on that and in month two we'll actually go
to how to define these things not just giving you one charts perspective and and and basically uh you know trying to
teach the whole thing in one one chart it can't be done so you need examples of it you need to see it uh called for in
advance like we did this week not so much why um into this great detail but I gave you the areas of which price should
reach for we talked about the area here we talked about this void here I and
obviously we don't even need to talk about the the highs because we understand that that's where the buy
stops are going to reside so think in terms of fair value for the market maker if they're going to go
higher where's a fair value for them to exit their loans okay it's fa it's a fair value for them to do so they do not
want to liquidate their loans at a discount or on retracements going lower you look for expansions on the upside
when they expand when price expands they should be reaching into an area of fair value for price to be liquidating smart
money Longs that's the only reason why markets go up that's the only reason why pric is allowed to be delivered at
higher prices because the market makers the banks have have books own own their books that are net long and it's in
their interest that Z price higher it doesn't matter how many of us buy the price is going to be set by the bank and
they're going to do things to line their own pockets and not yours so it takes a perspective shift and it gets back to
that market efficiency Paradigm I started you with in this mentorship that you have to view things from the smart
money's perspective not what retail should be doing or what retail is doing if you do that you're going to you're
going to miss the actual Clarity that comes through looking at Price action studying it through a contrarian
perspective saying okay this is what the retail Minds should be thinking now and by contrasting that with what you see in
the charts for fair value liquidity gaps liquidity voids liquidity pools all these things the Market's going to seek
that liquidity and run against the less informed crowd's opinion so with that I'm going to close and wish you good
luck and good Trading
Fair value in forex trading refers to the equilibrium price, typically the midpoint between recent highs and lows within a trading range, reflecting a balanced market. It helps traders identify where price naturally consolidates before directional moves, allowing better timing for entries and exits by understanding market efficiency and liquidity.
Market makers accumulate long positions in the discount zone (lower third of a trading range), viewing it as undervalued, and distribute or liquidate positions in the premium zone (upper third), seen as overvalued. Recognizing these zones helps traders align with institutional order flow, anticipating buying near discounts and selling near premiums for higher-probability trades.
Liquidity voids or fair value gaps occur after sharp price moves where little trading happens, leaving gaps in volume and price levels. Market makers tend to revisit these gaps to 'fill' orders and balance inventories, making these areas important support or resistance zones that traders can watch for potential price reversals or continuation setups.
Traders should look for price entering the lower third of a significant range near equilibrium, indicating potential market maker accumulation. Confirming setups involve observing price respecting liquidity pools, order blocks, and equilibrium levels before moving higher. Combining these signals helps increase trade accuracy aligned with institutional activity.
Retail traders often mistake premium prices (upper third of a range) as buying opportunities, ignoring that market makers may be distributing positions there, leading to poor entry timing and losses. Adopting the market maker perspective encourages viewing premium areas as potential sell zones, avoiding chasing momentum and reducing the risk of being trapped in reversals.
While Fibonacci retracement can highlight potential support and resistance, relying on it alone may cause false signals. Traders should interpret Fibonacci levels within the broader context of fair value zones, liquidity gaps, and market maker behavior to confirm entries and exits, enhancing precision and avoiding common pitfalls.
Traders should anticipate consolidation near equilibrium prices and plan entries in discount zones, setting targets near premium levels where liquidation often occurs. Monitoring liquidity pools and adjusting stops accordingly improves risk management. Studying institutional order flow dynamics helps traders time trades better and avoid downside traps.
Keep this summary
Save it to LunaNotes and it becomes a real note in your library — editable, searchable, and ready to turn into flashcards or a diagram. Free to start.
Save to LunaNotesOr summarise for another video.
This summary and transcript were automatically generated using AI with the Free YouTube Transcript Summary Tool by LunaNotes.
Related summaries
Understanding Fair Value Gaps in Trading: A Comprehensive Guide
This video delves into the concept of fair value gaps in trading, explaining how they represent price ranges where market liquidity is offered. It provides a detailed analysis using the Euro-Dollar daily chart to illustrate how these gaps can indicate potential trading opportunities and liquidity runs.

Mastering Equilibrium vs Premium Markets: Advanced Fibonacci Trading Strategies
This tutorial delves into the dynamics of premium markets versus equilibrium, focusing on impulse price swings and Fibonacci retracement levels. Learn how to identify optimal trade entries, manage stops, and take profits using practical examples on daily and hourly charts for consistent, professional trading outcomes.

Understanding Market Efficiency: How Smart Money Drives Price Movements
This comprehensive guide unpacks the market efficiency paradigm, revealing how a small group of smart money traders—primarily banks and institutional players—control price movements, not the large retail crowd. Learn to recognize the distinct phases of price delivery, including consolidation, expansion, reversal, and retracement, and apply this knowledge to enhance trading strategies.
Mastering Market Maker Models: Forex, Indices & Stock Trading Insights
Discover expert analysis on the dollar index, forex pairs, gold, crude oil, and major indices, emphasizing anticipation over reaction in trading. Learn practical market maker buy and sell models, smart money reversals, and actionable strategies for consistent trading success.

Understanding Liquidity in Price Action Trading for Market Efficiency
This comprehensive guide explores liquidity in trading, focusing on how buy and sell orders create high and low resistance liquidity runs. Learn to identify key price levels where liquidity clusters, understand market maker behavior, and apply these insights to optimize trading strategies with minimal resistance and higher trade probabilities.
Most viewed summaries

A Comprehensive Guide to Using Stable Diffusion Forge UI
Explore the Stable Diffusion Forge UI, customizable settings, models, and more to enhance your image generation experience.

Kolonyalismo at Imperyalismo: Ang Kasaysayan ng Pagsakop sa Pilipinas
Tuklasin ang kasaysayan ng kolonyalismo at imperyalismo sa Pilipinas sa pamamagitan ni Ferdinand Magellan.

Mastering Inpainting with Stable Diffusion: Fix Mistakes and Enhance Your Images
Learn to fix mistakes and enhance images with Stable Diffusion's inpainting features effectively.

Pamamaraan at Patakarang Kolonyal ng mga Espanyol sa Pilipinas
Tuklasin ang mga pamamaraan at patakaran ng mga Espanyol sa Pilipinas, at ang epekto nito sa mga Pilipino.

How to Install and Configure Forge: A New Stable Diffusion Web UI
Learn to install and configure the new Forge web UI for Stable Diffusion, with tips on models and settings.
Found this summary useful?
Take it with you. One click puts it in your own LunaNotes library.
Save to LunaNotes