Introduction to Trading Analytics
- Importance of a feedback loop in trading
- Continuous improvement through analysis
Data Collection Techniques
- Daily journals and trade input forms
- Seamless data collection methods
Key Metrics to Track
- Batting average: percentage of winning trades
- Average gain and loss: understanding performance
- Risk-reward ratio: assessing trade effectiveness
- Max gain and loss: identifying outliers
- Trade duration: comparing winners and losers
Visualizing Trade Data
- Creating histograms to analyze performance
- Equity curve analysis: tracking overall performance
- Identifying trends and weaknesses through visual data
Analyzing Individual Trades
- Importance of reviewing best and worst trades
- Making rule tweaks based on analysis
- Using AI for deeper insights into trading data
Conclusion
- Emphasizing the need for consistent analysis
- Encouraging traders to utilize the provided trade log template
- Reminder to join upcoming webinars for further learning
FAQs
-
What is a feedback loop in trading?
A feedback loop in trading is a process where traders continuously analyze their actions and results to improve their strategies over time. -
How can I collect data for my trades?
You can keep a daily journal, use trade input forms, or import data from your broker to track your trades effectively. -
What key metrics should I track?
Important metrics include batting average, average gain/loss, risk-reward ratio, max gain/loss, and trade duration. For a deeper understanding of how to leverage these metrics, consider exploring our summary on Mastering HR Analytics: A Comprehensive Guide to Data Science Frameworks. -
Why is visualizing trade data important?
Visualizing data helps identify trends, strengths, and weaknesses in your trading strategy, making it easier to make informed decisions. For more insights on visual data analysis, check out Developing HR Analytics Units: Essential Steps for Effective Data-Driven Decision Making. -
How often should I analyze my trades?
Beginners should analyze their trades weekly, while more experienced traders can do so monthly or quarterly. For those interested in enhancing their trading strategies, our guide on Mastering the Power of Three in Trading: A Comprehensive Guide may provide valuable insights. -
What tools can I use for trade analysis?
You can use spreadsheets, trade log templates, and even AI tools to analyze your trading data effectively. If you're interested in AI applications in trading, consider reading about Building a Stock Trading Bot with AI: My Journey and Results. -
How can I improve my trading performance?
By consistently analyzing your trades, understanding your metrics, and making necessary adjustments to your strategies. For a historical perspective on trading strategies, you might find Understanding WD Gann: Mastering Trading with Timeless Rules insightful.
It's important to have a feedback loop where you're constantly thinking about what you've done and how you could be
doing better. And the reason this is so important because if you're just taking random actions and expecting to get
improved results, you know, there's no feedback mechanism to say, "Hey, this action led to a better result and you're
just kind of floundering in the dark and unable to actually analyze your results properly because you're taking
inconsistent actions." The goal with trading is to make money over time. Our inputs, our stock selection, position
sizing, entries, exits, our full system. our outputs, our trade results, our performance. But what's very difficult
about trading is that there are a lot of external factors at play. So there's the market environment, news catalyst, you
know, tweets, Fed meetings, all these can impact whether a trade or a series of trades is successful over time. So
first, data collection. There's a few different things you can do. Could keep a daily journal/check-in where you track
your trades and and note them at the end of the day. Then on a per trade basis, you could have a sample trade input form
or you can import it from your broker. But the main thing is that you want to make it seamless, make it easy. So you
actually do this. So you have your data. Now what basically you want to organize by trade, calculate key metrics, create
visualizations, compare to historical norms, and then bas basically become a detective and draw conclusions based on
you know your data itself. Batting average, like I said, is your percent of your trades that are wins. So, if you
have 20 trades over a period and 10 are wins, you've got a 50% win rate or batting average. Uh, if you have uh 10
trades and you have three wins, you've got a 30% uh batting average. Here's the histogram performance. Basically, this
is using a sample size of over say the last month. This here on the bottom is basically the percent gain on the trade.
And then this here on the left hand side is the frequency. This is exactly kind of what you want to see for a good
system. So, this is a good example. You've got most of your losses right near the left side of zero. And then
you've got some really strong trades that are really working for you and moving the
[Music] needle. All right. Well, let's go ahead and get started everybody. So, welcome
again to another trader handbook webinar. Uh, today we're diving into the post analysis section. Uh, this is this
entire weekend is post analysis. Today is focused on trading analytics. Uh tomorrow will be focused on analyzing
individual trades. You know, assessing where you bought, where you sold, what improvements you can make and tweaks to
your rules. And you know, this this whole weekend, I think, comes together really nicely and is key to kind of
building in a feedback loop. We'll talk about that a lot quite a bit today. Um about, you know, creating a feedback
loop that allows us to improve over time. That's of course the goal. Uh we want to be improving with every market
cycle almost, you know, every month that we trade. and a feedback loop and post analysis is critical to achieving that
goal. Uh just a quick reminder here, if you haven't already, make sure to join the traders handbook list. Uh I'll be
sending out the trade analytics log that you'll see as an example later on today uh to everybody who's on the list. So if
you're not already on this, uh make sure to uh scan the QR code and join that. Uh it's pretty quick and easy and gives you
access to all all these additional bonus articles. Also, uh definitely want to emphasize to
pick up your Trader Handbook uh as soon as you can if you haven't already. Uh you know, if you want it on the release
day, you definitely want to order it quickly. Uh we've gotten so much great feedback. We've had thousands of people
uh submit their receipts and get access to bonus material. We'll be sending those out shortly. Uh but make sure you
pick it up and you can scan this QR code right here to do that. Uh here's a quick review from
Deepak Up. You probably know him uh from podcasts and presentations he's done in the past. We've also sent out and gotten
positive reviews from uh a lot of great folks. Mark Minervini, Stan Weinstein, but this is just highlighting, you know,
a good summary of, you know, the benefits of picking up the Trader Handbook. Uh he emphasizes that it draws
from the strategies and principles used by some of the world's top traders and distills complex concepts into
actionable steps that traders of all levels can understand and implement and highlights the model book chart here as
well. And this is really good to see. You know, this is our overall goal to save you time, help you along your
trading journey. And Deepo mentions here, it would have saved me a lot of time and cost mistakes if you had picked
up this book early on in his trading career. So, definitely pick this up and let us know in the chat right now if
you've already pre-ordered your copy. All right. Also, we've got a special offer. This will be the last
time that we offer this. If you pick up the Trader Handbook by the end of this weekend, you'll receive a $100 Trader
line gift card. Again, all you have to do is pre-order the book and then submit proof and you can scan here to go ahead
and do that. So, again, if you want a $100 Trailerline gift card valid towards a master class or other Trailerine um
offering, u make sure to pick up your copy here as well. I see a lot of people in the chat saying uh pre-ordered it
already, which is awesome. Uh so, great to see that. Uh for sure. All right. And it's pretty cool. It's coming out, I
think, in exactly 10 days pretty much from today. So, uh coming out very soon. Also, uh I really want to emphasize
this. This is more than just a book. What you get when you pre-order is you get an entire educational course that
includes the webinars that we're doing right now. Uh bonus articles and guides, the companion workbook, the weekly
charts model book, the base breakouts model book, the cell rules model book, the market cycles model book, an
exclusive Q&A with us, uh the trade line founders, and in addition to that, you also get bonus uh webinars right here
really focused on key setups for momentum trading. These are base breakout setups, earnings gapper setups.
who just did this one uh this past week, got great response, and next week we'll be doing the trading pullbacks webinar.
So, these are excellent, and you only get this for uh ordering and submitting proof. So, make sure to get yours in if
you haven't already. And if you've attended some of these webinars, let us know in the chat uh if you've enjoyed
them and and find a lot of value in them. Uh I know we got a lot of great feedback as we did them live. Uh, but I
think the model books and these exclusive webinars by themselves are amazing resources and you only get them
through pre-ordering uh the traders handbook. All right. And I just want to emphasize again uh the advanced pullback
strategies will be next this upcoming Wednesday. So make sure to pre-order and you'll be a eligible to join right
here. All right. And yeah, the gift card is eligible to be used on the trade lab, not DFW. Um, and the the bonuses will be
sent out through email. If you've received a confirmation, you're good to go. But if you haven't already, make
sure to submit your receipt. The link is in the description where you can submit your receipt. And Ry, maybe you could
drop that link as well uh one more time in the link uh in in the chat here. All right. Okay. So, with all that said,
let's dive right into today. So, again, welcome everybody to another Trader Handbook webinar. Today, we'll be
focusing on trading analytics and journaling trades. uh this will be a little bit of a quicker uh topic but
there's a lot to cover and like I said it's very important to build up this feedback loop in order to actually
improve as traders. Uh so this dives into chapter 10 and like I said before or I've said before all these web
webinars build on and complement key chapters within the trader handbook and this chapter 10 is kind of my personal
favorite covering post analysis how to actually calculate metrics how to actually you know analyze your results
all that. So let's go ahead and dive right in. Uh first I wanted to start with uh this quick quote here uh from
Elon Musk. It's important to have a feedback loop where you're constantly thinking about what you've done and how
you could be doing better. And the reason this is so important because if you're just taking random actions, we've
talked about building consistency in the past. If you're just taking random actions and expecting to get improved
results, um you know, there's no feedback mechanism to say, "Hey, this action led to a better result." and
you're just kind of floundering in the dark and unable to actually analyze your results properly because you're taking
inconsistent actions. So, it's so important to have this feedback loop in addition to having an established system
to start with and then you build in, you know, this level, this mechanism where you analyze the outcomes and decide if
any tweaks you made to your system actually improved the outcomes over time or you should just go back to the
drawing board and maybe try something else and we'll get into the details here um of uh this concept as well. So this
is uh you know Ryan and I are both engineering backgrounds. This is a very familiar diagram if you've taken any
engineering classes classes. Uh basically you have an input to a system. You have you know your rules or the
system itself. You have external factors disturbances that impact uh the results of the the steps taken by that system.
And then you have an output. And this loop right here is what we're really talking about today. This is the
feedback loop. And basically this is where you take the output and put it back into a process where you analyze
the outcomes based on how your system performs and then use that to tweak your system and tweak the inputs that you
make into the system. And the reason that this is so important is because if you don't have this feedback loop again
you would just have this input disturbance and output. there'd be no mechanism to actually analyze yourself,
analyze the outcomes of whatever inputs you had. And again, you just be floundering in space and unable to
really improve because you don't have that mechanism to uh analyze yourself. And I wanted to make this
slide here, you know, how do we learn and improve? Uh we make an action based on our current process and then see what
the outcome is. And then based on that outcome and our analysis of the process, we can tweak the process and make
another iteration and see if anything changed. And if the tweak improves the next outcome or outcomes, the tweak was
a positive one and that becomes the new process. If it does not, we can then try another tweak. And over time, this leads
to an improving process. Uh, you know, over the long term. Uh, but what's essential here and what I just kind of
mentioned is what's essential is the analysis of the outcome step, the feedback loop. Without it, we are lost
in terms of tweaks or our current system is working or not. And what is also crucial is we keep the inputs and
actions from the system consistent. Otherwise, changes in the outcome cannot be properly attributed to tweaks of the
system. Um, you know, we want to keep the inputs consistent because otherwise we don't know if it was external factors
that improved our results or just simply tweaks to the system. And to bring this all together because I know that's kind
of high level here. Uh, I want to give an example of uh, you know, something Ry is really good at uh, basketball um, and
and shooting a bucket, right? This is very simple. Uh, to shoot a bucket, say you're shooting a three-pointer. Uh, you
can launch the ball at a certain angle. that's an input and a certain force that's another input and based on those
two metrics and based on the the distance you are from the bucket your shot will miss or make it. So say you
you undersshoot the ball. How do you actually go ahead and prove it? Well, you want to notice by how much you are
missing the target and basically recalibrate the angle you're shooting or the force you're shooting again your
inputs and your system to shoot a little bit further and eventually make it uh into the bucket. But again, if you don't
have that feedback loop where maybe uh the there's a wall right here and you can't see the outcome, there's no way to
assess whether tweaks, shooting it harder, shooting it lower, shooting it higher are actually, you know, leading
to improved outcomes, making more buckets. So, you need to be able to analyze, you know, where the ball fell
relative to the bucket. And you know how this relates to trading is you have to be analyzing your results and assessing
whether what you're doing, your system, your process, your rules are actually helping you or hurting you uh in the
current market by analyzing your actual performance. So this just is a very simple simple system. Uh but you know
what's difficult about trading is that there's a complex system and this is where the difficulty lies
with post analysis. Obviously our goal just like to make a basket uh is to you know get get the ball in the hoop. Uh
the goal with trading is to make money over time. Our inputs, our stock selection, position sizing, entries,
exits, our full system. Our outputs are trade results, our performance. But what's very difficult about trading is
that there are a lot of external factors at play. So there's the market environment, news catalyst, you know,
tweets, uh you know, now you know Fed meetings, all these can impact whether a trade or a series of trades uh is
successful over time. So, it's not as simple as this system where, you know, the only thing that really controls it
is the force and angle of uh of your shot and then maybe there's some wind involved here. Uh maybe the type of ball
is uh the weight of the ball is is a factor. But, you know, trading is just much more complex and that's why it's
such an amazing challenge and that's why there's also just such an amazing opportunity. So the key point is that
it's very hard to directly in attribute outputs to anyone input when it comes to such a complex system. So we really have
to be very procedural about this. We have to be systematic and we have to analyze, you know, over long series of
trades to really get to the the meat of if any tweaks we did actually are improving our process. All right. So how
do we set up a trading feedback loop? Uh well, there's kind of two main aspects of it. Today's is really focused on
trade analytics. taking it from a high level perspective and then tomorrow the next webinar is focused on individual
trade reviews which is from you know a lower level uh you know individual trade level how you're you're processing
things. So first from a trade analytics level uh again you want to assess your overall performance and trends in your
equity curve. You want to do data visualizations on your trade performance. You want to identify any
system level weaknesses or improvements you can likely make. Then from an individual trade review level uh
obviously you want to analyze kind of your system execution. Did you follow your buy rule? Did you follow your sell
rule? And then identify any execution weaknesses or improvements and you know on an individual trade level see you
know could there be any tweaks I can make to my rules uh to then improve my process. Uh but you know this is much
more high level and this is a little bit lower level. Um and Ry I I recognize uh that I haven't let you talk about talked
about the importance of post analysis in general. Any thoughts on why it's so important to you know analyze your
trades analyze individual trade reviews to get that feedback loop? Yeah, in in anything you know that you do, you want
to look back and and see how what you know the the results are at the end of the day. And uh many traders, especially
the phase one and two traders that we um often talk to or uh do webinars for, they miss this most uh important part of
looking at what happened and why it happened, right? Uh so trading analytics initially especially in your first few
years uh all the way to I would say up to a decade is likely the most important thing that you will do to improve uh you
know uh improve and not make the same mistakes again and again. Uh many traders tend to do that and um I've been
through the same where I feel like something will happen at some time where I will just be a different trader when I
wake up the next day while the results for many years remained exactly the same. And what changed that was to look
at what I'm doing, why I'm placing the trades that I'm placing, why am I uh not improving and kind of seeing, you know,
periods of really good returns, but then uh giving it all back in the markets. And then the difference or where it
clicked uh was the fact that you actually go and analyze every single trade that you've
placed, why you've placed it, what was the outcome of those trades, and why that outcome could have been different
if you acted this, you know, in scenario A or B differently. So, it's all about self assessment, looking internally,
looking at your stats, looking at exactly ways to to list down, hey, I need to improve at this. I'm not good at
trading let's say in the you know the middle of the day to to get catch a trend reversal. I'm not good at trading
let's say uh when the market has news associated with it. I'm not good at trading when uh the market is simply
below the 50-day. So those observations uh will all come from the fact that you're doing you know um a deep dive
into what trades you've placed where you've placed them and especially the losing trades which will give you the
most amount of input and and then when you're you're actually you know allow you know you can curb your losses and
you're improving uh from that front then it becomes about why am I not holding the winners long enough as well. So it's
a whole journey in and of itself. But uh what's important is to look at the you know each thing that you're doing each
trade that you're placing. And that's I think something that trade you know phase one phase two traders miss and it
takes them quite you know a while to get that consistency or a phase three or
performance uh from the markets and their numbers. And and how often do you think uh especially beginner traders
should take a look at their data and keep tabs on their performance, study their equity curve? What would be a good
kind of cadence every every week, every month? What what would be kind of your your thoughts there? I think uh in the
beginning doing more is uh is much better. uh later on you could do, you know, once a quarter uh once a month uh
type of type of thing. But initially, if you're a stage one and two and you haven't figured it out, you're a boom
bust uh you know, essent basically you're you're you're having those moves to the upside and then you're giving it
all back. It's best to do that weekly. Uh if and then if you have a large down day to do it that particular day. Um
also have a list of weaknesses, right? There there are certain situations like you'll see traders say that I don't
trade bi biotech, I don't trade China stocks, I don't trade this, I oil and gas, I don't trade those are factors
where they're listing out their weaknesses, right? Some people are really good at looking at the
fundamental situation and making a a great assessment of where the market's headed and then some people are really
great great at technical assessment of the markets and and being really good at that. So finding your weaknesses uh is
really important because it allows you to eliminate situations where you're supposed to be trading and not supposed
to be trading in the markets um as well. And all that comes down to you know going through let's say you trade the
bond market for 3 months and you figure out that you know this is not for you because it's not achieving your
objective. Well that's something you just you know know in the back of your head or you write down and you say okay
I I don't like participating in this type of market. I know traders that only trade gold and they've mastered the gold
trade. That's all they do. Look at the gold charts, gold fu uh futures. They wake up, they day trade them, swing
trade them, position trade them, and that they know that market really well, how currencies influence that, how
headlines influence it, etc. Right? So, it's all about I think that that's most important. Uh a lot of a lot of us when
we begin want to do everything at once. We want, you know, when um uh, you know, companies in the retail space are doing
well along with uh Bank of America type of stocks, but then we want to be in those stocks. When uh growth is out of
favor, we want to do something else. And usually that's not the best way for you to to kind of excel and be great at
something. So, you have to pick a few spots where, you know, a few good moves that you have in the markets, a few good
moments that you feel you could trade really well. And then for us, me and Richard, it's that's growth stocks,
right? We're we're looking at high potential growth stocks that can double and triple from potential entry areas
while we keep keep our uh risk really really low. That means that we're not trading REITs. That means we're not
trading bank banking stocks for the most part. We're not tra trading utilities. So we've figured out okay these these
segments of the market fit the criteria what we're trying to achieve and these are segments that we can ignore. And
usually those you know as you gain more experience will become times where you take time off from the markets when you
know Levi jeans is going up and people think jeans are a new innovation thing. Uh whereas uh some company that comes up
in the AI space or the semispace is now innovating and doing something crazy that will you know help us from a from a
technological perspective. So those are two different ways and it you know so you got to pick those and make sure
you're clear about them and that all comes from you know analyzing your trades at the end of the day. Yeah. And
just to tell a quick story um the first time I ever did post analysis it was part of the class I did with Dr. Wish uh
when I first learned how to trade. Um, and this is very early in in 2019. And I I had done trades, you know, I had
gotten results, but you know, until until I actually looked at the data, I didn't recognize I was making the same
mistake over and over again and looking actually at the charts. And the mistake I was making is I was entering probably
two three days um late in the right stocks. So the right stocks that went up and went up 20 30 40% whatever in the
strong uptrend I was entering the right stocks but at the wrong time and until I recognized that I was buying you know
after it was already short-term extended and getting shaken out on a natural pullback maybe to the to the moving
average uh you know I I would just get shaken out of those stocks. Uh and so what I changed after that realization is
buying a lot closer to the 21 EMA, the contraction, the actual kind of start of the breakout move, the momentum,
momentum burst, people people call it, uh Praep Bond. Um but if I hadn't actually looked at my performance and
done the dirty work and actually went through different trades, I would have made the relation. There'd be no way for
me to recognize just by, you know, some magic perception that I was entering late all the time. I was just frustrated
because I was getting shaken out and then the stocks would go out without me. So, if there's a similar frustration
that you're hap that you're that you're experiencing, oh, I get shaken out all the time. Oh, my cell rule gets me out
and then the stock doubles from there. Actually go ahead and plot it on the chart and look at the data in your
spreadsheet and see what you need to change. Um, you know, a later change that post analysis helped me with is I
recognized I was in the right stocks and they were making strong moves with with with me, but you know, I wasn't getting
enough size in them for actually them to make an impact. Because in order to actually improve your equity curve, you
know, there's both the weight of your position size and then there's the performance of the stock. And if the
performance of your stock is great, but your weight is only 8% 10%. You're not going to get that performance, that nice
move that actually, you know, helps you out and and boosts your equity curve. So that's an improvement I had to make
where I boosted my weight, my position sizing, and that helped me during the stronger periods. So there are just a
few examples about how post analysis can help you. You know, there's stories of many market wizards where they were
frustrated maybe early on in their trading careers. They weren't having the success uh they wanted uh they blew up
accounts and then what did they do? They went back and analyzed every single trade they made over a year, two years
and identified their weaknesses and created rules and steps to improve on those weaknesses. and that's what turned
around their performance. So, this is really critical, guys. Uh, you know, this might be tedious or or whatever.
Uh, but, you know, it's really what's going to be the biggest lever to moving you from stage two to stage three is
recognizing the weaknesses you're making, especially regarding risk management or profit, you know, profit
taking rules and actually working to fix them. All right, so here's the actual agenda for today a little bit. We
already talked about the importance of having a post analysis feedback loop, but we're going to talk about some
different key metrics to track, how to actually collect data. You know, I think a lot of people just say, you know,
track your trades, but what does that actually mean and and how do we make it seamless so it actually gets done,
right? Uh then we'll talk a little bit about a trade log. We'll be sending you guys a bonus template uh later today,
the same one, you know, I'll be showing later on. We'll talk a little bit about equity curve analysis, performance
distribution visuals, and some other visuals you can make on your data. And then some few ideas of again you know
how do you identify the weaknesses by doing different studies on your data and seeing if tweaks you make uh to your
actual trades would have actually helped you. So this is the general agenda for today. All right. So first data
collection. Um you know there's a few different things you can do. Uh you could keep a daily journal/checkin where
you track your trades and and note them at the end of the day. Uh then on a per trade basis you could have a sample
trade input form. And we're going to show an exact example of this later on. Or you can import it from your broker. I
know there's software out there. You know, we'll be creating something with DFW. Maybe by the time you guys are
watching the this recording, we'll have that journal up and running. Uh but the main thing is that you want to make it
seamless, make it easy. So you actually do this, right? We don't want to say we're going to do this extensive post
analysis and do it once and never do it again because consistent um tweaks your process is better than trying to do
everything all at once and and just getting overwhelmed and and never looking at it again. You don't want to
hate the data collection process. You want to make it as easy as possible. All right, so this is a quick
example of a trade input form that you could make after every single trade. So, let me go ahead and zoom in here and
we'll go through the sections. And this QR code, by the way, uh you can scan that and it will actually uh show you
this right here. And then you could copy it very uh simply in Google Forms. This is actually how I created
this. And what's great about Google Forms is that you can actually log the data in a Google Sheets for you. So, it
actually kind of does a lot of that data collection and preparation process for you. But basically, you'd have a few
questions that you'd want to answer with any trade that you create. Uh you know, what was the stock symbol? What was the
setup you used? Base breakout, gapper, pullback. that might be something to track. You could also have an entry
tactic uh drop-down list here where you'd select one of those. Um then you'd want to of course put in your average
cost, the number of shares, your initial stop-loss level, and I think I added this one just because it might be really
interesting to look uh back at how this impacts the actual performance of the trade. You know, how confident do you
feel about this trade just from 1 to 10? And you know this would be some cool data to collect over time and say you
know over the course of 3 months you know uh trades where I had an eight or higher I made you know 12% on average
while trades uh five or below I only made you know 3% or actually lost money. This would be cool data to collect. So
again just with this trade input form you want to make this quick and easy. Uh you want to have it you know be able to
fill it out in under 3 minutes. Um but you want to in you know collect all the data that would be helpful for you going
back and actually tracking your trade. Then here just any additional notes about the trade maybe some thoughts
about the setup anything you want to remind yourself of when you go back and actually analyze this trade on an
individual basis. Uh so again this is a Google form uh and you can set this up really easily. These are all just kind
of long answer uh paragraph inputs. This is a drop-down uh input and you can actually scan this and you'll get and
let me zoom out here. Uh you can get um you can actually see this and for you and uh create your own Google form that
matches this. So this is a trade info form. Again this would be one way to collect your
data. Then another way would be to do more of a daily level a daily journal. Uh this is the one that I use uh and I I
track my my stuff using this. Uh basically I have a quick thing. How do I feel like I traded today? Uh based on
the execution, based on how I acted. It's not always about whether I performed well in that day or didn't
perform well. It's about how well I executed that day. Uh then new trades today and observations, existing
positions and daily observations, some quick notes here. Uh thoughts on the market, key themes that are standing
out. Uh bonus notes. So again, um this is kind of what I do on a daily basis. Ry might do something different and he
might organize a little bit different. Maybe use notion or something like that. Basically, you want to just create a
workflow that works for you. And this is one suggestion using Google Forms because I like it because it tracks
everything in a Google Sheets right there for you and makes things really easily to collect that data. And again,
you can scan this QR code and see this right there for you. Um, and you'll be able to you replicate that in Google
Forms pretty easy. All right. So, you have your data. Now what basically you want to organize by trade,
calculate key metrics, create visualizations, compare to historical norms and then bas basically become a
detective and draw conclusions uh based on you know your data itself. And you know once you have that data again
collected through your trade input form or you know some other method however you're tracking your data you basically
want to go ahead and analyze and calculate a lot of stuff we're talking about. So here are some key metrics to
track. Uh basically you've got your batting average, your win rate, what percentage of your your trades are
actually winners. You've got your average gain, average loss, your riskreward ratio, your max gain, max
loss. This can be helpful to identify the outliers and then also your trade duration. Are you holding your winners
longer than your losers? And then you want to also analyze from a high level your equity curve. And Ry definitely
want to hear your thoughts on that um about uh recommendations. Uh but we'll get into that in just a
minute. All right. So batting average. Batting average, like I said, is your percent of your trades that are wins.
So, if you have 20 trades over a period and 10 are wins, you've got a 50% uh 50% uh win rate or batting average. Uh if
you have uh 10 trades and you have three wins, you've got a 30% uh batting average. And definitely something that's
key is that many great traders have around 40% win rate um or even less. And the difference between, you know, how
can you have a tremendous tremendous results and be a market wizard with a 40% batting average being wrong six out
of 10 times? Basically, they're taking advantage of the asymmetric aspect of the market and letting their winners,
you know, really make strong gains for them and capping the losers so tight. So, yes, they might have a lot of
losers, but all those losers are minus3, -4, -5% while their winners are plus 10, + 15, plus 20. And then there's outliers
that are even, you know, a whole lot more than that. So, one winner can can basically pay for many, many losers. So,
again, it's not about being right, it's about being profitable and, you know, using that asymmetricness of the market
of, you know, using stop losses to cap your cap your losses uh to to really, you know, put that in your favor. And,
you know, uh it's not about the batting average. I think I think this is a common misconception especially with
newer traders that you have to have a 80 90% batting average to have success in the market. Definitely not true
especially for our style. You know a lot of people here today are trend followers and trend followers by nature are going
to have much bigger winners than their losers. But you know as trades are getting going and they're trying to
enter a trade and enter a trend you know there might be a lot of head fakes that could stop us out early on. But over
time if we catch you know the right trends that's going to pay for everything. Um, and what's also cool
about the batting average is it can be a good gauge for market health. So, say you have a normal uh batting average of
about 40 45%. You know, that's that's pretty good. But then there's a period where
it's 60 65% uh where it's a new uptrend and everything's working. That gives you additional confirmation that, you know,
it's a good market and you should be taking advantage of it as as as you can. But if you know you're just getting
stopped out left and right and your batting average dips to you know 35% even 30%. That's again a sign that you
know take a step back um you know maybe it's a very choppy en environment things aren't following through and you want to
be trading less. You want to be trading you know more defensively moving up stops more aggressively. So the batting
average can be a great gauge for um you know what the what the market health is as well. Uh Ryan, anything you want to
add on the batting batting average and and how you kind of use it um you know uh to assess your your trading? Yeah, I
think um you know one of the things that I I look at is just the last x amount of trades and how well those are working
and how well you know I'm gauging the market condition. I think the overall batting average is pretty much for the
you know most part on the lower end uh because of swing trading. It won't be, you know, 70 80%. That's crazy. It will
be 30 40% range. Uh because you're, you know, you're testing the market, you're uh seeing if you're getting positive
feedback on on your existing trades, etc. Uh for me, what's most important is the last 10, the last 15. Am I actually
in line with the current market action? am I on a losing streak of you know 5 6 7 8 9 10 trades in a row and I'm not
able to gauge the market condition well and then you adjust your position size etc according um to how you're you know
performing. Uh so for me it's you know overall I think what you said the number is going to be on the lower end. People
aim for you know um they really want strategies with 80% win rate 90% win rate. This has worked historically so it
has to work in the future. uh etc. But uh the reality of it is it's in the 30 40% range and what's most important is
how you're gauging the market now, not you know uh 50 trades ago if you were everything was aligning with your system
etc. So yep and I see a good thought by Lisa earlier when it comes to collecting your data. Um she mentioned that it
might be helpful to to include you know the time that you place the trade. You know was it at 9:35? Was it at 10:30?
Was it the end of the day? that can be very helpful as well uh in order to go back and see you know am I more
effective trading early in the session like I know Ry and and myself we like to trade early or do I actually have better
success if I wait you know uh until the end of the day to place trades so that's another good really good suggestion Lisa
and it's a good point that you know whatever you find helpful add to this form and then you can go back and study
it but uh again you don't want to make this too laborous because otherwise you're not going to do it but you do
want to collect some good data uh as Well, all right. I saw a question, you know, why why did we start with batting
average? Because even though it's not the most important key metric, because we're going to be covering all of these
and it's a it's an important metric to track even though the average gain to loss ratio is maybe more important, but
we're covering that second. So, we're just covering all of these. There's no real reason why batting average is
first. It's just probably the most common, so we wanted to address it right away. All right. So, average gain,
average loss. Um, and I think this is really important and I think something different that most people don't think
about. Um, I think you should track this both in dollars, percentage, and equity contribution. And I'll break down what
what each of those mean. You know, if you've got a trade and you have 100 shares, uh, and you know, you make
profits, which is great, and you make a $500 profit, that would be, you know, your your gain in dollars. U, but that
that that gain in percentage on that position might be only 3% or 4%. And then if that position size is really
low, your equity contribution might only be, you know, adding to your actual portfolio 02% if you've got, you know,
uh, a really a big portfolio. So the reason why you should track this metric in all these three different variants is
because, like I said before, uh, a big mistake I noticed early on is that I would have nice winners, but I was
trying to diversify too much and keep my position size too small. and the actual equity contribution of those winners
didn't really move the needle on my account even though they they were working well. So, uh basically by by um
by analyzing and calculating the equity contribution, the average gain equity contribution, you're kind of normalizing
everything based on position size and actually seeing what moves the needle. uh because a smaller a smaller position
in a HIMS or a TEM that goes up 50% for you um might have equal uh equity contribution to a slower mover a Netflix
um that that only goes up 10% but you you're willing to put 30% of your account in that because it's more of a
liquid leader. So I think um what my main point here is that it might skew your perception of your your trading if
you only calculate based on percentage or or in dollars. So, I think you should do all three of these to gain that
different point of view for all of those. Um, and Ry, do you want to explain that, too? Because I'm I'm not
quite sure if I'm getting across exactly what I'm saying. Uh, but yeah, maybe from your perspective, you can you can
explain that as well. So, it so if you want the the way I I do it is more percentages um because of the
just the fact that they're just easier. Um, I know folks tend to gravitate towards dollar-based like goals. Hey,
I'm making $500 a trade or I'm making X amount a trade. Um, I think that type of thinking for me at least didn't scale uh
really well because the bigger the amount gets um the the more you're kind of pressured, right? because you know
that your if your average loss is let's say um $11,000 it it it just doesn't grow in my
mind it didn't work for me so I kept it you know from a small account to a big account to managing money all of that I
focus on percentages a lot more because it was just you know easy uh 3 to 4% four to 5% etc so like uh and then it
gives you a ratio as well like if my average gain to my average loss cost ratio is always above let's say 1.2 2
1.3 I'm in a good space basically I'm doing something right and over a series of trades I will you know come out on
top right so it gives you that confidence when you do it uh from a percentage um in terms of um the equity
contribution uh formula percent gain gain multiply by position size um I me personally I I tend to keep it a lot
simpler uh than that I just have you know if I know my average gain over the last uh 15 trades is 8% and my average
loss is 2%. Time to press, you know, time to really go, time to really put on position size, you know, a really high
position size cuz something's working in the markets. My average gain to my average uh loss ratio is 4:1, right? Uh
when that skews back from like 4:1 to a one where okay, I placed a trade 3% loss, I placed a winner, 3%. Now I'm in
a 1:1 ratio. If I'm in that, that means the market's ether either, you know, my system and how I'm approaching the
markets that's level and it's choppy. So, I'm I don't have a real edge over X amount of trades again, right? So, that
that's how my thought process goes. I keep things very I guess as a swing trader, you're looking at daily charts
in a few months. From a analytic perspective, the the immediate, you know, monthly analysis and the quarterly
analysis are always based on last 20 trades, last 50 trades max, right? Because I want to stay in the moment in
the market ex um but that quarterly yearly analysis, that's where you can get into, you know, what's my bigger am
I is my whole system working right from a bigger 30,000 ft perspective. Is my system, you know, uh, performing the the
way I want it to? Why why do my losses get increased when the market cycle is about to end? How can I tweak my market
cycle system? Then you get into that true feedback, right? Which component of my entry tactic needs to be a little bit
better? Was I a little bit, you know, was I consistently late to trades on the charts? Where can I improve my entry
tactics to make sure my entry instead of, you know, $50 is around 48.50? Am I I'm a little bit early? Can I do that
consistently? So that's where the you know the math comes in on a bigger quarterly, semianual, and annual
analysis that you could do on your trades. So uh I hope that was helpful because that's that's how I kind of look
at it. So yeah, I think it's great. And just just quickly to calculate your average gain, average loss, you
basically want to sum up all your gains over a certain period. Maybe it's over a month sample size. and then sum all
those up and then divide by the number of winners. And very similarly for the losers, sum up all the the the losses
and then divide by your losers. And I'll also show how to do that. Um I'll give you a quick preview. So riskreward, this
is the next metric that we're going to talk about today. Uh basically, you know, once you've got your average gain
and average loss, divide the average gain by the average loss. And this gives you a sense of, you know, how much
you're gaining per your average loss. So ideally for swing traders probably two to one or a little bit more than two to
one is ideal. For position traders you want to be want to be bigger than that because you're going to have a lower
batting average and you want your winners to really pay for those losers. So swing traders two 2.5 to one you know
that's kind of what you're shooting for. Uh position traders a lot bigger than that. And this is really critical for a
longerterm compounding uh and also building in failure because it makes sure that you know losers can be paid
for by your winners. And you just kind of want to find the ratio that fits your style and and do the math and see, you
know, am I on the right track. Uh, and that's kind of the goal of riskreward ratio. So again, to calculate this, uh,
divide your average gain, uh, by your average loss. I'm curious to know if if if you guys have, you know, your
numbers, if you want to put them in the chat, it would be nice to see what people are at, you know, over the last 5
10 trades or even, you know, as a system. Um, and if you don't know these numbers, today's the day to kind of go
in and calculate it because you're you're trading based on unknowns or you don't really know what your outcomes and
results are, right? So, uh, if you know them, definitely place them in the chat. If you don't, it's a takeaway for you to
know exactly, you know, at the very least over the last 5 10 trades to know this. So, yep. Perfect. And then max
gain max max loss. Uh whenever you're analyzing a system uh putting on my engineering hat again, it's really
important to uh look at the outliers because that gives you a big sense of what's actually going on and and
probably areas that you can either improve a system or critical things that you need to fix otherwise uh something
bad's going to happen. So uh you know when it comes to trading it shows your upside potential and risk exposure and
analyzing the outliers can really identify you know the key things you need to change to improve your process.
So think about what went really right for uh you know a great trade that you had. Uh and then also if you've got a
loss maybe your average loss is about 3 4% and you have a loss that was minus 12% and it wasn't based on you know uh
you know external factors or or things you can't control. you really have to make sure you fix whatever, you know,
caused that loss. Uh so again, this is where you'll make the most breakthroughs, especially on the loss
side. If you improve your backside and and improve, you know, your risk management, it's going to be it's going
to really have a dramatic impact on your results. Ry, did you have something to add? Yeah, in terms of max loss that
there's another thing, you know, if if you have a max loss rule, uh and then uh when you're doing, you know, uh post
analysis and and you're not following that, that that's another tell, right? that hey I set a 7% I set you know
mathematically we spoke about in our earlier webinars that 7%'s where it kind of starts going really downhill for you
uh past that and you're climbing uphill. So uh if you had that and then you stopped following it and you place a
trade and then market went into correction you turned into this and that um that's also again that's the feedback
loop that you're not trusting the system that you put forth and you don't really trust the methods that you're following
and that in and of itself is you know um what causes many swing traders to not really make it to that phase three and
four. So, if you know, if you're learning a system, you're learning Oliver's system, Sen's uh system, um
you're you're looking at the trade lab and how Richard's doing things, etc., and you'll see that all of them have
that maxed loss rule or have this type of, you know, something that curbs their losses. Every single trader does that.
Every single good trader does that. And I think it's it's really really really important because I see many people, you
know, uh they go into a trade, my risk is 3% and then a month later they're down 30% and they're still holding the
same thing because they still believe in the company all of a sudden. So a technical setup that turns into a
investment is how you know is is not aligning with your goal. So uh making sure you know these are when you do just
analytics of max gain and max loss. It's also a check on are you actually you know uh committing to the rules that you
set in your system and are you checking off do you are you trusting the process of it as well and many tra traders lack
this this part of it where they don't they have this rule they have that rule but when it comes to implementation they
turn into investors right so if you're a swing trader position trader stick to it and and this feedback loop will also you
know be something that keeps you in check again and again. So again, phase one, two, do it often. Phase three,
four, uh, consistency, and um, uh, performance phase, you do it less because you have the numbers in the back
of your head um, at the same time. Yep. Excellent. Um, also I I think this is an important metric to track, you know,
duration metrics. So, uh, for your gainers, how how long are you holding them? For your losers, how long are you
holding them? Um, ideally winners are much longer than losers for both swing trading, swing trading and position
trading. I think, um, you know, I like when my losers, you know, stop me out the next day or even that first day and
then I'm out of the trade and can move that capital somewhere else. Uh, but, you know, typically, you know, my losers
are about two two days or three days on average and then my winners can be much more than that uh more more in the 10 10
plus range. Um, so this is really important to track and it gets you in the right mindset of a trend follower.
Are you letting your winners work for you? And then are you cutting your losers as soon as they you know show you
your your show you you know quick losses. Um then after you've collected your data and we'll show you uh the
actual trade log in just a minute. After you collected the data I think it's really helpful to do some different data
visualizations. This first one is something I really want to talk about and I think probably is new to a lot of
folks. Then there's different, you know, graphs and and charts you can make. Equity per trade, uh, you know, per
stock, u, percent gain per stock to try to identify those those, uh, outliers, performance versus setup. If you keep
track of what setup you use for a trade, you could actually track, you know, your performance versus that setup and and
see which setup is more effective and then lean more into those if if those are working. Uh, performance versus
entry tactic very similarly. And again, you can kind of ver get very creative at this and create different visuals that
help you and help you, you know, identify your strengths and your weaknesses. Uh here's the histogram
performance. So this is really important, guys. So uh pay attention here. Basically, this is using a sample
size of over say the last month. Um this here on the bottom is basically the percent gain on the trade. So you have
and then this here on uh the left hand side is the frequency. So we've got two trades of over 25%. uh we've got two
trades of about 10% 11% and you know so and so on. So you've got a few really strong outliers over here and then you
have your stop-loss hits over here where uh from 0 to -4% is the bulk of your losses um where you've got eight losses
that are down between -3.75 and - 2.5% and then you have a few that get a little bit past you know your your
standard stop loss and hit a little bit deeper. Uh so this is exactly kind of what you want to see for a good system.
So this is a good example. You've got most most of your losses right near uh the left side of zero. And then you've
got some really strong trades that are really working for you and moving the needle. Uh but there's still some area
improvement. You can see this outlier uh trade example here minus 10%. That's getting a little bit too far in terms of
your stop loss. So you definitely would want to go ahead and investigate this trade and say, "Hey, you know what
happened here? did I not follow my rule? Uh what what rule could I implement to prevent that? Um so this is a really
cool visual that allows you to identify, you know, all your outcomes and visualize it and see are you, you know,
are you building a successful trend following system? If you are, all your losses are going to be pretty close to
right near 0 to minus 4%. And then you're going to have some nice gainers that act well. And Ry, anything you want
to add on this graph that that might be helpful for for folks? No, it's just uh it's it's a good visual way of looking
at, you know, your winners and losers. If the left side is quite big um and you have towers on the left side and you
don't on the right, um that doesn't necessarily in this graphic mean it's a bad thing. It could mean that you know
you have the the your your winners are covering many of your losers uh in a big way. So in this case, Richard has the
you know 10% gain 11.25% 25% he has a 17% 20 21 23 and 25 I think exercising and doing the math of it uh just you
know coming up with hypothetical scenarios of the math you know and and saying if I have 10 3% losers in a row
and and then I have one you know 25% gain where does my math stand in terms of you know if I started at equilibrium
let's say at $20,000 or or $50,000, where is the where do I stand?
That type of, you know, doing that manual calculation just once will allow you to take losses a lot
a lot more frequently and you won't hesitate to take them because you know that your systems kind of searching for
a big winner uh in the markets. And when you catch that the the times where you no matter what you do, uh what system
you have, what type of market it is, and nothing's working, it will keep you motivated because you know the math
behind your trading. And once you know the math and you've done it manually and that's where for me it really really uh
clicked and helped me out a lot and uh is when you know your math you know you know the numbers of it. Um it gives you
a lot of confidence when you you know you take a loss and you're okay with it. You don't kind of hesitate. You don't uh
second guessess yourself. You don't you know that you know you've calculated your numbers and you know that once you
have that let's say a 25% gain or uh like a hood moving 52% in uh 14 15 sessions all the the the ones you know
the smaller losses that were less than 5%. Those are covered. and now you're really, you know, going for it. Uh, and
it I guess the the gist of what I'm trying to say is it keeps you motivated when you're on a losing streak. And
that's really really important um to to have in trading to to not be demotivated or get down um especially when when you
no matter what you do uh things keep you know not going your way. Yeah. Excellent. And uh I really want to so so
first I want to ask in the chat you know do you guys understand what this histogram shows and the value of it
because I want to make sure I think this is the number one visual that you should make on your data if you haven't
already. Uh so I want to see if there's any questions here be before we move on. Uh but this is really easy to make. I'll
actually go ahead and uh show it here in in uh let's see here. Let's stop here and
share screen. And there we go. So, this is the trade log template that we'll be sending out to you guys. These are, you
know, 10 sample trades here. Uh you've got buy date, entry tactic, buy notes, setup, cost basis. uh in blue is the the
numbers that you would have to enter yourself and then everything else is kind of calculated for you. It
calculates the R multiple equity percent change the percent change the dollar gain as well your portfolio value after
that trade and the the visuals over here would be on the second tab where this is portfolio uh versus trade number and
then this is the histogram right here. Uh so let me see if there's any questions uh so far. Okay, clear.
Awesome. Um, and then these would be the raw metrics. And I'll I'll go more in detail after we're finished the slides
with this uh trade log. We've also built in here a little bit of cost basis calculator because I know people have a
lot of questions, you know, how do you calculate your cost basis? If you have multiple buys, uh you can basically use
this quick cost basis calculator uh to do that as well. So, this is what we'll be sending to you guys in just a minute.
And it includes the histogram. So, if you change these trades to actually your own trades, it will calculate that for
you. Uh so let me go ahead and share the slides again. Perfect. All
right. So this is the next uh nice visual that could be helpful in addition to just seeing your equity curve over
time. It might also be helpful to do equity curve versus the trade and see which ones really led to really
significant moves higher in your equity curve and analyze, you know, was that a gapper setup when I normally mostly
trade um, you know, breakouts? If so, maybe I'll I'll I'll look to master that setup a little bit more. So, this can be
helpful visual as well. Um, and then this is kind of a something I'm just starting to do and this is something
we'll build into the um the deep view journal feature is analyzing your data with um you know with AI and seeing you
know what what observations does AI make based on your data. Uh this is something I fed it that same spreadsheet. It came
up with uh different uh advice here. Let me actually zoom in. So this is a very simple prompt. I
bas basically asked analyze this trade log and come up with key takeaways and suggestions. You could have follow-up
things. You can actually have it make visuals for you, make a histogram based on this data. And here's some
observations. You know, risk management is solid. Most losses are capped under 93% showing good discipline. Um, average
days are 11 for winners 11 days, average for losers, three days. You know, a lot of the setups I put in there were bases
and trading bases most trades, but the gapper trades had the best outcomes. So, that was the observation it made that
said, hey, maybe lean more into the gapper trades. uh entry tactics mo most over here. Um and you know this might be
need refinement. You know a lot of these entries didn't work out or were stopped out. So this can be really helpful to
get a second look at your trade and kind of have a you know trading coach that that's built in for you and you can ask
it follow-up questions and just basically talk to your data. So I definitely recommend trying this out.
you know, upload um once you've entered in your trades into that trade log. Basically, go ahead and upload it to
chatbt um and ask it questions about, you know, what improvements could you make? Uh what are your most effective
entry tactics, setups? Um you know, what are what are key things that you you think I should work on? Um talk to
chatbt and I think it'll come up with some really good uh you know, feedback there for
you. Okay, so let's go keep going here. Uh then equity curve analysis. Ry, you want to take this away and kind of talk
about the importance of this and how you do it? Yeah. So, the the I would say this is the most uh important
um visualization of your results uh in the markets. It's the source of truth. Uh it cannot, you know, lie or be
deceiving or uh there's no way you cannot not understand uh what you're seeing when you pull up your equity
curve. So, uh the first thing that you want to look at when you're when you're analyzing what's happening is periods in
the market when uh things are working for you. What's kind of how does that equity curve look? And then periods in
the market when you're seeing pullback, how steep is the, you know, your equity curve pulling back? Um as well, as long
as you have, you know, do that type of analysis. The second thing you want to make sure that you're you're looking at
uh on your equity curve is a higher low, right? You want to, you know, from one market cycle in that market cycle
webinar when we said, hey, the market cycle turns one, we want to position early in a market trend and we want to
get our, you know, positions on so that when that breath picks up and the initial floor of the market rises rises,
our equity curves see significant progress to the upside. And that's, you know, when you're when you're going to
the up uh when you see that spike, the equity curve spike, that puts you in the driver's seat. If you're not seeing that
initially and early in each market cycle that turns from a down cycle to an upcycle, that's something to work on.
That's something, you know, early positioning and the way you you you look at your system. That portion of it, I
feel, is really key because then traders fall behind. And once they fall behind, they start blaming the markets. they
blame their system. They blame everything else but themselves uh because they don't have a proper, you
know, market cycle system. The second thing on your equity curve is when you're off, you know, 5% off of highs,
10% off of highs, you have to lower down. It serves as a mechanism and and a feedback for you to take in that the
position sizes that you're now putting on should be way lower than when you were seeing, you know, an uptrend where
one position works and you finance the other one in terms of progressive exposure. If you're doing that or uh
when you're 5% off your highs, something has happened that's not the same anymore, right? So, if you still want to
be placing bets in the markets, placing trades in the markets, your position size has to reflect the progress that
you're making on your equity curve. So that what happens when you do that is that phase one and that phase two equity
curve diagrams that we presented in the early webinars for uh the boom bus trader um you are you learn to curb your
losses by lowering your position size and then eventually when you do that again and again you will then learn that
there are times in the market that you don't or should not be trading as well. So, um, all of these things when you
look at, you know, the source of truth for your trading, uh, is your equity curve, is it going up? Is it going down?
Is it going sideways? Is it 5% off its highs, 10% off of its highs? It gives you a lot of information as to what
which components of your system are supposed to kick in your position sizing system, where you lower it or make it
higher, etc. Uh, as well. So at the end of the day, you have to take a look at this. It's there's no other metric, no
math. There's no confusion when you're looking at your equity curve as to what's happening and what your inputs
and how they equate to your outputs as well. So um that's definitely, you know, if if you guys don't look at your equity
curves and you're being told that, you know, it's not a good way, etc., I would strongly disagree with that. It for me
turned things around uh quite a bit because I'm looking at the reality of my trading rather than thinking that things
are going to turn around without me looking at my own results or my own outputs uh from from the inputs that I
make which is the number of trades in the market. Yeah. Excellent. So especially if you're stage two a boom
and buster it's really critical especially early uptrend guarantee that higher low. Uh I I think really think
about that and it's a great way to to approach it. Um, perfect. Let's keep moving here. Uh, so this will be the
focus more of next week, but I did want to mention it in in this week as well, uh, for those who don't attend the next
one. So basically, you know, after you've looked at your math and filled out your trade log and done your
calculation, your batting average, all that, uh, you want to select, you know, your your best and worst trades over the
period and, you know, dive deeper into the charts and actually annotate your entries, your exits, your reasoning
behind different things you do because, like I said, this is what really turned things around for me when I I noticed I
was buying late when it was already a little bit extended. Um, you want to spot, you know, repeatable strengths and
weaknesses and, you know, be able to make rule tweaks based on this. And we're going to dive deep into this next
next, uh, you know, tomorrow in the next webinar, um, and show examples of, you know, how to analyze yourself um, how to
think based on your execution versus the outcome, all that. So, this will be the focus of the next webinar. But again,
um, picking out your, you know, to start with two best and two worst trades. Um, and that's really easy to find if you if
you track your data and analyze those in depth. Again, you know, the Pareto principle, you know, analyzing just that
select few will will help you really understand where you're going where right, where you're going wrong. And
then if you have more time and are willing, you can do, you know, your five best or your your five worst. And
probably focusing on your losing trades is probably even the the most important thing. Uh, because capping your downside
really can can really improve your your performance. So this will be the focus of tomorrow but just want to mention
here today you know a and then after you've collected all your data have a spreadsheet um it's what can be awesome
is you can do studies on your own data your own entries your own actions and this is way better almost than doing a
general study because it's very applicable to you how you act in the moment it's based on your real trading.
Uh so what you could do is test sell rules. You know based on your actual entries, how would your trade
performance have performed if instead of you use your your existing trade rules, you you know left all of it on until it
breaks below the 21 EMA for two closes. That's something you can test using your actual entry points. Uh testing
stop-loss rules. You know, you might this might go a little need a little bit of um of of uh of heavy lifting because
you have to see if you are stopped out or not based on the charts. But, you know, testing if you move your stop loss
to the low of the day instead of the 10 EMA or whatever whatever your rule is, that can be a way to analyze, you know,
if you're setting your stop the right way for the entries you like to take take. Uh, then testing entry tactics,
setup effectiveness. Again, sorting and calculating your statistics based on a particular setup or entry tactic can
really help you identify, you know, okay, oops, reversals are my most powerful entry tactic. I'm going to only
focus on those from now on and and really specialize in that in this type of environment or you know I'm noticing
gappers are my best type of type of setup. I'm going to focus on those. So these are all things you can do that can
be really helpful and help you you know jump to that next level stage three stage four but it's only possible if you
collect your data in a spreadsheet keeps thing or organized and keep things up to date. So, uh I think this can be really
powerful and again you can uh leverage AI to to help you with this. Uh but you know uh you can only do this if you have
the data is one of the key points I want to make. Um and then this is a a good you know warning uh with regards to
doing studies. You definitely don't want to make sure you're overfitting. You know market environment will have an
impact uh based on which rules work best. So, like I said, if you're studying sale rules, if you study it in
a trending market where of course if you held a stock longer than you did, it would have really uh increased
performance. You want to make sure you're you're keeping that in mind as you're doing these studies and thinking
about, you know, is this cell rule actually better that I'm testing or did it just work in this month of this
really strong year? So make sure you think about that as you're creating uh any tweaks that you do. Uh so you're not
overfitting to a certain market environment. Um so basically test tweaks but identify changes that will help
overall you know over the long term over years not just based on one one period. Uh so this is really important. All
right. Um so that's pretty much it for uh the slides. I want to jump into uh the the spreadsheet again and bring that
up. So let me know let me know when you guys can see that right? Uh you can see this
right? Yeah. Cool. So this is the trade log that we'll be sending to you guys. These are basically example trades that
you make about 20 over the past you know uh you know month or so uh since the the market kind of turned around. Uh we've
got you know key trades here. Palunteer crowd uh some stop stop losses crowd strikes. These are pretty pretty
realistic. You know some of these are trades that I took um and got stopped out on. Uh so you know about uh I think
70% of these trades actually are losers. Uh but you've got some really good trades in here of CRWV, HIMS, Tesla, um
you know, Palunteer names that we've been focusing on. So this pretty realistic. Um but you know, you kind of
want to go in and instead of these dummy trades, enter your own information. So what stock, you know, was it? You'd
enter the symbol here. Your buy date, you'd enter that. The entry tactic, you could kind of abbreviate the things like
I have. uh you know, oop reversal, uh range breakout, you kind of set your own entry tactics here. Um any buy notes for
that trade, you'd enter here. Any setup that you that you like to use, you kind of put those there as well. And then
again, you want to enter your cost basis on the trade, your shares, your stop-loss and sell price. And then
everything else is calculated for you uh based on, you know, percentage of your portfolio. This is calculated based on
uh your starting amount right here. And then over here is where the magic happens. We calculate percent change,
equity, percent change, or multiple. So, you've got all that data there for you. And you can also put any additional
notes you have. And this tracks the portfolio value after each of these individual trades. Uh so, after you've
entered that uh all that data, so you'd want to enter in your trades, and I'd suggest starting with about 10 or so, uh
what you want to do is go over to the second tab here. And then this is where you'll see your actual trade metrics. So
the number of trades 20 uh number of winners uh seven number of losers 13 here your batting average uh the batting
average for the sample set was 35%. Average percent gainer was pretty high and that's because this market has been
so strong about uh 17%. Average loser is about minus 4%. The ratio is 4.8 and then this is the same metrics just based
on equity contribution instead of just raw performance. Uh so if something was weighted higher with a bigger position
size uh it would have more impact here. So um average equity gain on a winner uh was uh 2 uh 36. Average loss was about
half a percent of your portfolio. And then you also calculate the ratio here. It's very similar numbers but uh you can
see how perform uh you know position size does have an impact. And this might be more realistic numbers than this
right here. Uh then we've got duration. So again this will be calculated for you. Average day on winner was 7 1/2.
average day on a loser was 4.4 and then you'll also see some different graphs be calculated here. Uh now one thing I one
thing I do want to mention here is these are based on uh the sample size I have right here which is 20 trades. If you
have more than that what you want to do is make sure you go ahead and tweak uh the different values to uh basically uh
sum up the right right things. So you basically want to um extend all the calculations, drag the formula down
right here. Uh but this should be a good uh you know sample set to start with. Uh you can go ahead and test out 20 trades
and see how uh the visuals uh adapt. Right here over here is the cost basis calculator. You know, if you've got
different buys, uh say there's only uh two buys. Let me delete this. You've got uh you know, buy one
100, maybe it's even. So buy two is also 100. These are the two numbers. It calculates the cost basis right for you.
And similarly for a cell rule, it calculates that for you as well. And you can take a look at the formula and see
how we we do this. Now, this is still a little bit manual. And this is a big reason why in DFU, we're very excited
about the the journaling aspect because it will calculate all this for you and just output the trade analytics and
distributions uh and visuals right here for you. But again, here are the the two graphs I already talked about. This is
plotting the performance over the course of the trades but also highlighting the different setup that was used. So you
can see most of them were up the right hand side base trades but then you had two which were gappers. I think it was
szle and hymns uh were were gapper trades and those actually were both positive and you can see they were
actually one of the the two of the strongest trades that were made over the series of uh this example. So this can
be a really handy visual is tagging your performance by the setup itself. Um and you can go ahead and customize this all
that uh but this can be help helpful to identify trends uh of of improvements you can make and this might say hey
gappers are really working right now or during this period gappers really worked so that would be the time to try more
gappers or focus on gappers. So this can be a really handy visual and again the whole point of these visualizations are
trying to identify outliers, key trends and tweaks that you can make to your system from a high level to say hey you
know uh this would improve your performance focusing more on gappers uh trying to get rid of these uh you know
stop-loss outliers down here down 9%. Uh which is a CRWV gap down uh uh that you know you had right here that's the
example and try to get more of these of course these winners that trend there for you. So, that's a quick walkthrough
of the trade log. Um, again, it might be it might take a little bit to get familiar with this. Uh, but, you know,
work through it and I think it'll be helpful as a foundation if you're not already tracking your stuff in in your
own spreadsheet. Uh, but, you know, this might be a helpful starting point for you guys. Uh, yeah, engineers love
details. Uh, yes. Yeah, I'll I'll send this uh link out to this um through email after this uh webinar is done. All
right, cool. So, that's a quick run through of that trade log. Again, uh test things out. Enter your own trades
right here. Uh start with five, 10, see how these numbers change and uh and how the the graphs change as well. And
that's pretty much it for uh today's webinar. Again, this is a little bit of a shorter one. Tomorrow will be a little
bit more longer. We're going to be talking about diving into uh individual trades themselves using some different
examples, how to analyze your your buy point and not judge it based on necessarily performance, but uh based on
you know how well you executed uh your your trade. So with that, I just want to
remind you guys that for people who have pre-ordered the book, we have an additional bonus webinar uh on advanced
pullback strategies that will be next Wednesday. Um it won't be at 11 a.m. That's a quick typo. It'll be at 6 PM
Eastern. And you can scan here to submit your receipt of your pre-order uh to go ahead and attend those. I've had a lot
of fun doing uh the breakouts one, the earnings gappers. Uh there you go, Ry. Ry fixed it right there for us. Um yeah,
I've had a lot of fun doing the breakouts bonus webinar. Uh the uh the gappers webinar. Hopefully that was
really helpful for you. Went a little bit more into details, some some advanced techniques. Uh so if you've
attended those, let us know in the chat what you thought of them. And uh yeah, highly recommend uh pre-ordering because
you unlock these bonus webinars as well. All right. Uh and then here's again uh the QR code to actually
pre-order the Trader Handbook. We're getting right down to it, guys. If you if you are going to order it, you've got
to right now. Again, you unlock so much more than just the book, uh the educational course, um the the model
books, all these are bonuses that will be sent the launch week. I saw a question about that earlier. And you
also unlock those bonus webinars on uh advanced breakout trading, gapper trading, and the pullback one, which
will be uh live next Wednesday. So definitely uh order your book today. And uh in addition, we're also talking a
little bit about, you know, unlocking for people who've ordered the book uh a special community and special Q&A. So
stay tuned for that. Uh but just another reason to go ahead and order your handbook. Uh Ry, anything you want to
add uh today to close things out on trading analytics before uh we move on to uh some questions here? And make sure
uh you unmute your mic. There you go. No, I think um just m make sure you you know um your some of the
numbers that we discussed today. Um knowing them is is most important. Uh download the the trade lock template
that Richard just went over. uh import some of your trades. Um know what happens when you place, you know, uh
let's say your max position size is 17%. And then how many if you have five or six losing trades in a row, uh how much
you know effort it will take for you to recover uh from that. That will help you adjust your max loss or entry tactics.
Um know what's happening especially in the last you know uh 15 I would say 10 to 15 trades. always know that your
current situation of your trading a lot better. Uh then you know and then you can get into the the system based stuff.
Um if you don't know why you're trading poorly and you don't have any numbers behind it, you're just again like we
said are being random because your inputs are random, your outputs will also uh be random. So this webinar was
all about uh putting some numbers behind your trading success or failure and then uh these numbers will tell you the truth
uh whether you know you could be more successful than you are now or if you're uh in a downward trending equity curve
how do you turn that around um as well. So mathematically math doesn't lie. uh the visuals that we spoke about with the
histogram and the equity curve also um are just the proof in the pudding that you need to take a look at for you to
turn around if you're a phase one two trader into a 34. And that's really been our objective uh throughout you know the
last uh 8 to 10 webinars uh to to get you guys to transition to at the very least the consistency phase and then
with experience you'll get into uh performing well uh in the markets. happy to, you know, take some questions now,
Richard, if you see them in the chat, and they don't have to be, I guess, related to to this topic, but we could
do it just Yeah, I see I see one from John. Um, how does the spreadsheet handle partial cells and add-ons? Really
good question. So, uh, initially, if you know, you start a 10% uh, position in Palance here and then a 5%, you could
add them as additional entries, additional rows in the spreadsheet. Uh but you know if you're kind of uh kind
of treating them uh as as they're the same thing maybe the the whole position gains 15% on you uh then you could kind
of combine them using the cost basis calculator. And similarly for cells if you are doing multiple sells you could
um after you're done with the whole trade uh combine those using the the cost basis calculator uh to calculate
your your the right averages for that. But really good question John. Um let's see here.
Let's see. How could you handle different currencies? You'd have to come up with the the conversion of uh the
right stuff. That's that's a more complex thing. Uh for sure, but you just have to get the conversion
numbers. Let's see. Go ahead. You see one? Um how do we get the sheet? We'll we'll
email it out if you're on the list. Um for sure. I don't see any other questions. A lot of thank yous. Uh
question is are those winners full positions or partial or partial cells? The example I showed was uh pretty much
full position cells. But again, you could use the cost basis. You you basically at the end of the day, you
know, if you sell one, you know, half at 100, half at 95, you basically just have to find the your average cost um the
average cell. And to do that, you can use the quick calculator I have as a spreadsheet uh tab on that spreadsheet
that I'll send out. Uh Ry, you want to talk about what what will be going on with DP Journaling? Yeah. Much of what
you guys see in the spreadsheet will be there, but also things like uh the and automated too, right? There'll be no
there'll be no manual stuff you got to do. Yeah. So, all you would do is uh import and sync. Um we'll we'll get to
it. Got Q3 of this year. uh we'll we'll put put out a very basic one where you can um you know uh hook it to your
broker, import your trades. We'll give you pre-calculated um you know stats like we spoke about today. Um also these
you know we'll get into these visuals like we we showcased with a histogram and um success by setup things of that
nature. So it'll be a full-fledged module uh for your journaling. um what what you see out there I I would say is
uh you know just journaling tools make it a little little too complicated. Um so we'll start with the very basics what
we feel are the most powerful metrics and stats and then uh over time you know uh evolve that module to be what folks
you know in terms of feature requests etc want it to be. Yep. And like like all modules, we'll take in user feedback
and add stuff and and continuously improve it. Uh we've got that feedback loop built in. Again, uh that good
concept time back to today. So thank you guys. Also, anyone watching watching the stream today, um it's May 17th. Uh we're
thinking of doing a uh a meetup in in New York uh if you're if you live in that area uh on the weekend of the 31st
and June 1st. Um so if you're interested definitely uh head over to X uh just look at my profile. I I retweeted. We're
trying to gather uh you know interest for that. And if you're in that area, we would be happy to meet up in person on I
think Sunday, June 1st is what we're planning. Uh we don't have a location uh just yet. We're just trying to gather
interest. Yep. And we'll sign books and and all that stuff. Y uh perfect. All right. Uh
well, thank you guys all for attending. Uh see you guys back here at the next webinar uh shortly. But again, make sure
you pick up your Traers handbook if you haven't already. Uh the bonuses, I saw a question about this. A lot of the
bonuses are coming launch week. So, after the the book is launched, we'll be emailing out uh to everybody who submits
their receipt. Uh the link to that is in the description of the stream uh how to submit your receipt. And if you uh
register your your uh receipt, you'll you'll receive those bonuses. You'll also unlock the um the educational
course on the training website. All that will be happening launch week. So, that's when you'll receive those
bonuses. We'll break it down by day and uh I'll send out an email really summarizing the bonuses shortly and uh
letting you guys know the timeline for each of those, but there's a lot that comes with the book. Uh it it well more
than covers the cost of the book. Again, this signing up this weekend allows you to unlock a $100 Trailine gift card by
itself that that more than pays for the book. And with that, you get exclusive webinars um and uh just some great
resources as well. So, thank you guys all again. Definitely pick up your copy if you haven't already. And uh we'll see
you guys in the next one. Cheers. [Music]
A feedback loop in trading is a process where traders continuously analyze their actions and results to improve their strategies over time.
You can keep a daily journal, use trade input forms, or import data from your broker to track your trades effectively.
Important metrics include batting average, average gain/loss, risk-reward ratio, max gain/loss, and trade duration. For a deeper understanding of how to leverage these metrics, consider exploring our summary on Mastering HR Analytics.
Visualizing data helps identify trends, strengths, and weaknesses in your trading strategy, making it easier to make informed decisions.
Beginners should analyze their trades weekly, while more experienced traders can do so monthly or quarterly.
You can use spreadsheets, trade log templates, and even AI tools to analyze your trading data effectively.
By consistently analyzing your trades, understanding your metrics, and making necessary adjustments to your strategies.
Keep this summary
Save it to LunaNotes and it becomes a real note in your library — editable, searchable, and ready to turn into flashcards or a diagram. Free to start.
Save to LunaNotesOr summarise for another video.
This summary and transcript were automatically generated using AI with the Free YouTube Transcript Summary Tool by LunaNotes.
Related summaries
Complete Trading Mastery: From Basics to Million-Dollar Strategy
Discover a comprehensive 10-hour guide teaching you how to trade markets effectively from scratch. Learn to analyze market structures, identify key trading patterns like head and shoulders, apply confluence strategies, and manage risk to grow from beginner to a profitable trader. This video includes live trade breakdowns and real-time insights from a seasoned trader’s journey from $100 to six figures.
Mastering Trading Psychology: Randy How's Insights on Emotional Mastery
Discover the essential psychological challenges traders face and learn expert strategies from renowned trading psychologist Randy How. This comprehensive summary unpacks how mastering emotions, relinquishing control, and developing discipline are key to consistent trading success.
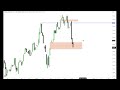
Mastering Market Maker Models: Forex, Indices & Stock Trading Insights
Discover expert analysis on the dollar index, forex pairs, gold, crude oil, and major indices, emphasizing anticipation over reaction in trading. Learn practical market maker buy and sell models, smart money reversals, and actionable strategies for consistent trading success.
Mastering the Power of Three in Trading: A Comprehensive Guide
In this video, the host simplifies the powerful trading strategy known as the Power of Three, which consists of accumulation, manipulation, and distribution phases. Viewers learn how to effectively implement this strategy in their trading sessions, along with insights on price action and market structure shifts.

Mastering Smart Money Mindset and Price Action for Market Success
This comprehensive mentorship session reveals the critical mindset shift from uninformed retail trading to a smart money perspective, emphasizing detailed price action analysis and disciplined chart logging. Learn to interpret market liquidity, recognize key price levels, and systematically track price movements across multiple timeframes for informed trading decisions.
Most viewed summaries

A Comprehensive Guide to Using Stable Diffusion Forge UI
Explore the Stable Diffusion Forge UI, customizable settings, models, and more to enhance your image generation experience.

Kolonyalismo at Imperyalismo: Ang Kasaysayan ng Pagsakop sa Pilipinas
Tuklasin ang kasaysayan ng kolonyalismo at imperyalismo sa Pilipinas sa pamamagitan ni Ferdinand Magellan.

Mastering Inpainting with Stable Diffusion: Fix Mistakes and Enhance Your Images
Learn to fix mistakes and enhance images with Stable Diffusion's inpainting features effectively.

Pamamaraan at Patakarang Kolonyal ng mga Espanyol sa Pilipinas
Tuklasin ang mga pamamaraan at patakaran ng mga Espanyol sa Pilipinas, at ang epekto nito sa mga Pilipino.

How to Install and Configure Forge: A New Stable Diffusion Web UI
Learn to install and configure the new Forge web UI for Stable Diffusion, with tips on models and settings.
Found this summary useful?
Take it with you. One click puts it in your own LunaNotes library.
Save to LunaNotes