Introduction
Welcome back to the channel! In this video, we simplify one of ICT's most powerful strategies, the Power of Three, which is essential for traders looking to enhance their trading skills.
Overview of the Power of Three
The Power of Three consists of three key phases:
- Accumulation: This phase involves price consolidation, where relatively equal highs and lows are formed.
- Manipulation: This occurs when the market moves in one direction to take out liquidity before reversing.
- Distribution: The final phase where the market moves in the opposite direction after manipulation.
Trading Sessions
- The strategy can be applied during different trading sessions, particularly the London and New York kill zones.
- Price typically accumulates during the Asian session, leading to manipulation in the London session, or vice versa.
Key Concepts
- Order Blocks: Identifying order blocks above equal highs is crucial for predicting market reversals. For a deeper understanding of trading concepts, check out our summary on Curso Gratuito de Trading: Conceptos Clave de ICT.
- Liquidity Sweeps: Understanding that price often sweeps liquidity before making significant moves is vital for successful trading.
- Market Structure Shifts: Recognizing shifts in market structure helps traders identify potential entry points. For more on this topic, see our guide on Mastering Your Reading Strategy: A Comprehensive Guide to Analytical Reading.
Practical Application
- The video provides a detailed breakdown of a recent trade example, illustrating how to identify setups using the Power of Three.
- Emphasis is placed on waiting for confirmation before entering trades to ensure a favorable risk-to-reward ratio.
Resources
- A free ebook trading guide is available for download, providing additional insights into trading strategies and concepts. You can also explore more about trading strategies in our summary of Understanding WD Gann: Mastering Trading with Timeless Rules.
- Viewers are encouraged to join the mentorship program for daily live streams and trade ideas.
Conclusion
The Power of Three is a powerful strategy that can significantly enhance trading performance when understood and applied correctly. For more detailed guidance, consider joining the mentorship or accessing the free resources provided in the description.
FAQs
-
What is the Power of Three in trading?
The Power of Three is a trading strategy that involves three phases: accumulation, manipulation, and distribution. -
How can I apply the Power of Three in my trading?
You can apply this strategy by identifying accumulation phases, waiting for manipulation, and then looking for distribution signals. -
What are order blocks?
Order blocks are areas on the chart where significant buying or selling has occurred, often leading to reversals in price. -
Why is liquidity important in trading?
Liquidity is essential as it provides the fuel for market movements; price often sweeps liquidity before making significant moves. -
How can I improve my trading skills?
Joining a mentorship program or accessing educational resources like ebooks can help improve your trading skills. For more information on personal branding and growth, check out Unlocking Personal Branding Success: The Three-Pillar Method for Rapid Growth. -
What is a market structure shift?
A market structure shift occurs when the price breaks previous highs or lows, indicating a potential change in market direction. -
Where can I find the free ebook mentioned in the video?
The free ebook can be downloaded from the link provided in the video description.
Welcome back to the channel, guys. So, in this video, I'm going to completely simplify one of ICT's most powerful and
most commonly used strategies, the power of three. Now, a lot of beginners are making mistakes when they take trades
following the power of three. I'm going to show you exactly how you can adapt this technique into your own trading
strategy, no matter what sessions you're trading. I'm going to show you the exact price action knowledge and to show you
guys that I have been calling out these moves. As you can see, I've literally been taking trades in the signal zoom.
We call over 600 pips yesterday from this exact cell that was sent out to the signal Dream right here. And as you can
see, take profit was smashed. And we've been calling out multiple trades like this in the signal Dream. So you guys
can go ahead and join. And if you want to learn exactly how we're catching these, we also do have a mentorship
where we also teach and live stream daily on a daily basis in the Discord. So make sure you go ahead and check that
out. Let's get straight into the video. So essentially the power of three consists of three phases. accumulation,
manipulation, and distribution. So, when it comes to the time or the sessions that we're trading, this can be in the
London kill zone or the New York kill zone. And the reason I say this is because when price is accumulating,
ideally, we want to see a consolidation, a quite obvious consolidation, right? So, as you can see, relatively equal
highs are being built up to the upside, relatively equal lows are being built up to the downside. Now, as you can see, I
marked out a vertical line here. And this is ideally going to be the start of London kill zone or the start of New
York kill zone. The reason I'm saying this is because the session prior to London kill zone is obviously Asia
session, it does usually range and build up liquidity on both sides of the market. So therefore, when London
session opens or the London kill zone opens, we usually see a manipulation in one direction before then seeing a
reversal. Now this reversal may happen in the London session or this reversal may happen uh into the New York session.
So the main point is you want to see the manipulation in either the London kill zone or the New York kill zone. We'll
only see the manipulation happen in the New York kill zone if London session has been accumulating orders and not really
been doing much. So if London session has been consolidating, we'll see New York manipulate and then reverse. But if
Asia session has been accumulating orders, then usually we'll see London session manipulate and then either see
reversal in that same session or London will manipulate and then we'll see reversal in the New York session. But
the main thing we're focusing on is the manipulation. Now a lot of people are getting faked out following these
manipulation patterns because a lot of ICC traders have come about now, a lot of smart money traders and usually when
they teach beginners, beginners get caught up on the wrong side of the market because they're not looking for
the correct things. What I want to see above equal highs is ideally an array of some kind. What this signifies is an
order block. So, we've got an order block, an up close candle before a down move. And also, if you want to see all
the requirements for an order block, for a valid order block, make sure you go ahead and check the description below
for another video that I've done solely on order blocks if you want to see all the confirmations for it. But basically,
what I want to see is some sort of premium array above these equal highs. So therefore, at this point right here,
at this point in time, if price does sweep these equal highs, I know that it's tapping in to a premium array on
the left where we will definitely see some sort of reaction. Okay, so that's what I want to see for a bearish
example. And also guys, myself and Sniper Ads have created a completely free ebook trading guide. So you guys
can go ahead and download the book yourselves. It'll be linked down below. It'll be the first link in the
description. Make sure you go ahead and check that out. We spent a lot of time creating that to make sure there's a lot
of value in there. So take advantage of it. It's completely free and you will 100% find value in there. So make sure
you go ahead and check that out in the description below. And remember, if you want extra guidance, join the mentorship
in the description below. We'll hold your hand throughout your trading process. We'll live stream with you
daily, Monday to Thursday. And you'll also get access to the signals room for completely free once you join the
However, if you just want access to our trade ideas daily and analysis like this with the trade ideas and exits in mind,
make sure you go ahead and join the signals room in the description below. So, back to what I was saying, once
you've identified that, okay, let's say for example, Asia session has been consolidating and we also have an order
block to the left above these relatively equal highs because don't forget money is resting above these highs. Once we
see this candle, let's say on the 15minut time frame or the 5minut time frame, push up and close above these
highs and tap into the order block on the left, this is when we'll drop down into the lower time frames to look for
confirmation. Because most of the time when you're watching this on the 15-minut time frame, on the five minute
time frame, you'll see this candle push up, most people will be waiting for confirmation. And by the time price has
made its move down, it's down here and it's too late to sell because, as you can see, the risk-to-reward just isn't
worth it at that point. There's no point taking a trade if there's a 0.3 risk-to-reward potential in there. You
want to be taking trades higher up where there's at least minimum a 1:1 risk-to-reward ratio in there. That's
the bare minimum that we're looking for when we're taking these setups. So on the lower time frames, what are we
looking for? As you can see, I've marked out here a market structure shift after this liquidity grab. So we see a market
structure shift right here because price is pushing to the upside making bullish higher highs and higher lows. And then
we saw price break to the downside with displacement taking out this low. This could be on the 1 minute. Sometimes it
might be visible on the 5m minute, but you may also have to drop down into the lower time frames like the 1 minute to
actually see this playing out. So what we want to see is an impulse to the downside taking out this previous low on
the left. And then after this we want to see a clear retrace and then a push in the opposite direction. You might see a
new higher time frame like 15-minute candle opening at this point on the retrace which is fine because you can
predict that okay the next candle has opened at this point right here. We can predict that this candle is going to
make a high before pushing to the downside. And that's essentially what this power of three setup is all about.
Let's say you're looking for a daily move overall. You see price open up. Let's say we're looking for a bearish
day. So price opens at this price point right here. If our bias is bearish overall, we're expecting a bearish
candle to be created. Most of the time, you will see price sweep above the opening price before pushing to the
downside and then having a bit of a retrace right there. But my point is that once you have a bias and once you
know that price is okay moving to the downside, most of the time you will see price push up before it pushes to the
downside. And that's essentially what we're trading here. At this point right here, you know that okay, price is going
to most likely move to the downside because of this order block and because of these relatively equal highs that
have been created. However, if the market's at this point right here, let's say this is the opening price, price
isn't just going to drop down straight away. It has to take some form of liquidity before it moves in the
opposite direction. Liquidity is fuel for the markets before a big move. You will always see liquidity being swept in
the opposite direction. You guys can go ahead and back test this yourself on the chart. You will 100% see this. All we're
looking for is a sweep of liquidity, confirmation, and then a reversal to the downside. And ideally, we want this to
be in a kill zone. Most of the time you will see this purge happen in the London kill zone and like I said sometimes you
will see it in the New York kill zone if London has been ranging. So I'm going to show you an example of this setup
playing out right now. And just so you guys can see that I sent this trade out to the signal zoom. You can see the
before analysis was sent out to the signal zoom with an explanation. I'm seeing gold buys. You can wait for
confirmation and enter stops below the lows targeting 3360 and higher. So 3360 was right here. As you can see, analysis
was sent out right here. And price literally pushed up straight away, giving us over 150, around 200 pips,
right? So, let's break this down right here. What did I see? So, I'm going to rewind to this area right here, and
we're going to zoom in to the 5minut time frame. Remember, we can switch between the 15 and the 5m minute time
frame. Now, what time is this? So, this is just after London session. My time is set to New York time zone right here.
But before we do anything, what can you see on the lower time frames? Right in this area right here, you can see price
is pretty much moving sideways. In this area right here, price is accumulating orders. So, straight away I can see that
we have relatively equal highs right here. And we also have relatively equal lows in this area right here. Zooming
out to the 15minut time frame just to get our narrative. Price has pushed to the
downside right here. So, we made an impulse to the downside. As you can see, all these relatively equal highs have
been swept. This is a big example of a power of three playing out in Asia session, actually. So, I'm going to
break this down in a second, but looking at price action right now, price has made a big drop to the downside. It's
tested the previous lows and it's also swept liquidity from the previous Asia session low on Tuesday. Now, from this
area right here, it's rejected and we've seen a push or an impulse to the upside. So on the 5m minute time frame now I'm
looking at price action and I was seeing this accumulation of orders. I was seeing this consolidation right here. So
after consolidation what can you expect a sweep? Now you got to think logically. Does it make sense to sweep liquidity to
the upside and then see a big reversal or does it make sense to see a sweep to the downside and then see a reversal to
the upside? Now the first question I'm going to ask is where is our point of interest? Have we got an array to the
left? So, if these highs get swept, is there a clean order block to the left? If we see a sweep to the downside, is
there a clean order block to the left? And the answer to that is yes, there is. I can see there's a bit of an old log
right here. And we also have an order block right here. Remember, price doesn't always have to test these order
blocks, these areas. But if it comes down to there, it's a bonus. So, if it comes down and taps into these areas, it
is a bonus. So, I'm just going to mark out this order block. If price comes to around this area right here, okay, that
is a good sign. Now, zooming out to the 15-minut time frame, straight away I'm seeing this fair value gap. So, I'm
going to mark out this fair value gap instead because it's more likely to tap into this fair value gap if price does
sweep these lows. So, I've marked it out right there. Again, if price taps into there, that's an added confluence to the
trader. Doesn't have to. It has to line up with the narrative overall. So, let's just see what happens on the five minute
time frame now. Okay. So, straight away you can see that fair value gap gets filled in. Our order block even gets
tapped into pretty much to perfection right there with this wick. Okay, so there's two conferences there straight
away. It's taken out the lows and it's also tapped into our discount arrays. Now all I was waiting for on the 1
minute time frame right here was pretty much a shift in structure. Now I've marked out this area right here and I
only marked this out after the 5m minute had taken out this high right here. So you can see we have a swing high right
there on the one minute as well. This is clean. You can see that we have a high, a low, lower high, lower low. All we're
looking for is a simple higher high, higher low, and then higher high. A shift in structure. This is called a
market structure shift. Right? If this high was to get taken out right here, that's a market structure shift right
there. So, what we're looking for now is for this bearish order block on the 1 minute to fail and hold as a breaker
block. So, I'm going to move up to the fivem minute time frame to show you this breakup structure.
Okay. And as you can see, pretty much to perfection, it breaks structure. And question is, is this breakup structure
showing impulsiveness to the upside? Is it showing displacement? And the answer to that is yes. As you can see, price
was showing a willingness to push higher and was maintaining above this price point. So on the 1 minute time frame,
all I was looking for was pretty much a retrace into this area to look for buyers off. So, I'm going to forward
it. Okay. So, as you can see, it's taps into this area right here. And around this point was where I sent it out to
the signals room. So, I sent it out at 11:41 UK time, literally as price tapped into that area there. So on the first
pretty much tap of that breaker block and as you can see if you entered right here with either your stops below the
breaker block right that was that would have been risky just in case price had swept this lower right here then pushed
to the upside or you could have placed it below this low and then targeted higher right 3360 area as you can see
just under a 1 to2 right and that's the worst case scenario with the biggest stop loss possible now one other thing
I'm going to show you a bit of a gem when it comes to trading ICT concepts and trading this sort of pattern right
here is inversion fair value gaps. So just like this order block was a failed bearish order block. Price took it out
right here. You can use the same for fair value gaps. So as you can see we have a bearish fair value gap right here
with candle one, candle two and candle three. And as you can see price didn't respect it as a bearish fair value gap.
Instead price broke it to the upside and we saw a retest of this. We saw support form right here. and then we can expect
a push up. So here we're expecting a push to the upside. And as you can see, New York session is about to kick in
soon. So let's see if that gives it that volume that we want. And as you can see, New York's kicked in right now. And
there's the volume that we're seeing. And 3360 was my target. Why was 3360 my target? Well, first of all, we see the
sort of old high area right here. But specifically, but specifically, what is this? It's the previous sessions high.
So it's London sessions high right here. So, I was expecting this area to get taken out just a bit below. I like to
target just in case price doesn't actually reach that area right there. So, let's say we bought in this area
right here. Stop loss below the inversion fair value gap. If you're targeting this high right here and price
is literally only a few pips away, around 20 pips away. I'd just take profits, right? Or take partials at
least because you don't know if price can just reverse it right there. Reverse from the area right there. And I would
rather not risk it. Even though I would draw on liquidity is this. So yes, you can technically hold, but realistically
if price does get that close, you can go ahead and just close your profits. Again, looking at price action, we were
overall bearish, pushing to the downside. So this is a retracement setup, and we also talk about this in
the ebook that's completely free for you guys to go ahead and join. This is one of the textbook plays that are in there.
So make sure you go ahead and download it for completely free, learn from it, take notes, um, and yeah, check that out
in the description below. So, let's see what price does right here. Okay, New York session is giving it that volume.
As you can see, the TP was hit at 3360 and it's also testing those previous session lows. As you can see, I told the
members to secure some profits right there. And yeah, we've been taking trades like these regularly. You guys
can go ahead and join right here. It's only $30 a month because I want serious people in there only. Otherwise, I would
have made it free for everyone because I am giving a lot of free value out on my uh completely free Telegram community as
well. But for those of you that want daily updates, trade ideas, and also weekly market breakdowns, make sure you
go ahead and join the signal team. As you can see, 600 pips was called from this area right here. If you want to see
a trade breakdown on this, let me know in the comments down below, and I will break this trade down in the next
YouTube video. But I'm going to break down this setup right here because this was pretty much a perfect example of the
power of three and it was on a larger scale. So, let me break this down right here. Looking at price action on the
15minut time frame. Also, by the way, guys, you can see this is another trade that was called out to the signals room
from this area right here. And from this area, I was targeting around 200 pips. Price went up for around 400 or 500 pips
even. So, we are calling some amazing trades out in the signal zoom by using multiple different strategies and
different techniques. Make sure you go ahead and check that out in the description below if you do want to go
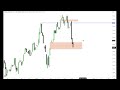
ahead and join. But looking at this price action right here, just look at how equal these highs are right here.
This is literally the perfect example of a liquidity buildup. So you can see buy stops resting above here, this high and
this high. Why? Because sellers are entering the market right here in this area right here. And they're placing
their stop losses in the form of buy stops above these highs. So what price is going to do is price is going to
sweep liquidity. It's going to take out these highs. And once price sweeps liquidity, it's going to trap out even
more market participants. For example, breakout buyers that are entering the market here. and then we're going to see
a reversal to the downside. Now, what ICT teaches us is to take advantage of this liquidity sweep to the upside and
catch the sells from the highest point possible because think about it, if you're trying to sell a product, you're
trying to get the highest price for it. This was supposed to be a bullish order block, but price failed to hold as a
bullish order block. And now we can expect it to be a breaker block in this area right here. we can probably see
Asia push up, take out these highs and manipulate into this point of interest before then seeing a reversal
potentially in London session or even that same session in Asia session. So we'll let price play out. We'll see what
happens. So price instantly taps into this area right here. Candlestick behavior, we've immediately seen a
rejection on the 5m minute time frame right now or even the one minute time frame because we can't really see
structure. Okay, so on the 1 minute time frame right now, we are seeing a break of structure or market structure shift
to the downside. What else can you see? You can also see that we have an order block right here. Okay. And I would like
to see a better break of structure if I'm just looking at the one minute time frame right here. I'd like to see a bit
more displacement to the downside before a retrace and then a push down. However, bear in mind, it's already hit the point
of interest. Remember on the last trade example, I entered as soon as price pretty much hit my point of interest,
right? My breaking block. But for this but for this example, sometimes what you will see is an entry right as price taps
into the point of interest and you can literally enter place your targets at the opposing liquidity area right there.
And you will see price rush away from this area because it's already unlocked the liquidity from here. Now it's
searching for these new lows, right? So therefore, what we can expect is a quick move away from price. So bear in mind,
don't be too picky with your break of structures. Again, candle closures have occurred right here. So it is a valid
breakup structure. Let's just see if we see a retrace into this order block. Okay, as you can see, this order block
didn't exactly hold. If I was selling in this area right here, I would place my stop loss above these highs minimum,
maybe even above this point of interest just to be safe because a tip, especially trading gold, sometimes you
will see price gets a bit choppy. It sweeps liquidity before you actually see your move to the downside. So, let's say
we were to enter in this area right here. Stop loss safely above these highs and targeting the opposing
liquidity at these lows. Okay? Because don't forget on the 15-minut time frame, that was our original bias. We were
expecting these highs to get swept and then these untapped lows to basically get tapped into. So, we'll let price
play out on the one minute time frame. And as you can see, we see we are seeing a nice push right here. We've seen a
solid break of structure now. And we've seen a retrace. Let's get rid of this for a second. We've seen a break of
structure. And now we've seen a retrace. And from this area, we can expect this lower high to hold for us to then push
bearish. As you can see, okay, that lower high did hold. Did see a push down. Came back up right there. But
again looking at price action, we haven't even retested this area right here. So price might consolidate. Uh
because don't forget it is Asia session. There's not that much volume in the markets right now. We are just expecting
our move to overall play out because it has broken structure. This area could all be a lower high to then push to the
downside. I'm going to play this out on the 15-minut time frame so you guys can see
this. And as you can see, price is pushing down with a lot of energy and a lot of force because look, you're on the
right side of the market. You've positioned yourself correctly. You understand that, okay, we have a sweep
to the upside. So now price is going to go in your direction because you're going with the flow. The trend is your
friend. This is something that we talk about in our ebook as well. The trend is your friend. Market structure is the
first sort of chapter that we look at because it's so important. And a lot of traders, a lot of beginner ICT traders
will look at this as displacement to the upside. They look for a retrace to continue higher. They look for fair
value gaps and order blocks to trade off. And they wonder why these order blocks fail. This is the reason why
order blocks and your points of interest fail because you're not positioning yourself with the overall narrative.
You're not positioning yourself with the overall direction of the market. You need to zoom out. Look at the overall
consolidation. Where is the accumulation? So here this was the accumulation phase. Then we saw the
manipulation phase. After the manipulation phase, we saw the distribution to the downside even
continuing even further. So guys, if you found value from this video, imagine what value we're providing in our
mentorship in the Discord. Bear in mind, guys, you will also get access to all the previous live stream recordings on
the once you join. So, you'll have over 50 hours of mine, the Sniper Ads content to go through as well. We've
kept it in a very simplified format, but there's just a lot of value in there. And whilst you're in the Discord, you're
part of the team. You're part of the family. So, we will take care of you and we will be answering your question 24/7.
You can ask us any questions in the Discord or private chat, whatever you want. Make sure you go ahead and check
that out. And also, for those of you that want access to the signals room for just $30 a month to get access to my
trade ideas and analysis daily, make sure you go ahead and check that out in the description below. Remember, our
completely free ebook guide that we spent a lot of time on is completely free for you to claim. Make sure you go
ahead and check that out in the description below. and I'll see you in the next one.
The Power of Three is a trading strategy that involves three phases: accumulation, manipulation, and distribution. In the accumulation phase, price consolidates with relatively equal highs and lows. The manipulation phase sees the market move in one direction to take out liquidity before reversing. Finally, the distribution phase occurs when the market moves in the opposite direction after manipulation.
You can apply the Power of Three strategy by first identifying accumulation phases where price consolidates. Next, wait for signs of manipulation, such as sudden price movements that take out liquidity. Finally, look for distribution signals that indicate a reversal in the market direction.
Order blocks are specific areas on a price chart where significant buying or selling activity has occurred. These areas often lead to reversals in price, making them crucial for traders to identify potential entry and exit points.
Liquidity is vital in trading as it allows for smoother market movements. Price often sweeps liquidity—meaning it temporarily moves to take out stop-loss orders or trigger buy/sell orders—before making significant price changes. Understanding liquidity helps traders anticipate market behavior.
Improving your trading skills can be achieved by joining a mentorship program, which offers daily live streams and trade ideas. Additionally, accessing educational resources like ebooks can provide valuable insights and strategies to enhance your trading knowledge.
A market structure shift occurs when the price breaks through previous highs or lows, indicating a potential change in market direction. Recognizing these shifts is essential for traders to identify new entry points and adjust their strategies accordingly.
The free ebook can be downloaded from the link provided in the video description. It offers additional insights into trading strategies and concepts that can help enhance your trading skills.
Keep this summary
Save it to LunaNotes and it becomes a real note in your library — editable, searchable, and ready to turn into flashcards or a diagram. Free to start.
Save to LunaNotesOr summarise for another video.
This summary and transcript were automatically generated using AI with the Free YouTube Transcript Summary Tool by LunaNotes.
Related summaries

Complete Trading Mastery: From Basics to Million-Dollar Strategy
Discover a comprehensive 10-hour guide teaching you how to trade markets effectively from scratch. Learn to analyze market structures, identify key trading patterns like head and shoulders, apply confluence strategies, and manage risk to grow from beginner to a profitable trader. This video includes live trade breakdowns and real-time insights from a seasoned trader’s journey from $100 to six figures.
Beginner's Guide to Price Action Trading: Trends & Consolidation Explained
This free beginner-friendly video course introduces the fundamentals of price action trading, focusing on understanding uptrends, downtrends, and consolidation. Learn how to identify market trends, avoid common pitfalls, and set up essential trading tools for success.

Unlocking Generational Wealth: A Comprehensive Guide to Day Trading in 2025
In this engaging video, Tyler shares his journey from struggling with side hustles to mastering day trading, revealing the strategies and mindset needed to succeed in the digital age. He emphasizes the importance of emotional discipline, risk management, and understanding market dynamics to build generational wealth.
Mastering Market Maker Models: Forex, Indices & Stock Trading Insights
Discover expert analysis on the dollar index, forex pairs, gold, crude oil, and major indices, emphasizing anticipation over reaction in trading. Learn practical market maker buy and sell models, smart money reversals, and actionable strategies for consistent trading success.

Understanding Market Efficiency: How Smart Money Drives Price Movements
This comprehensive guide unpacks the market efficiency paradigm, revealing how a small group of smart money traders—primarily banks and institutional players—control price movements, not the large retail crowd. Learn to recognize the distinct phases of price delivery, including consolidation, expansion, reversal, and retracement, and apply this knowledge to enhance trading strategies.
Most viewed summaries

A Comprehensive Guide to Using Stable Diffusion Forge UI
Explore the Stable Diffusion Forge UI, customizable settings, models, and more to enhance your image generation experience.

Kolonyalismo at Imperyalismo: Ang Kasaysayan ng Pagsakop sa Pilipinas
Tuklasin ang kasaysayan ng kolonyalismo at imperyalismo sa Pilipinas sa pamamagitan ni Ferdinand Magellan.

Mastering Inpainting with Stable Diffusion: Fix Mistakes and Enhance Your Images
Learn to fix mistakes and enhance images with Stable Diffusion's inpainting features effectively.

Pamamaraan at Patakarang Kolonyal ng mga Espanyol sa Pilipinas
Tuklasin ang mga pamamaraan at patakaran ng mga Espanyol sa Pilipinas, at ang epekto nito sa mga Pilipino.

How to Install and Configure Forge: A New Stable Diffusion Web UI
Learn to install and configure the new Forge web UI for Stable Diffusion, with tips on models and settings.
Found this summary useful?
Take it with you. One click puts it in your own LunaNotes library.
Save to LunaNotes