What is Standard Deviation?
Standard deviation is a key statistical measure that quantifies the amount of variation or spread in a set of data. It is closely related to the normal distribution, often visualized as a bell-shaped curve.
- The mean (average) represents the center of the data.
- Standard deviation measures how far data points typically deviate from the mean.
- Approximately 68% of data falls within one standard deviation of the mean.
- About 95% falls within two standard deviations.
- Nearly 99% lies within three standard deviations.
A smaller standard deviation indicates data points are closer to the mean, while a larger one shows more spread.
Conceptual Example
Consider the average height of men in the U.S. as the mean. Most men are around this height, but some are taller or shorter. The standard deviation tells us how much variation there is in these heights.
Calculating Standard Deviation by Hand
- Collect your data set: For example, data points: 1, 2, 3, 4, 5.
- Calculate the mean (x̄): Sum all data points and divide by the number of points.
- (1+2+3+4+5) / 5 = 3
- Calculate each deviation from the mean: Subtract the mean from each data point.
- Square each deviation: This removes negative signs and emphasizes larger differences.
- Sum all squared deviations: Add all squared values together.
- Divide by degrees of freedom (n-1): For a sample size of 5, divide by 4.
- Take the square root: This gives the standard deviation.
Example calculation:
- Deviations squared: (1-3)^2=4, (2-3)^2=1, (3-3)^2=0, (4-3)^2=1, (5-3)^2=4
- Sum = 10
- Divide by 4 = 2.5
- Square root of 2.5 ≈ 1.58 (standard deviation)
Using a Spreadsheet to Calculate Standard Deviation
Spreadsheets simplify this process:
- Enter your data into cells.
- Use the formula
=AVERAGE(range)to find the mean. - Use the formula
=STDEV(range)to calculate the standard deviation.
For example, with data points 0, 2, 4, 5, 7:
- Average is 3.6
- Standard deviation is approximately 2.7, indicating a wider spread than the previous example.
Key Takeaways
- Standard deviation is essential for understanding data variability.
- It relates directly to the normal distribution and data spread.
- Manual calculation reinforces understanding but can be time-consuming.
- Spreadsheets provide a quick and accurate way to compute standard deviation.
Understanding and calculating standard deviation helps in analyzing scientific data accurately and making informed conclusions.
For further insights into statistical concepts, consider exploring Mastering Descriptive Statistics in Excel: A Step-by-Step Guide to enhance your data analysis skills.
If you're interested in the applications of standard deviation, check out Understanding Z-Scores and their Applications in Statistics for a deeper understanding of how this concept is utilized in various fields.
To grasp the importance of precision in measurements, you might find Understanding Significant Figures in Measurements particularly useful.
Hi. It's Mr. Andersen and in this video I'm going to talk about Standard Deviation. When you're collecting data in a science lab the amount of data you collect is important. So is the average. But another important statistic is going to be the standard
deviation of your sample. And so in this video I'm going to show you what it is conceptually. I'm then going to show you how to calculate standard deviation by hand and then finally I'm going to show you how to calculate it using a spreadsheet. And so first of all,
what is it? Well to understand standard deviation you'll have to understand the normal distribution. And so what does that mean? Well, it's a bell shaped curve. You might think of it like that. And so in the United States most men are about 5 foot 9. In other words that's the average
right here. That's the mean, or in statistics that's the X bar. But there's going to be a lot of men who are obviously taller than that and a lot who are shorter than that. And so the standard deviation is going to measure the spread or the variation in this
bell shaped curve. And so basically if we were to go right over to here, this dark area is going to be 1 standard deviation above and 1 standard deviation below the mean. Or it's going to be below the average. And there's something cool about that. About 68% of the
individuals are going to be in this area. So 1 standard deviation above and below. Or if we were to look at this for example, down here is two standard deviations and so 95% of individuals are going to be within 2 standard deviations from that mean. And then finally
if we go way down here 99% of individuals are going to be within 3 standard deviations of the mean. But the standard deviation is going to vary depending on the data that you collect. So if we have two curves like this, so if this is one curve and then we had another
curve that look like this, that data plotted on the same curve, this on is going to have a smaller standard deviation than this one. They're both going to have stand deviations obviously. They're going to have amounts where it's 68, 95 and 99% of the people, but this
one down here since it's more spread out is going to have a higher standard deviation. And so how do we calculate that? Well the equation is a little scary. The scary part ends up being right here. So students are a little scared by that, the summation symbol.
But it's actually pretty straight forward. It's not that hard to calculate the standard deviation. And so let me show you how to do that. And so first thing you want to do is you want to have a data set. And so here's going to be our data set right here. And to
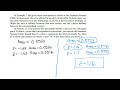
make this easy let's say we just have five pieces of data. 1, 2, 3, 4, and 5. So you're collecting data and this is the data in your data table. And you want to figure out the standard deviation of that. Well to set that up we're basically going to take the square
root of the summation of this divided by the degrees of freedom. So that sounds a little bit scary and so let's go to the scariest part to begin with. Let's look at what's going on right here underneath that square root. And so what this is, so if we go like this,
the summation of x minus x bar squared, basically it means for each of these data points that I have we're going to have to figure out what's right here, so x minus x bar. And so the first thing we have to do is figure out what the average is. So we have to figure out what
x bar is. Well basically if I add 1, 2, 3, 4, 5 together I get fifteen. And if I divide that by n, which is the total number of data points, so in this case n equals 5. So we have 5 data points over here. So if I divide 15 by 5 hopefully you can figure out an average,
the average is going to be 3. And so the mean is 3 or the average is 3. So what we have to do is we have to calculate this value for all five of these data points. What does that mean? Well right here we're going to use x and x for the first case is going to be 1.
So that's going to be 1 minus 3 and then we're going to square that. So what is that? 1 minus 3 and we square that is going to be negative 2 and if we square that, so that's negative 2 squared and if we square that that's 4. Let's go to the next one. Well this is 2 minus
3 so that stays the same. So that's negative 1 squared. And so that's going to be negative one squared or that's going to equal one. If we go to the next one, that's easy. That's 3 minus 3 squared equals 0. And if we square 0 that's going to be 0. Go to the next one.
That's going to be 4 minus 3. That's going to be 1 squared or equal to 1. And then finally if we go 5 minus 3, square it. That's going to be 2 squared and that's going to equal four. And so if you ever see the summation sign, don't be scared by that. It's not scary
at all. It just means you've got to do a lot of work. So for each of these data points 1 through 5 I had to calculate what was in there. And then I have to add it all up. So I have to add 4 plus 1 plus 1 plus 4. And if I add all of those up I get 10. And so
what's going to be inside there is simply going to be 10. So let's figure out the rest of my standard deviation. Standard deviation is going to be the square root, in this case we've solved this as equal to 10 and then we're going to divide that by n minus 1. So
what's n? That's our sample size. In this case it's 5 and so we take n minus 1 and that's going to equal four. And so what is our standard deviation? It's the square root of 10 divided by four which is 2.5. Or if we take the standard deviation of, the square root of 2.5, that's
going to be something like 1.58. And so you're going to have to use a calculator to figure that out. Well what does that mean? If we were to plot this data as a histogram for example, this would be our standard deviation. 1.58. And so it takes awhile to figure that
out based on doing it by hand. And so if you want to, give it a try. And so here's a data set over here and so try to calculate the standard deviation using this data set over here. And try to do it by hand. I'll put the answer down in the description below the video.
But I would give it a try. It's worth doing once on your own. And again this is going to be our formula, standard deviation and so try to do that. Try to do that by hand. And so I'll wait. No, I won't wait for you to do that. Pause the video. Try to do this
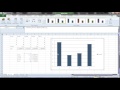
one and I'm going to show you how to calculate this really really quickly. And so I'm going to show you the spreadsheet shortcut. And so how do you do that in a spreadsheet. It's pretty simple. So what I'm going to do is going to take this data and I'm going to switch
over here to Excel. So here's the data right here. 0, 2, 4, 5 and 7. And so I've entered my data into different cells. And now I'm going to figure out the mean, just to show you how easy this is. To figure out the mean I'm going to hit an = here and then I'm going
to just start typing. So I'm going to type in average because the spread sheet's not going to use the word mean. So I type in the word average and then I select my data. I hit a closed parenthesis, I hit end and it's going to give me my average with is going
to be 3.6. So if I wanted to know the average there it is. If I want to know the median for example I could just type median and I could go down like that and so spreadsheets are super simple. And so what are we looking for? We're looking for the standard deviation.
So how do I do that? I just hit =. I then start typing stdev, can you see how it pops up right here, standard deviation, parenthesis and then I'm going to select that and then I'm going to go like that. So what's the standard deviation? It's 2.7. What does that mean?
We had a bigger spread in the second data set then we did in the first set. A higher standard deviation. And if you did it by hand it should've look something like that. So that's standard deviation and I hope that's helpful.
Standard deviation is a statistical measure that quantifies the amount of variation or spread in a set of data. In science labs, it is crucial for understanding data variability, helping researchers determine how consistent their measurements are and how much they deviate from the average.
To calculate standard deviation by hand, first collect your data set and find the mean. Then, calculate the deviation of each data point from the mean, square these deviations, sum them, divide by the degrees of freedom (n-1), and finally take the square root of that result to find the standard deviation.
To calculate standard deviation using a spreadsheet, enter your data into cells, use the formula =AVERAGE(range) to find the mean, and then apply =STDEV(range) to compute the standard deviation. This method is quick and reduces the chance of manual calculation errors.
A smaller standard deviation indicates that the data points are closer to the mean, suggesting less variability and more consistency in the measurements. This can be particularly important in scientific experiments where precision is key.
Standard deviation is closely related to the normal distribution, which is often visualized as a bell-shaped curve. Approximately 68% of data falls within one standard deviation of the mean, 95% within two, and nearly 99% within three, illustrating how data is spread around the average.
Sure! For a data set of 1, 2, 3, 4, 5, first calculate the mean (3). Then, find the squared deviations: (1-3)²=4, (2-3)²=1, (3-3)²=0, (4-3)²=1, (5-3)²=4. Sum these (10), divide by degrees of freedom (4), and take the square root to get approximately 1.58 as the standard deviation.
For further insights into statistical concepts, consider exploring resources like 'Mastering Descriptive Statistics in Excel' for data analysis skills, or 'Understanding Z-Scores and their Applications in Statistics' to see how standard deviation is utilized in various fields.
Keep this summary
Save it to LunaNotes and it becomes a real note in your library — editable, searchable, and ready to turn into flashcards or a diagram. Free to start.
Save to LunaNotesOr summarise for another video.
This summary and transcript were automatically generated using AI with the Free YouTube Transcript Summary Tool by LunaNotes.
Related summaries
How to Calculate Mean, Standard Deviation, and Create Charts in Excel
Learn step-by-step how to calculate the mean and standard deviation for behavioral data in Excel and create clear, informative charts with error bars. This guide simplifies data analysis and visualization for better understanding and presentation of your results.
Understanding Significant Figures in Measurements
Learn how to accurately use significant figures in measurements for better results in physics.
Understanding Z-Scores and their Applications in Statistics
Explore the relationship between z-scores and probabilities, examples, and how to find values based on z-scores.
Mastering Descriptive Statistics in Excel: A Step-by-Step Guide
In this tutorial, learn how to analyze single variables in Microsoft Excel using pivot tables. Discover how to count responses, calculate percentages, and compute averages and medians for effective data analysis.

Normal Distribution Review and Chi-Squared Test Explained
This video reviews key concepts of the normal distribution and demonstrates how to calculate probabilities related to basketball players' weights. It also covers conducting a Chi-Squared test for independence to analyze the relationship between players' performance and weight.
Most viewed summaries

A Comprehensive Guide to Using Stable Diffusion Forge UI
Explore the Stable Diffusion Forge UI, customizable settings, models, and more to enhance your image generation experience.

Kolonyalismo at Imperyalismo: Ang Kasaysayan ng Pagsakop sa Pilipinas
Tuklasin ang kasaysayan ng kolonyalismo at imperyalismo sa Pilipinas sa pamamagitan ni Ferdinand Magellan.

Mastering Inpainting with Stable Diffusion: Fix Mistakes and Enhance Your Images
Learn to fix mistakes and enhance images with Stable Diffusion's inpainting features effectively.

Pamamaraan at Patakarang Kolonyal ng mga Espanyol sa Pilipinas
Tuklasin ang mga pamamaraan at patakaran ng mga Espanyol sa Pilipinas, at ang epekto nito sa mga Pilipino.

How to Install and Configure Forge: A New Stable Diffusion Web UI
Learn to install and configure the new Forge web UI for Stable Diffusion, with tips on models and settings.
Found this summary useful?
Take it with you. One click puts it in your own LunaNotes library.
Save to LunaNotes