Overview
This video provides a comprehensive review of the normal distribution and the Chi-Squared test for independence, using basketball players' weights and performance data as practical examples.
Normal Distribution Concepts
- Given Data: Weight (W) of basketball players is normally distributed with mean (μ) = 66 kg and standard deviation (σ) = 4 kg.
- Probability Calculation:
- Find P(X < 60): Using the normal cumulative distribution function (N CDF), the probability that a player weighs less than 60 kg is approximately 0.668.
- Expected Number of Players Below 60 kg: In a group of 50 players, expected count = 50 * 0.668 = 3.34 players.
Probability Within 1.5 Standard Deviations
- Calculate the range: 1.5 * 4 = 6 kg.
- Interval: 66 - 6 = 60 kg to 66 + 6 = 72 kg.
- Probability P(60 < X < 72) = 0.866 using N CDF.
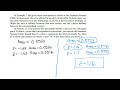
Finding a Weight Threshold Using Inverse Normal
- Given P(W > K) = 0.32, find K.
- Calculate P(W < K) = 1 - 0.32 = 0.68.
- Using inverse normal function, K ≈ 67.9 kg.
Chi-Squared Test for Independence
- Context: Testing if basketball players' performance is independent of their weight category.
- Hypotheses:
- H0: Performance is independent of weight.
- H1: Performance depends on weight.
- Expected Frequency Calculation:
- Example: For average weight and satisfactory performance, Expected frequency = (Total average weight * Total satisfactory performance) / Total players = (22 * 25) / 60 = 9.17.
Conducting the Chi-Squared Test
- Data entered into a 3x2 matrix.
- Chi-Squared statistic calculated as 2.49.
- Critical value at 5% significance level is 5.991.
- Since 2.49 < 5.991, fail to reject H0.
Conclusion
- There is insufficient evidence to conclude that performance depends on weight.
- At the 5% significance level, performance is independent of weight.
This video effectively demonstrates how to apply normal distribution calculations and Chi-Squared tests in real-world sports data analysis, providing clear steps and interpretations for statistical decision-making.
For a deeper understanding of the concepts discussed, you may find the following resources helpful:
- Comprehensive Review of Discrete Probability Distributions and Expected Values
- Understanding Z-Scores and their Applications in Statistics
- Mastering Confidence Intervals for Population Proportions in Statistics
- Introduction to Probability and Statistics: Key Concepts and Terminology
- Understanding and Calculating Standard Deviation in Science Labs
this video is about review for normal distribution and a Kai squared test the weight w of basketball players in a
tournament is found to be normally distributed with a mean of 66 and a standard deviation of 4 Kil gr find the
probability that a basketball player has a weight that is less than 60 kilg x follows a normal distribution
with a mean 66 standard deviation
4 we are looking for probability of X less than 60 since for normal distribution
ution it's a continuous data X less than 60 means X less than or equal to 60 do not be confused with the binomial
distribution we will use the N CDF menu 55
2 lower bond is negative Infinity upper bond is 60
mean 66 standard deviation four enter enter answer is a
0.668 A2 in a training section there are 50 basketball players find the expected number of players with a weight less
than 60 kilogram in this training session expect the number equals n * p 50 *
0.668 equals 3.34 the probability that a basketball
player has a weight that is within 1.5 or standard deviation of the mean is a q sketch a normal curve to represent this
probability standard deviation is four 1.5 * 4 = 6 mean is 66 - 6 = 60 66 + 6 = 72 let's
scale to the the graph mean 66 three equal segment on the left side and also on the right side the standard
deviation is a 4 70 74 78 minus 4
62 58 54 then sketch this uh belt curve we are
looking for 60 and a 72 60 is a here
72 estimator here then shate this area B2 find the value of Q we are
looking for probability of for X greater than 60 less than 72 we got to use the normal
CDF manual 55 2
60 72 66 4 enter enter answer is 0.866
say given that p of w greater than K = 0.32 find the value of K we will use inverse Norm for inverse
nor go to calculator Manu 553 we need a
area this area is defined by the area under the curve when X less than x in other words the area equals a
probability of for X less than x we are given probability of for w greater than k equal
0.32 so the area we need equals the probability of w less than k equal 1 minus probability of w greater
than K = 1 - 0.32 which is 0.68
0.68 Mu is 66 standard deviation is a four enter enter answer is 67.9 we used the this uh inverse
normal in calculator we got k equal 67.9 a basketball coach observed 60 of
her players to determine whether their performance and their weight were independent of each other her
observations were recorded as shown in the table she decided to conduct a High
Square test for Independence at the 5% significance level the critical value for this test
is 5991 for this test State the hypothesis independent of for is
ho dependent on is H1 because h is related to eal side to no change to no
relationship ho the performance is independent of the weight H1 the performance is dependent on the
weight D2 find the expected frequency of average weight we with the satisfactory
performance average weight and satisfactory performance this is a seven we need to figure out the
total number for average weight 22 total number for settis the factory
performance six + 7 + 12 25 so total for average is a
22 total for settis factory is a 25 total player 60
therefore 25 * 22 over 16
equals 9.17 e find the kai squar the statistic and a state with the
justification the conclusion for this test we need a matrix so clear this scratch Pad
menu seven enter enter we need uh three rows two
columns double click this uh right arrow button then go down right arrow button again go down enter put in the data then
store this Matrix into a control variables a
enter Then go to menu statistics seven stats
tests Kai Square 2E test eight right arrow button
eight enter we got Kai Square P value and D degree of
Freedom remember this please reject
H which means P value less than significance level reject H it's a
opposite Kai Square GC reject ho that's how you remember
when k Square greater than critical value K reject it all Kai square is a 2.49 this uh critical value is
5991 less than so not enough evidence reject ho we will write down ho with the significance level the performance is
independent of the weight at 5% significance level conclusion the performance is independent of the weight
at 5% significance level
The normal distribution is a probability distribution that is symmetric about the mean, showing that data near the mean are more frequent in occurrence than data far from the mean. In the video, it is applied to analyze the weights of basketball players, where the mean weight is 66 kg with a standard deviation of 4 kg, allowing for probability calculations regarding player weights.
To calculate the probability that a basketball player weighs less than 60 kg, you can use the normal cumulative distribution function (N CDF). In the video, it is shown that this probability is approximately 0.668, meaning about 66.8% of players weigh less than 60 kg.
Finding a weight threshold using the inverse normal function involves determining a specific weight (K) such that a certain percentage of players weigh more than that threshold. In the video, for a probability of 0.32 that a player weighs more than K, the inverse normal function is used to find that K is approximately 67.9 kg.
The Chi-Squared test for independence is conducted by formulating hypotheses about the relationship between two categorical variables—in this case, basketball players' performance and their weight categories. The video explains how to calculate expected frequencies and the Chi-Squared statistic, ultimately concluding that performance is independent of weight based on the test results.
To calculate the expected frequency in a Chi-Squared test, you multiply the total number of observations in one category by the proportion of observations in the other category. For example, if the average weight and satisfactory performance are known, the expected frequency is calculated as (Total average weight * Total satisfactory performance) / Total players, as demonstrated in the video.
The conclusion drawn from the Chi-Squared test results in the video is that there is insufficient evidence to suggest that basketball players' performance depends on their weight. Since the calculated Chi-Squared statistic (2.49) is less than the critical value (5.991) at the 5% significance level, the null hypothesis is not rejected.
The video provides several resources for further learning, including links to comprehensive reviews of discrete probability distributions, Z-scores, confidence intervals, and key concepts in probability and statistics. These resources can help deepen your understanding of the topics discussed in the video.
Heads up!
This summary and transcript were automatically generated using AI with the Free YouTube Transcript Summary Tool by LunaNotes.
Generate a summary for freeRelated Summaries

Comprehensive Review of Discrete Probability Distributions and Expected Values
This video review explains discrete probability distributions, including how to calculate probabilities, expected values, and conditional probabilities using practical examples. It covers machine breakdown probabilities and dice game scoring to illustrate key concepts in probability theory.

Estimating Mean and Testing Normality of Family Movie Running Times
This summary explains how to estimate the mean running time of 200 family movies using mid-interval values and frequency data. It also covers how to estimate the interquartile range from a cumulative frequency graph, identify outliers, and perform a chi-square goodness of fit test to assess if the running times follow a normal distribution.
Understanding Z-Scores and their Applications in Statistics
Explore the relationship between z-scores and probabilities, examples, and how to find values based on z-scores.
Mastering Confidence Intervals for Population Proportions in Statistics
This lesson introduces confidence intervals for population proportions, a foundational concept for hypothesis testing in statistics. Learn how to calculate margin of error, understand critical Z-values, and apply these concepts to real-world sampling problems.
Understanding and Calculating Standard Deviation in Science Labs
This video explains the concept of standard deviation, its importance in data analysis, and how to calculate it both manually and using a spreadsheet. Learn how standard deviation measures data spread around the mean and see step-by-step examples for practical understanding.
Most Viewed Summaries

A Comprehensive Guide to Using Stable Diffusion Forge UI
Explore the Stable Diffusion Forge UI, customizable settings, models, and more to enhance your image generation experience.

Kolonyalismo at Imperyalismo: Ang Kasaysayan ng Pagsakop sa Pilipinas
Tuklasin ang kasaysayan ng kolonyalismo at imperyalismo sa Pilipinas sa pamamagitan ni Ferdinand Magellan.

Mastering Inpainting with Stable Diffusion: Fix Mistakes and Enhance Your Images
Learn to fix mistakes and enhance images with Stable Diffusion's inpainting features effectively.

Pamamaraan at Patakarang Kolonyal ng mga Espanyol sa Pilipinas
Tuklasin ang mga pamamaraan at patakaran ng mga Espanyol sa Pilipinas, at ang epekto nito sa mga Pilipino.

How to Install and Configure Forge: A New Stable Diffusion Web UI
Learn to install and configure the new Forge web UI for Stable Diffusion, with tips on models and settings.

If you found this summary useful, consider buying us a coffee. It would help us a lot!