Introduction to Confidence Intervals and Hypothesis Testing
This lesson is part of a series on mastering statistics, focusing on hypothesis testing and confidence intervals involving population proportions. Understanding confidence intervals is essential before diving into hypothesis testing, as both concepts are closely related and use similar statistical distributions.
What is a Confidence Interval?
- A confidence interval estimates a population parameter (like a mean or proportion) based on sample data.
- Since measuring an entire population is impractical, we use samples to estimate population characteristics.
- The confidence interval provides a range (window) around the sample estimate where the true population parameter is likely to fall.
- This range is defined by the sample estimate plus or minus a margin of error.
Recap: Confidence Intervals for Population Means
- Large samples (n ≥ 30) use the normal distribution.
- Small samples (n < 30) use the T distribution.
- Both distributions are bell-shaped and symmetrical but differ slightly in shape.
- These concepts will parallel the methods used in hypothesis testing.
Confidence Intervals for Population Proportions
- A proportion represents the fraction of a population with a specific characteristic (e.g., percentage of people who like books).
- Population proportion is denoted as lowercase p.
- Sample proportion, denoted as ( \hat{p} ), is calculated from sample data.
- Sample size is denoted as n.
Calculating Margin of Error for Proportions
The margin of error (ME) formula for population proportions is:
[ ME = Z_c \times \sqrt{\frac{\hat{p}(1 - \hat{p})}{n}} ]
Where:
- ( Z_c ) = critical Z-value based on confidence level
- ( \hat{p} ) = sample proportion (decimal form)
- n = sample size
Understanding Critical Z-Values
- Critical Z-values correspond to the confidence level (e.g., 90%, 95%, 99%).
- The area between ( -Z_c ) and ( Z_c ) under the normal distribution curve equals the confidence level.
- Common critical Z-values:
- 80% → 1.28
- 85% → 1.44
- 90% → 1.645
- 95% → 1.96
- 98% → 2.33
- 99% → 2.575
Constructing the Confidence Interval for Proportions
- The confidence interval is:
[ \hat{p} - ME \leq p \leq \hat{p} + ME ]
- This interval estimates where the true population proportion ( p ) lies with the specified confidence.
Example Problem: Margin of Error for Teachers Knowing Sign Language
- Sample: 147 teachers surveyed.
- 13 teachers know sign language.
- Sample proportion ( \hat{p} = \frac{13}{147} = 0.088 ) (8.8%).
- Confidence level: 90%, so ( Z_c = 1.645 ).
Calculation Steps:
- Calculate ( 1 - \hat{p} = 1 - 0.088 = 0.912 ).
- Compute the standard error: [ \sqrt{\frac{0.088 \times 0.912}{147}} = 0.023 ]
- Calculate margin of error: [ ME = 1.645 \times 0.023 = 0.038 ] (3.8%).
Interpretation:
- The margin of error is ±3.8%.
- The confidence interval for the population proportion is approximately 8.8% ± 3.8%, or from 5.0% to 12.6%.
- This means we are 90% confident that the true proportion of teachers who know sign language falls within this range.
Key Takeaways
- Confidence intervals for proportions use the normal distribution and critical Z-values.
- The margin of error depends on the sample proportion, sample size, and confidence level.
- Sample proportions are expressed as decimals, not percentages, in calculations.
- Understanding confidence intervals is crucial for hypothesis testing, as both share similar statistical foundations.
Next Steps
- Practice more problems involving confidence intervals for population proportions. For further reading, check out Understanding Z-Scores and their Applications in Statistics and Understanding Populations and Sampling in Statistics.
- Progress to hypothesis testing concepts, where these foundational ideas will be applied and expanded. You can start with Introduction to Statistics: Understanding Populations, Samples, and Data Collection.
By mastering these concepts, you will build a strong statistical foundation essential for analyzing real-world data and making informed decisions based on sample information.
hello welcome to this lesson in mastering statistics this batch of lessons primarily is going to be
covering the concept of hypothesis testing and statistics and I've been getting emails for years about uh asking
me to cover the material that's called hypothesis testing the truth is hypothesis testing is very very simple
to understand but in order to understand it and do well you have to cover all this material in front of it and really
understand all of those Concepts otherwise the whole concept of hyp testing does it make sense so what we're
actually going to start this batch of lessons off before we get to any hypothesis testing is we're going to be
talking about confidence intervals involving uh population proportions now if you remember back to the previous
volume of mastering statistics we covered confidence intervals in great detail mostly what we were concerning
ourselves with was the population or the confidence interval of uh population means and so if you've never watched
that material if you've never watched the previous um information on confidence intervals you really need to
stop everything you're doing right now go back and get that material and watch most importantly learn and understand
all of that material because it's all building everything we're going to do here is going to kind of assume that you
understand that and hypothesis testing in turn is going to assume that you understand confidence intervals the two
concepts are not that far apart uh especially how we use the uh normal distribution the T distribution and
we're also going to learn some other distributions they're very similar how you handle it for confidence intervals
as to how you handle it when you do hypothesis testing okay so here we're going to talk about confidence intervals
uh with population proportions uh and so I want to remind you briefly just a real quick sentence or two what a confidence
interval is is what we've done done in the past so just to remind you what it basically is is we have a population out
there you know we want to understand the mean of that population could be their I the mean of their IQ could be the mean
of their heights could be the mean of parameter associated with the population well clearly we can't go to the whole
population and measure everybody's height or everybody's IQ that would be millions of people so what we do instead
is we take a sample so we may sample 50 people or 40 people or 69 people or something like this and we look at the
sample data that we get and we look at if we're studying Heights for instance we look at how high these people are we
have 59 measurements or something of which is our sample of the population so we can get in a mean of our samples
right and we think that's pretty good representation of the population mean but clearly it's not totally exact
because we're only taking a small sample the population's enormous right obviously the larger the number of
samples the better but let's say we have like 100 samples or 95 samples and we get an average height or an average IQ
or whatever it is we're studying okay how can we use that information and estimate what the population mean is for
the average IQ of of the whole country let's say let's say that's our population we're studying well we know
that the number are sample means is not going to be exactly the same as the population mean but it should be pretty
close so what we do is we we come up with this idea called a confidence interval it's basically a fudge factor
that we we basically look at our sample mean that we get from our measured data and we say okay that's going to be in
the middle of the window now there's some error associated with that plus and minus our sample mean and that error is
called the margin of error and so once we know what the margin of error is that we calculate we can calculate this
window by adding and subtracting from the sample meaning that we have we get a window and when then we say that the
population meme which could be the population IQ or the population Heights or whatever is going to fall within this
window with a certain level of confidence level of confidence comes and plays into everything with um with these
uh margins of error and these confidence intervals also the level of confidence comes into play significantly in
hypothesis testing but in any case so far what we've done is problems associated with the population mean and
the sample mean and if you remember we had two main cases we had large number of samples that means the sample data
that we get is 30 or greater and then we have a small uh sample size which means less than 30 all right and if you
remember back from the previous lessons and you should have already watched those if we have a large number of
samples we use the normal distribution to calculate the confidence interval and if we have a smaller sample size than 30
we call it small small samples then we use what we call the T distribution now the normal distribution is
bell-shaped and the T distribution is also bell-shaped but the exact shape of the T distribution slightly steeper or
fatter but it definitely is still Bell shape and it's still symmetrical I'm telling you all of this because we're
going to march on into some new territory here and also in the back of your mind I want you to also be thinking
that similar techniques are going to be used for hypothesis testing so later on when we get to hypothesis testing we're
going to have small samples and large samples and we'll be using either the normal distribution or the T
distribution and in some cases a different distribution that we'll talk about later as well so there's a lot of
parallel stuff going on here between confidence intervals and hypoth testing so don't don't forget this stuff once
you do it all right so backing up the truck we've done confidence intervals for means with small samples and large
samples now we're going to do a confidence interval for population proportions now what do you remember
about the word proportion we've talked about it many times uh the proportion is the fraction
of population um that has a characteristic so it's a fraction we usually express it
as a percentage of the population I'm just going to say fraction of the population
that has some characteristics so for instance it could be 10% of
males like books this is just a proportion so if you're talking about the entire
population it would be 10% of all males in the population like books and so on and we denote this um proportion we
denote it with just a lower case P that means the the population proportion all right now this is the proportion of a
large group of people called a population but we can never really measure everyone in the population so we
really talk about sample proportions a lot and that's exactly what it sounds like we have a
sample proportion with a samp proportion is it's a proportion I'm going to say
proportion for a sample of size n sample size is usually called n
so let's say I can't look at everybody in the country and see how what percentage of people like books but I
can go sample 50 people then in that case my sample size would be 50 and my sample proportion is whatever I whatever
measurement I get from that maybe two out of 50 people or six out of 50 people tell me that they like books and so I
can represent that as a percentage and that would be called the sample proportion now in order to differentiate
if you're talking about the sample proportion or the population proportion this is
denoted lowercase p with a hat on top and we probably talked about that before at some point too that you need to
understand the difference here when you see a hat on top you automatically know that that's talking about sampled data
probably 30 40 50 60 samples uh but it's the measurement that comes from your surveying when you don't have any hat
like that this is talking about the whole population we can't really measure that but we know that it exists okay now
just like before we have a margin of error uh like we always have and the margin of error really plays exactly the
same role as it's done in all of the problems that we've done so far if you remember before when we did the previous
confidence intervals I gave you an equation for the margin of error for the for the mean so we look at our sample
mean and we add a margin of error and we subtract a margin of error same exact concept is going to be here I'm going to
switch colors to hopefully make it a little more clear the margin of error here is going to be equal to Z subc
which is a critical value of Z because we're going to be using a normal distribution and it's times a square
root of P Hat 1 minus P hat over the sample size n now we're going to be doing a lot of different cases and
statistics here in the confidence interval area and in the hypothesis testing area and I'm going to be
throwing these equations at you a lot when you see an equation like that you shouldn't you should not think to
yourself that you understand where that equation necessarily comes from because we haven't derive this equation we
haven't done any math to show you why this is true when you get into an introductory statistics class you kind
of have to assume that people before you have discovered these things and proved them to be true your job is just to
understand how they work understand the limitation and understand how to use them when you get to more advanced
statistics courses if you go down that road then you'll be proving that this thing is true you'll be understanding
why is the margin of error equal to this specific equation there's got to be a reason somebody didn't just make it up
but we're not deriving that stuff here we're not getting into those details because it's it's not really fruitful
but what you need to know is that the margin of error to construct a confidence interval of of a proportion
is equal to some critical value of Z we'll talk about that in a minute and then here is the measured data that we
have P hat comes from the sampling that we do one minus P hat comes from the sampling that we do n is just the number
of samples um that we have so 50 samples 65 samples 100 100 people this these are the people that you're asking in your
survey it goes right here now this critical value of Z is exactly the same values as before if you remember um when
we're we we're doing before was the the uh confidence interval for uh means for population means and we use the normal
distribution for that when the sample size was large right now when we do proportions we're also going to be using
the uh normal distribution so this guy right here it comes from the definition of what we call the level of
confidence and we've talked about that many times before I'm not going to go over it again basically here's a normal
distribution and you say this is z subc and this is negative Z subc in the middle is always zero for a normal
distribution so if I come down down here and I kind of draw some dotted lines and if I shade this Central Area here the
area between these boundaries is what we're calling the level of confidence so it would be 90% level of confidence or
95% level of confidence so for instance if I was doing a problem with 95% level of confidence the area in here would be
0.95 you see when you lock down the level of confidence whether it's 80% or 75% or whatever you're locking down this
area and you're locking down the value Z subc they're going to go out or in depending on the level of confidence of
your problem if I'm doing a 99.99% confidence test then since it's 99% area in here these are going to be
shifted way out and Z subc is going to be bigger okay so because it's a normal distribution and because a normal
distribution doesn't ever change then we were able to construct a table that helped us so I'm going to say
level of confidence and this is the critical value of Z subc I've actually given you
this table in the last volume before I'm going to rewrite it here 0.80
1.28 0.85 1.44
0.90 1.645 0.95 uh
1.96 0.98 2.33 0.99
2575 all right so if I'm doing a test at a 98% confidence level then it's 098 for my level of confidence and then the
critical value of Z that goes into this equation is going to be 2.33 now obviously I've only written
some standard you know com uh common uh levels of confidence if I wanted to do 82% level of confidence and I would have
to find the number in here and I would have to go to the charts and go figure that out and it all comes down to the
definition the area between here is going to be the the level of confidence that you're after the value of Z shifts
around with that depending on what this area is but for most problems you're going to be doing an 80% or a 90% or a
98% or a 99% and so you don't really have to calculate that you just read it off the table and use it so whenever you
get all of this stuff when you when you have the sample proportion that you've calculated and you calculate a margin of
error that's based heavily on the uh the level of confidence that dictates your critical value of Z then you can
construct what we call the confidence interval and this is the confidence
interval for uh proportions and what it is is you start in the middle let me do blue you start in the
Middle with your population proportion and you say that your population proportions got to be less than your
sample proportion plus the margin of error and it's got to be greater than your sample proportion um
minus your margin of error so it's exactly the same thing as before in before we had mu here we had the the
population mean and the sample mean that we were calculating it's exactly the same concept here we uh we get we say
that the confidence interval of the population is going to be the sample proportion minus the margin of error the
sample proportion plus the margin of error this creates a window that we're saying the population proportion Falls
within so it's exactly the same before you use your point estimate um is your P hat which is what you measure your
sample proportion and you subtract and you add the margin of error from that so let's get a little bit of practice from
that um this isn't going to be a complete problem but we'll just kind of get our feet wet here and then we're
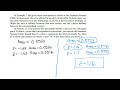
going to do a few problems here in the next few sections let's say we have 13 out of 14 7 teachers no sign language
find the margin of error for a 90% confidence interval uh for the proportion of teachers that know sign
language across the country so you have you know thousands of teachers maybe even tens of thousands of teachers or
more across the country and you want to know what percentage of those teachers know sign language so clearly you can't
go measure them all you can't go survey everybody it would just take too much time and money so what you do is you
sample and what they did in this problem is they asked 147 teachers if they knew sign language of those 147 teachers 13
of them said they did know sign language so now we have some sample data we think that that's pretty representative of the
whole population but we don't know how accurate it is because it's kind of a small sample only 147 teachers and how
that relates to the whole body of teachers in the country is a pretty big step so we want to create a confidence
interval and it's locking down for us that we only care if it's 90% a conf level of confidence so it doesn't have
to be super duper confident or level of confidence but it needs to be up there so how do we do that well you got to go
step by step with the problem you need to write down what you know and you need to make sure you understand what the
problem's asking you to do so what we're saying is the level of confidence in this problem is
90% 90% so whenever you're doing something with proportions like this you need to say what is this part telling me
well what it's telling me is really if I were going to do the whole thing manually it would say that the area here
is the level of confidence it's 0.9 so if I go look at my chart in the back of my book and if I lock down the area here
I should be able to find the value of Z here and here that make this 0.9 in the middle but see I've already done that
work for you and and given that to you here because we've constructed this table so if the level of confidence is
0.9 what it's telling you is that this value of c z is 1.645 and this value of C is negative
1.645 and if if you look at a normal distribution between those numbers the area between is exactly 0.9 that's how
this table's constructed so the critical value of Z is 1.645 so that's important
1.645 okay all right so we have the Z subc and then we go and say well how do we create or calculate the margin of
error that's given to us right here the margin of error for proportions for confidence andul of proportions is the
critical value of Z time theun of P Hat 1 - P hat Over N all right so I know what this critical value of Z is I know
what n is because I know that I've asked 147 teachers this question that's the number of teachers I've sampled but I
don't really know what P hat is that's not given that's not usually going to be given to you in the problem but it's
always possible for you to find out what P hat is and the way for you to do that is just to say well P hat is the sample
proportion of of teachers that know sign language so really all it is is 13 teachers out of 147 it's a fraction
right and when you do this you get 0.088 so the way you express it is a decimal is 088 but really if you shift
the decimal two spots to the right it'll be 88.8% these are kind of the same exact
thing whether you represent it as 0088 or 8.8% % that is the sample proportion now when you're dealing with the
equation and you're actually doing calculations with P hat you never want to use the percentage you want to use
the raw decimal that's just a rule of thumb all right so now we can calculate the margin of error Z subc we said for
this level of confidence is 1.645 and then under the radical here under the square root I have P hat which
is 088 and then I have one minus P Hat 1 point one minus
0.088 and all of this is under the square root sign and then also under here I have n but I know that n is 147
people that's how many teachers I actually asked here okay and so what I end up getting is
1.645 now if I take 1 minus 088 and I multiply by 088 and I divide by 147 this will give me a number and then I take
the square root of all of that stuff at the end I would get 0.023 all right so now I have two numbers to
multiply the margin of error when you multiply those 0.038 this is how you express it as a
decimal but since this is all about proportions you can also express it as a percentage
3.8% because you can shift the you multiply by 100 you shift the decimal two spots becomes
3.8% so this particular question didn't actually ask you to calculate the confidence interval this question said
find the margin of error um for the confidence interval at 90% for the number of teachers Nationwide who know
sign language and we're saying the margin of error is 3.8% so what we're basically saying is that we we did our
sampling we got um basically what we got from our sampling when we asked 147 teachers is 88.8% of them knew sign
language but we know that's not really true for the whole population there has to be an error associated with this
sampling estimate and now we know that that error basically is plus or minus 3.8% if we were going to calculate a
confidence interval the lower bound would be 8.8 minus 3.8 that would be the lower percentage and the upper bound
would be 8.8% plus 3.8% remember what you sample what you measure is right in the middle of your confidence interval
the margin of error is going to be minus and plus that creates a window we're saying this the population proportion
falls in the middle of that we're going to be doing a lot more problems in a few sections uh coming up I know this is
kind of a long section it's kind of getting the gears turning and the juices flowing for confidence intervals uh for
proportions but you just need to know that the concept's almost exactly the same as what we've done before there is
a margin of error that's associated with this and you're allowed to use the normal distribution for these types of
problems for for proportions uh for for population proportion problems you need to look up here from your level of
confidence get your critical value of Z calcul calculate the margin of error and then your sample estimate your point
estimate is going to be right in the middle of your confidence interval as we've done all along so follow me on to
the next section we're going to do a few more problems dealing with population proportions and confidence intervals and
then we're going to get into hypothesis testing and you're going to figure out after seeing these equations over and
over that the concept is very similar obviously hypothesis testing is different but the overall concept there
are a lot of similarities so make sure you understand this and follow me on to the next section in this course
A confidence interval is a range of values used to estimate a population parameter, such as a mean or proportion, based on sample data. It is important because it provides a measure of uncertainty around the sample estimate, allowing statisticians to infer where the true population parameter likely falls, which is crucial for making informed decisions.
To calculate the margin of error (ME) for population proportions, use the formula: ME = Z_c × √(\hat{p}(1 - \hat{p})/n), where Z_c is the critical Z-value based on your confidence level, \hat{p} is the sample proportion, and n is the sample size. This calculation helps determine the range within which the true population proportion is expected to lie.
Critical Z-values are specific values from the standard normal distribution that correspond to a given confidence level. For example, a 95% confidence level has a critical Z-value of 1.96, meaning that 95% of the area under the normal curve lies between -1.96 and 1.96. These values are essential for calculating the margin of error in confidence intervals.
To construct a confidence interval for population proportions, use the formula: ( \hat{p} - ME \leq p \leq \hat{p} + ME ), where \hat{p} is the sample proportion and ME is the margin of error. This interval provides a range that estimates where the true population proportion lies with a specified level of confidence.
Sample size plays a crucial role in calculating confidence intervals because a larger sample size reduces the margin of error, leading to a more precise estimate of the population parameter. As the sample size increases, the standard error decreases, which tightens the confidence interval, enhancing the reliability of the results.
Interpreting the results of a confidence interval involves understanding that the interval provides a range within which the true population proportion is likely to fall, based on the sample data. For example, if a confidence interval for the proportion of teachers who know sign language is 5.0% to 12.6%, it means we are 90% confident that the actual proportion lies within this range.
After mastering confidence intervals, the next steps include practicing more problems related to population proportions and exploring hypothesis testing concepts. You can further your understanding by reading related materials, such as those on Z-scores and sampling, to build a solid foundation for analyzing real-world data.
Heads up!
This summary and transcript were automatically generated using AI with the Free YouTube Transcript Summary Tool by LunaNotes.
Generate a summary for freeRelated Summaries
Understanding Z-Scores and their Applications in Statistics
Explore the relationship between z-scores and probabilities, examples, and how to find values based on z-scores.
Introduction to Statistics: Understanding Populations, Samples, and Data Collection
This video provides an overview of the first chapter in statistics, focusing on data collection, populations, samples, and the importance of sampling methods. It also introduces key concepts such as census, sampling units, and the advantages and disadvantages of different data collection methods.

Understanding Populations and Sampling in Statistics
This video provides a comprehensive overview of different types of sampling methods in statistics, focusing on random sampling techniques such as simple random sampling, systematic sampling, and stratified sampling. It explains how to carry out these methods, their advantages and disadvantages, and includes practical examples for better understanding.

Understanding Averages, Ratios, and Proportions in Mathematics
This video covers essential mathematical concepts including averages, ratios, and proportions. The instructor explains challenging questions from past exams and provides practical examples to help students grasp these topics effectively.

Introduction to Probability and Statistics: Key Concepts and Terminology
In this video, Dr. Gajendra Purohit introduces the fundamentals of probability and statistics, covering essential terminology, types of events, and key concepts such as random experiments, sample space, and probability calculations. The session aims to provide a solid foundation for students preparing for advanced mathematics exams.
Most Viewed Summaries

A Comprehensive Guide to Using Stable Diffusion Forge UI
Explore the Stable Diffusion Forge UI, customizable settings, models, and more to enhance your image generation experience.

Kolonyalismo at Imperyalismo: Ang Kasaysayan ng Pagsakop sa Pilipinas
Tuklasin ang kasaysayan ng kolonyalismo at imperyalismo sa Pilipinas sa pamamagitan ni Ferdinand Magellan.

Mastering Inpainting with Stable Diffusion: Fix Mistakes and Enhance Your Images
Learn to fix mistakes and enhance images with Stable Diffusion's inpainting features effectively.

Pamamaraan at Patakarang Kolonyal ng mga Espanyol sa Pilipinas
Tuklasin ang mga pamamaraan at patakaran ng mga Espanyol sa Pilipinas, at ang epekto nito sa mga Pilipino.

How to Install and Configure Forge: A New Stable Diffusion Web UI
Learn to install and configure the new Forge web UI for Stable Diffusion, with tips on models and settings.

If you found this summary useful, consider buying us a coffee. It would help us a lot!