Download Subtitles for Emini Review - Feb 17, 2026 Analysis
Emini Review - Tuesday, February 17, 2026 - Joseph Imbornone
Joseph Imbornone
SRT - Most compatible format for video players (VLC, media players, video editors)
VTT - Web Video Text Tracks for HTML5 video and browsers
TXT - Plain text with timestamps for easy reading and editing
Scroll to view all subtitles
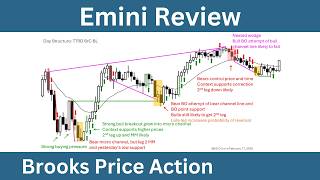
Hey everybody,
I hope everyone is doing well and had a
good day.
Thank you for joining me for today's end
of day review of the E- Mini five minute
chart for Tuesday, February 17th, 2026.
And before we get into the five minute,
I want to talk about the higher time
frame context on the daily chart. Just
quickly,
markets in a trading range. We can see
it's not clear who is in control. It's
very much sideways. When the market's in
a trading range, traders are selling at
resistance and buying at support. You
know it from the Brooks trading course,
buy low, sell high, scalp. And that
applies to all markets and all time
frames. So the daily chart is no
exception.
What's the context going into the day?
Market is in a trading range near
support. We have maybe four or five legs
down. Different computers will count
legs in different ways, but it's
important to recognize that at a minimum
that this is a late leg at support. So
unless the bears get a breakout far
below the bars to the left, we have to
assume that the breakout is going to
fail. 80% of breakouts of trading ranges
fail. Big bare breakout bar, but then
the follow-through bar was a dogee. So
bad follow-through. Bears lost momentum.
They may not be in control. Maybe
they're taking profits at support.
There's a bull breakout to the left
trapping traders in this area which
would lead to both bulls and bears
buying. So the expectation going into
the day is sellers above yesterday's
high and buyers below yesterday's low.
And by the way, when I say yesterday,
I'm referring to the prior trading day.
So
technically, this would have been Friday
the 13th of February last week. So
probably buyers below Friday.
So just as a reminder,
there's a blue horizontal line at
yesterday's low. That's what this line
on the 5minute chart
is representing.
So it's the low of the prior day
probably will act as support
on the 5m minute
context going into the day. The prior
trading day there was a tight bare
channel the minor reversal. The
expectation was this micro channel would
be enough disappointment. The traders
who sold down here are sufficiently
trapped that it creates temporary
support. The bulls will probably get a
second leg sideways to up, but that does
not make this a major reversal. It's
still more likely a minor reversal.
Sure, there might be a small trend line
break, but the bulls never got bars
completely above the moving average at
the breakout. Lots of overlap, but
bodies of bars getting smaller. So, not
a very strong bull breakout and just
barely breaking the tight bear channel
trend line. So, minor reversal more
likely and test of the lows likely.
Basically, second leg down, bare
breakout, pullback, and second leg down
to test the low is likely.
So bar one might be that second leg
sideways to up leg one deep pullback leg
two and it's sideways and the bulls got
that burst of momentum for the second
time. One pullback two but on bar one
the market is testing resistance. It
looks like a bare flag possibly a double
top bare flag bare trend trend line
break retest of the low. Bulls may be
hoping it's a major reversal, but maybe
not enough bars for a major reversal
through here. And there are exceptions
that MTRS can happen. Major trend
reversals can happen with fewer bars on
the open. So, let's see what the bulls
get for follow through. Bar two, a much
smaller bull bar. Okay, to buy second
leg up likely, but bulls are losing
momentum and they're testing resistance.
tight bear channel, second leg down
likely. So, it could be dangerous to buy
in this area. Possible second leg trap
at resistance and then a big bare
breakout bar on three. So, second leg
down likely because the traders who
bought bars one and two are trapped on
bar three and that creates resistance
above the market. Also, we mentioned the
tight air channel is likely to get a
second leg down. Also the prior days
high and low
both act as magnets. So market is
interested in in testing at least one of
them most days. Again with price action
it doesn't matter what market or what
time frame chart you're looking at.
Most bars are breakout bars and the
daily chart is no exception to that
fact.
So more more than likely any day is
going to test thigh or the low of the
prior day and the bears are likely to
get a second leg with room to the
downside to test that magnet. So bar
three it's always in short. I don't
think it was ever always in long.
Although maybe buy above one is okay but
a little suspicious with the lack of
follow through or at least the smaller
follow-through bar on bar two.
And then if you get bar three, you have
to sell below it. Too much risk that we
break to the downside and fall for a
measured move based on the height of
this bare flag, which takes us close to
the prior days low.
Bears get a follow through for it. It's
a bad stop order to buy, sell the close,
sell above.
Bears get a big small big breakout. Bar
four, it's basically a trading range
bar. you know on a on a smaller time
frame you think about the bar by bar
analysis bare trend trading range with a
bearish bias and then another bare
trend. So now bar four the low of bar 75
area is a breakout point.
It's possible that bar five is simply a
sell vacuum test of support, but it's
aggressive to simply buy with a limit
order at the low of the prior day. For
me, I'd rather wait for evidence that
there are strong buyers in this area.
So, I'd rather wait for the price action
breakout before buying here. I think
taking profits is okay here, but the
reality is that three, four, and five,
it's a strong enough bare breakout to
reset the leg count to some degree. This
is likely to get a second leg down.
And then six, a smaller follow-through
bar.
So, that one reached that measured move
target. It's much smaller follow-through
bar. It's a warning that there may be a
pullback soon. We're breaking below the
prior days low. And the expectation,
it's a trading range day, trading range
bar, daily expectation breakout will
fail. We'll find buyers below
yesterday's low.
So, we're going to speed it up a bit.
Bar seven, pretty decent bull breakout
bar. Enough for a second leg sideways to
up, but probably a minor reversal.
Second leg down still likely. The low
one fails, bulls get a second leg to the
breakout point that I mentioned on bar
four.
But the problem with bar 10, possible
second leg trap for the bulls. One
pullback, two testing resistance, second
leg down, still likely, and the bears
have not had it yet.
But seven and 10, both strong bull bars.
And it's a warning for the bears that
the downside might be limited. that
remember the higher time frame chart
suggests we're at support and the
downside might be limited which means
this might not be a bare trend that
lasts all day. It might actually end up
being a reversal in this area and
there's sufficient buying pressure on
both seven and 10. There's enough
evidence that buyers are here that the
downside might be limited.
So, possible second leg trap, but 10
enough of a breakout to trap traders
below. So, rather than buying here,
traders will buy a pullback and the
downside, like I said, might be limited.
Market testing the low.
As far as measured move targets,
most conservative one could take bars
five and six. Breakout follow through
from that trading range bar.
So breakout, pullback, second leg, and
that's a second leg measure move it
looks like on bar 13 or very close to
it.
So, it's possible it's leg one, leg two,
leg three. And this looks like a trading
range with the strength of these bull
bars.
And we'll see trend resumption at the
new low. Inside bar, another inside bar.
So, it looks like an II pattern,
possible final flag. It's a tight
trading range. And after three legs, far
below the EMA, it's a warning we may
pull back here. And seven and 10. Bars
seven and 10 are also a warning. Like I
said, the downside might be limited.
There might be buyers at the new low
rather than sellers. And this all could
be a trading range. So
where this area is the bottom of the
range and this could be the top of the
range.
Breakout bar 16 1516.
The structure is good and the signal is
strong enough for a second leg. 16
probably
by the close. 15 was probably an always
in flipping bar, meaning
you had three legs down to bar 15. Bull
bar closing on its high and probably a
trading range at this point. So buying
back shorts above 15 is reasonable.
Buying to go long above 15 is a little
aggressive but still reasonable. Or you
could wait for the breakout bar 16
increases your probability. Risk-reward
gets worse, but you do get probability
and now you have a call it a reversal
and follow through.
Or even just a one bar breakout 15 16
second leg up likely to buy the close
scale in second leg likely
shallow pullback. Bulls get a second
leg.
19, a possible measuring gap.
Testing resistance to close of bar 10.
We'll see what the bears can get. But
this is strong enough rally that the
first reversal is probably going to be
minor, which means you can buy the close
and if you use a wide stop and scale in,
you're probably going to make money.
And 80% of the time, you'll either make
money or avoid a loss.
So further breaking out on bar 20. Bar
20 is probably by the close. Bar 21
probably by the close. You just have to
be aware of the resistance to the left.
It's possible. It's a buy climax testing
resistance. So if there's any
hesitation, better to just get out and
wait. But obviously really strong rally
15 to 21. Second leg up likely.
Couple of smaller bars, 22, 23. So, it's
kind of like down here when you're far
below the moving average, you get these
smaller overlapping bars. It's a
warning. We might pull back to the
average. And up here, strong rally, but
now we're far above the moving average.
It's basically on a smaller time frame,
you would see a channel and it's three
pushes up, far above EMA, and at
resistance. So, pullback may be
increasingly likely here for the bulls.
not ideal for buying because the stop in
theory is so far. So what traders will
do instead because buying here second
leg up likely yes but your stop in
theory is below 15 that's really far
that's big risk so instead of buying
here traders will wait to buy a pullback
and if we think about day structure at
this point it's possible it's an
expanding triangle you have a low high
lower low higher high maybe we come back
down and test the lows but at a minimum
we'll probably
some sort of pullback after this rally
because it looks like it's a trading
room day.
The bars are going big up, big down, big
up. Now we're back at resistance.
Bar 24, bare breakout bar at resistance.
Strong enough bar for a second leg down.
probably always in short below 24.
Despite all of this buying pressure,
despite the micro channel, 24 isn't
always flipping
bar. Meaning, if you're long, it's
reasonable to exit longs below 24. And
if you're flat, you can sell 24, scale
in, and very likely you'll make money or
avoid a loss.
It's still probably a minor reversal. If
you're selling 24, you're not expecting
a big bare trend. You're expecting a
scalp and a second leg of similar size.
Just try to speed it up a bit here. So,
it looks like the bare breakout had a
two-legged pullback. This is a very good
example of the fractal two-legged n
nature of price action.
Bare breakout, two-legged pullback,
second leg. So, two legs through here.
one pull back, two and even 27 and 28 is
two legs down, one pullback, two.
So the bears have two legs down. They're
testing support, but this is a fairly
tight bare channel. It's actually a
micro channel. So 35 not ideal for
buying. I think it's okay to maybe start
buying and scale in, but it's also
reasonable to look for another leg down
after this micro channel.
So this is one of those instances where
you can buy, manage the trade and make
money or sell, manage the trade and make
money.
36 reversal and follow through, strong
breakout bar, reasonable buy, but also
like I said, tight bare channel, micro
channel through here. So may need one
more leg down. Now we're testing
resistance again.
this tight trading range, the high of
that tight trading range is resistance.
We find sellers in that area again. Now,
what about bar 39?
It's really like the ideal breakout bar.
It's a perfect breakout bar for the
bears. Opens on its high, closes on its
low. Very little overlap with the prior
bar. So, what's the problem with it?
Problem is context. You have
a bare channel line that it's testing
trying to break below. So, it's leg
three, one, two, three legs down and
it's testing support. It's testing this
breakout point, this breakout point,
these breakout points. There's a cluster
of support in this area. So, you have
three legs down to support after a
strong rally that is still likely to get
a second leg. And the question is, has
the rally gotten a symmetrical second
leg? No, of course not. There's no rally
similar in size to this. This is all
minor. This is a minor reversal. You can
call it a bull flag. You can call it a
pullback, but the bulls have not had
their second leg yet. So, bull breakout,
pullback, second leg still likely. So,
this is not an ideal place to be
selling. actually possibly a great
opportunity to take profits on shorts
because it's leg and a breakout bar
testing support
reversal bar 40s
the breakout gets a small second leg
still trying to break below support then
we got bar 42
so after three legs down to support bar
42 it's a strong bull breakout context
is good and we may need a big second leg
up after that rally. So buying 42 is
reasonable. It's an always in flipping
bar. So if you you know context probably
buy the close 39,
be quick to get out if you're selling,
but if you want to wait for the price
action signal, bar 42 is that signal. So
you can buy above 42. If you're short,
definitely should consider exiting
shorts above 42.
Bar 42 gets a a breakout pullback. And
this is basically a wedge double bottom.
On a smaller time frame, you'd see one,
two, three, three or four pushes down to
support.
Second leg up likely bar 42, but also
second leg up likely micro channel.
And then there's your give up bar. The
bears going for four legs down. They
give up and you get this big breakout
bar 47, second leg up likely. So the
market is building the bigger picture.
You have this big breakout
complex pullback with about 20 bars and
then possible assumption here for the
bulls. Minimum target probably the high
but of course the bulls would
also go for a measured move leg one pull
back leg two. That takes us to the prior
days high.
So bulls getting follow through buying.
It's a micro channel. Nothing to sell.
Always in long. Okay to be long. Would
you sell 51? No. Minor reversal likely.
You can buy below 51. You can buy at the
close buy below any of these bars.
54. Minor reversal likely. Buy the close
buy below.
Now we're getting to
some resistance
maybe in this area
trading range bare breakout below. So
that support became resistance. You have
this channel line. The market seems to
have obeyed a couple of times. So now
we're getting a tight trading range far
above the moving average. Maybe three
big legs up on a trading range day. So
buying here less ideal.
Still nothing to sell, but you just have
to be careful. This might be this tight
trading range might be a final flag
before a deeper pullback and maybe a
conversion into a trading range. So 59
might be a big or excuse me, a small leg
one pullback, leg two, second leg trap
at the top of the trading range.
Then it's instantly sold. 60 probably
okay to exit longs below 60. Tight
trading range. Bear bar closing near its
low.
Might correct and test breakout points
like the bar 23 high.
Just want to clean up the chart a bit.
Keep that one.
Okay. Bar 61. Another bar like 59. Now
we have three legs up. One pause, two
pullback, three. So, three legs up two
resistance. It's nested. One, two,
three. So, 61 kind of like 59. Maybe a
better sell the closed bar. Good bar to
take profits if you're long and
aggressive, but it's a limit order to
short for the bears at the top of the
tight trading range and a late leg. Yes,
bad follow-through.
But similar to down here, bare breakout
bar in a late leg, bad context for
selling, gets a small second leg, then
reverses. Bull breakout bar, bad context
for buying. There's a pause, small
second leg, and then reversal. Bare
breakout 64. Bigger bare breakout 65.
64. Always in flipping
bar kind of like 60. Reasonable to exit
below 64. Sell the close 65. Sell the
close 66. Second leg down likely.
So if a second leg down is likely and
it's sell to close then selling above 66
is reasonable minor reversal likely. So
traders will sell above 66. And you can
see that's what happened on bar 67.
What about buying 69? Probably a minor
reversal. The tight the bare channel is
tight. the signal bar is small
and this means you have low probability.
You've heard Al talk about it in the
trading course. Traders will constantly
take trades like this where the signal
bar looks great. It's a bull reversal
bar closing on its high. The risk is
small. The reward, the potential reward
is huge, maybe five times your risk. But
the trader's equation is made of three
variables. risk, reward, and
probability. So, you know, because
someone has to take the opposite side of
your trade. There's no such thing as a
perfect trade. So, if a trade is too
good to be true, for example, small
risk, huge reward, then you know you're
giving up probability. You know, the
other side has the higher probability.
So 69 it can be a tempting bar to buy
because it looks good and the you know
maybe it's a trading range.
Maybe there's maybe it's an expanding
triangle. There's an argument to be made
but
it also might be worth it to wait for
the strong bull breakout and then maybe
then you take the buy. But 69 low
probability buy tight bare channel
second leg down likely. So lower prices
likely and then it just goes outside
down 70 as we get later in the day. Not
really worth trading.
Um but the price action remains
consistent tight air channel. Second leg
down still likely 72
probably sellers above
still tight air channel. Sellers above
bars 75. Little bit of a surprise but
minor reversal more likely strong enough
bar. It'll probably get a second leg
sideways to up, but we'll also probably
test the lows before we go much higher.
So, minor reversal here. Traders will
take 75.
You know, it's a big bull bar, but
completely below the moving average
following the tight air channel. Second
leg down likely. So, 75 might be a
better sell the close bar.
Test of the lows. Bulls still may get a
better second leg sideways 12 up
although they probably got their minimum
second leg there and then maybe 78 is
their second leg sideways and then just
running out of time later in the day
tight trading range we got a bull
breakout 81
but testing
that area the bar 69 trap trapping bulls
into buying and losing money that
creates resistance. So second leg down
still likely possible. You call it a
wedge bare flag. You call it a double
top bare flag. Probably sellers in this
area. And this is probably a trading
range or a bare flag like one pullback
leg two.
All right, that's going to be it for
today's end of day review.
Thanks again for joining me for today's
video and I hope everybody has a good
night.
Full transcript without timestamps
Hey everybody, I hope everyone is doing well and had a good day. Thank you for joining me for today's end of day review of the E- Mini five minute chart for Tuesday, February 17th, 2026. And before we get into the five minute, I want to talk about the higher time frame context on the daily chart. Just quickly, markets in a trading range. We can see it's not clear who is in control. It's very much sideways. When the market's in a trading range, traders are selling at resistance and buying at support. You know it from the Brooks trading course, buy low, sell high, scalp. And that applies to all markets and all time frames. So the daily chart is no exception. What's the context going into the day? Market is in a trading range near support. We have maybe four or five legs down. Different computers will count legs in different ways, but it's important to recognize that at a minimum that this is a late leg at support. So unless the bears get a breakout far below the bars to the left, we have to assume that the breakout is going to fail. 80% of breakouts of trading ranges fail. Big bare breakout bar, but then the follow-through bar was a dogee. So bad follow-through. Bears lost momentum. They may not be in control. Maybe they're taking profits at support. There's a bull breakout to the left trapping traders in this area which would lead to both bulls and bears buying. So the expectation going into the day is sellers above yesterday's high and buyers below yesterday's low. And by the way, when I say yesterday, I'm referring to the prior trading day. So technically, this would have been Friday the 13th of February last week. So probably buyers below Friday. So just as a reminder, there's a blue horizontal line at yesterday's low. That's what this line on the 5minute chart is representing. So it's the low of the prior day probably will act as support on the 5m minute context going into the day. The prior trading day there was a tight bare channel the minor reversal. The expectation was this micro channel would be enough disappointment. The traders who sold down here are sufficiently trapped that it creates temporary support. The bulls will probably get a second leg sideways to up, but that does not make this a major reversal. It's still more likely a minor reversal. Sure, there might be a small trend line break, but the bulls never got bars completely above the moving average at the breakout. Lots of overlap, but bodies of bars getting smaller. So, not a very strong bull breakout and just barely breaking the tight bear channel trend line. So, minor reversal more likely and test of the lows likely. Basically, second leg down, bare breakout, pullback, and second leg down to test the low is likely. So bar one might be that second leg sideways to up leg one deep pullback leg two and it's sideways and the bulls got that burst of momentum for the second time. One pullback two but on bar one the market is testing resistance. It looks like a bare flag possibly a double top bare flag bare trend trend line break retest of the low. Bulls may be hoping it's a major reversal, but maybe not enough bars for a major reversal through here. And there are exceptions that MTRS can happen. Major trend reversals can happen with fewer bars on the open. So, let's see what the bulls get for follow through. Bar two, a much smaller bull bar. Okay, to buy second leg up likely, but bulls are losing momentum and they're testing resistance. tight bear channel, second leg down likely. So, it could be dangerous to buy in this area. Possible second leg trap at resistance and then a big bare breakout bar on three. So, second leg down likely because the traders who bought bars one and two are trapped on bar three and that creates resistance above the market. Also, we mentioned the tight air channel is likely to get a second leg down. Also the prior days high and low both act as magnets. So market is interested in in testing at least one of them most days. Again with price action it doesn't matter what market or what time frame chart you're looking at. Most bars are breakout bars and the daily chart is no exception to that fact. So more more than likely any day is going to test thigh or the low of the prior day and the bears are likely to get a second leg with room to the downside to test that magnet. So bar three it's always in short. I don't think it was ever always in long. Although maybe buy above one is okay but a little suspicious with the lack of follow through or at least the smaller follow-through bar on bar two. And then if you get bar three, you have to sell below it. Too much risk that we break to the downside and fall for a measured move based on the height of this bare flag, which takes us close to the prior days low. Bears get a follow through for it. It's a bad stop order to buy, sell the close, sell above. Bears get a big small big breakout. Bar four, it's basically a trading range bar. you know on a on a smaller time frame you think about the bar by bar analysis bare trend trading range with a bearish bias and then another bare trend. So now bar four the low of bar 75 area is a breakout point. It's possible that bar five is simply a sell vacuum test of support, but it's aggressive to simply buy with a limit order at the low of the prior day. For me, I'd rather wait for evidence that there are strong buyers in this area. So, I'd rather wait for the price action breakout before buying here. I think taking profits is okay here, but the reality is that three, four, and five, it's a strong enough bare breakout to reset the leg count to some degree. This is likely to get a second leg down. And then six, a smaller follow-through bar. So, that one reached that measured move target. It's much smaller follow-through bar. It's a warning that there may be a pullback soon. We're breaking below the prior days low. And the expectation, it's a trading range day, trading range bar, daily expectation breakout will fail. We'll find buyers below yesterday's low. So, we're going to speed it up a bit. Bar seven, pretty decent bull breakout bar. Enough for a second leg sideways to up, but probably a minor reversal. Second leg down still likely. The low one fails, bulls get a second leg to the breakout point that I mentioned on bar four. But the problem with bar 10, possible second leg trap for the bulls. One pullback, two testing resistance, second leg down, still likely, and the bears have not had it yet. But seven and 10, both strong bull bars. And it's a warning for the bears that the downside might be limited. that remember the higher time frame chart suggests we're at support and the downside might be limited which means this might not be a bare trend that lasts all day. It might actually end up being a reversal in this area and there's sufficient buying pressure on both seven and 10. There's enough evidence that buyers are here that the downside might be limited. So, possible second leg trap, but 10 enough of a breakout to trap traders below. So, rather than buying here, traders will buy a pullback and the downside, like I said, might be limited. Market testing the low. As far as measured move targets, most conservative one could take bars five and six. Breakout follow through from that trading range bar. So breakout, pullback, second leg, and that's a second leg measure move it looks like on bar 13 or very close to it. So, it's possible it's leg one, leg two, leg three. And this looks like a trading range with the strength of these bull bars. And we'll see trend resumption at the new low. Inside bar, another inside bar. So, it looks like an II pattern, possible final flag. It's a tight trading range. And after three legs, far below the EMA, it's a warning we may pull back here. And seven and 10. Bars seven and 10 are also a warning. Like I said, the downside might be limited. There might be buyers at the new low rather than sellers. And this all could be a trading range. So where this area is the bottom of the range and this could be the top of the range. Breakout bar 16 1516. The structure is good and the signal is strong enough for a second leg. 16 probably by the close. 15 was probably an always in flipping bar, meaning you had three legs down to bar 15. Bull bar closing on its high and probably a trading range at this point. So buying back shorts above 15 is reasonable. Buying to go long above 15 is a little aggressive but still reasonable. Or you could wait for the breakout bar 16 increases your probability. Risk-reward gets worse, but you do get probability and now you have a call it a reversal and follow through. Or even just a one bar breakout 15 16 second leg up likely to buy the close scale in second leg likely shallow pullback. Bulls get a second leg. 19, a possible measuring gap. Testing resistance to close of bar 10. We'll see what the bears can get. But this is strong enough rally that the first reversal is probably going to be minor, which means you can buy the close and if you use a wide stop and scale in, you're probably going to make money. And 80% of the time, you'll either make money or avoid a loss. So further breaking out on bar 20. Bar 20 is probably by the close. Bar 21 probably by the close. You just have to be aware of the resistance to the left. It's possible. It's a buy climax testing resistance. So if there's any hesitation, better to just get out and wait. But obviously really strong rally 15 to 21. Second leg up likely. Couple of smaller bars, 22, 23. So, it's kind of like down here when you're far below the moving average, you get these smaller overlapping bars. It's a warning. We might pull back to the average. And up here, strong rally, but now we're far above the moving average. It's basically on a smaller time frame, you would see a channel and it's three pushes up, far above EMA, and at resistance. So, pullback may be increasingly likely here for the bulls. not ideal for buying because the stop in theory is so far. So what traders will do instead because buying here second leg up likely yes but your stop in theory is below 15 that's really far that's big risk so instead of buying here traders will wait to buy a pullback and if we think about day structure at this point it's possible it's an expanding triangle you have a low high lower low higher high maybe we come back down and test the lows but at a minimum we'll probably some sort of pullback after this rally because it looks like it's a trading room day. The bars are going big up, big down, big up. Now we're back at resistance. Bar 24, bare breakout bar at resistance. Strong enough bar for a second leg down. probably always in short below 24. Despite all of this buying pressure, despite the micro channel, 24 isn't always flipping bar. Meaning, if you're long, it's reasonable to exit longs below 24. And if you're flat, you can sell 24, scale in, and very likely you'll make money or avoid a loss. It's still probably a minor reversal. If you're selling 24, you're not expecting a big bare trend. You're expecting a scalp and a second leg of similar size. Just try to speed it up a bit here. So, it looks like the bare breakout had a two-legged pullback. This is a very good example of the fractal two-legged n nature of price action. Bare breakout, two-legged pullback, second leg. So, two legs through here. one pull back, two and even 27 and 28 is two legs down, one pullback, two. So the bears have two legs down. They're testing support, but this is a fairly tight bare channel. It's actually a micro channel. So 35 not ideal for buying. I think it's okay to maybe start buying and scale in, but it's also reasonable to look for another leg down after this micro channel. So this is one of those instances where you can buy, manage the trade and make money or sell, manage the trade and make money. 36 reversal and follow through, strong breakout bar, reasonable buy, but also like I said, tight bare channel, micro channel through here. So may need one more leg down. Now we're testing resistance again. this tight trading range, the high of that tight trading range is resistance. We find sellers in that area again. Now, what about bar 39? It's really like the ideal breakout bar. It's a perfect breakout bar for the bears. Opens on its high, closes on its low. Very little overlap with the prior bar. So, what's the problem with it? Problem is context. You have a bare channel line that it's testing trying to break below. So, it's leg three, one, two, three legs down and it's testing support. It's testing this breakout point, this breakout point, these breakout points. There's a cluster of support in this area. So, you have three legs down to support after a strong rally that is still likely to get a second leg. And the question is, has the rally gotten a symmetrical second leg? No, of course not. There's no rally similar in size to this. This is all minor. This is a minor reversal. You can call it a bull flag. You can call it a pullback, but the bulls have not had their second leg yet. So, bull breakout, pullback, second leg still likely. So, this is not an ideal place to be selling. actually possibly a great opportunity to take profits on shorts because it's leg and a breakout bar testing support reversal bar 40s the breakout gets a small second leg still trying to break below support then we got bar 42 so after three legs down to support bar 42 it's a strong bull breakout context is good and we may need a big second leg up after that rally. So buying 42 is reasonable. It's an always in flipping bar. So if you you know context probably buy the close 39, be quick to get out if you're selling, but if you want to wait for the price action signal, bar 42 is that signal. So you can buy above 42. If you're short, definitely should consider exiting shorts above 42. Bar 42 gets a a breakout pullback. And this is basically a wedge double bottom. On a smaller time frame, you'd see one, two, three, three or four pushes down to support. Second leg up likely bar 42, but also second leg up likely micro channel. And then there's your give up bar. The bears going for four legs down. They give up and you get this big breakout bar 47, second leg up likely. So the market is building the bigger picture. You have this big breakout complex pullback with about 20 bars and then possible assumption here for the bulls. Minimum target probably the high but of course the bulls would also go for a measured move leg one pull back leg two. That takes us to the prior days high. So bulls getting follow through buying. It's a micro channel. Nothing to sell. Always in long. Okay to be long. Would you sell 51? No. Minor reversal likely. You can buy below 51. You can buy at the close buy below any of these bars. 54. Minor reversal likely. Buy the close buy below. Now we're getting to some resistance maybe in this area trading range bare breakout below. So that support became resistance. You have this channel line. The market seems to have obeyed a couple of times. So now we're getting a tight trading range far above the moving average. Maybe three big legs up on a trading range day. So buying here less ideal. Still nothing to sell, but you just have to be careful. This might be this tight trading range might be a final flag before a deeper pullback and maybe a conversion into a trading range. So 59 might be a big or excuse me, a small leg one pullback, leg two, second leg trap at the top of the trading range. Then it's instantly sold. 60 probably okay to exit longs below 60. Tight trading range. Bear bar closing near its low. Might correct and test breakout points like the bar 23 high. Just want to clean up the chart a bit. Keep that one. Okay. Bar 61. Another bar like 59. Now we have three legs up. One pause, two pullback, three. So, three legs up two resistance. It's nested. One, two, three. So, 61 kind of like 59. Maybe a better sell the closed bar. Good bar to take profits if you're long and aggressive, but it's a limit order to short for the bears at the top of the tight trading range and a late leg. Yes, bad follow-through. But similar to down here, bare breakout bar in a late leg, bad context for selling, gets a small second leg, then reverses. Bull breakout bar, bad context for buying. There's a pause, small second leg, and then reversal. Bare breakout 64. Bigger bare breakout 65. 64. Always in flipping bar kind of like 60. Reasonable to exit below 64. Sell the close 65. Sell the close 66. Second leg down likely. So if a second leg down is likely and it's sell to close then selling above 66 is reasonable minor reversal likely. So traders will sell above 66. And you can see that's what happened on bar 67. What about buying 69? Probably a minor reversal. The tight the bare channel is tight. the signal bar is small and this means you have low probability. You've heard Al talk about it in the trading course. Traders will constantly take trades like this where the signal bar looks great. It's a bull reversal bar closing on its high. The risk is small. The reward, the potential reward is huge, maybe five times your risk. But the trader's equation is made of three variables. risk, reward, and probability. So, you know, because someone has to take the opposite side of your trade. There's no such thing as a perfect trade. So, if a trade is too good to be true, for example, small risk, huge reward, then you know you're giving up probability. You know, the other side has the higher probability. So 69 it can be a tempting bar to buy because it looks good and the you know maybe it's a trading range. Maybe there's maybe it's an expanding triangle. There's an argument to be made but it also might be worth it to wait for the strong bull breakout and then maybe then you take the buy. But 69 low probability buy tight bare channel second leg down likely. So lower prices likely and then it just goes outside down 70 as we get later in the day. Not really worth trading. Um but the price action remains consistent tight air channel. Second leg down still likely 72 probably sellers above still tight air channel. Sellers above bars 75. Little bit of a surprise but minor reversal more likely strong enough bar. It'll probably get a second leg sideways to up, but we'll also probably test the lows before we go much higher. So, minor reversal here. Traders will take 75. You know, it's a big bull bar, but completely below the moving average following the tight air channel. Second leg down likely. So, 75 might be a better sell the close bar. Test of the lows. Bulls still may get a better second leg sideways 12 up although they probably got their minimum second leg there and then maybe 78 is their second leg sideways and then just running out of time later in the day tight trading range we got a bull breakout 81 but testing that area the bar 69 trap trapping bulls into buying and losing money that creates resistance. So second leg down still likely possible. You call it a wedge bare flag. You call it a double top bare flag. Probably sellers in this area. And this is probably a trading range or a bare flag like one pullback leg two. All right, that's going to be it for today's end of day review. Thanks again for joining me for today's video and I hope everybody has a good night.
Download Subtitles
These subtitles were extracted using the Free YouTube Subtitle Downloader by LunaNotes.
Download more subtitlesRelated Videos
Download Subtitles for Emini Review - Feb 05, 2026 Analysis
Enhance your understanding of the Emini Review by downloading accurate subtitles for the February 5, 2026 session with Joseph Imbornone. Captions help you follow detailed market insights and trading strategies with ease, improving accessibility and retention.
Download Subtitles for Emini Review - Feb 04, 2026
Access accurate subtitles for the Emini Review video dated Wednesday, February 4, 2026, featuring Joseph Imbornone. Enhance your understanding of market insights and trade analysis with clear captions that improve accessibility and learning.

Download Subtitles for 'After Years of Investing' Video 2026
Get accurate and easy-to-follow subtitles for the video 'After Years of Investing, This Is All I’m Buying in 2026.' Enhance your understanding of investment strategies discussed and never miss key insights by downloading captions.

Download Subtitles for EMA-Stochastic Head & Shoulders Trading Video
Enhance your understanding of the EMA-Stochastic Head & Shoulders trading strategy by downloading accurate subtitles for this video. Captions help you follow each step clearly, ensuring you don’t miss any critical details to boost your trading success.

Download Subtitles for Stock Market Surge Insights Video
Access accurate subtitles for the video discussing major stock price surges and the best timing to sell. Downloading these captions helps you fully understand the expert secret indicators shared for profitable trading strategies.
Most Viewed

Untertitel für 'Nicos Weg' Deutsch lernen A1 Film herunterladen
Laden Sie die Untertitel für den gesamten Film 'Nicos Weg' herunter, um Ihr Deutschlernen auf A1 Niveau zu unterstützen. Untertitel helfen Ihnen, Wortschatz und Aussprache besser zu verstehen und verbessern das Hörverständnis effektiv.

ดาวน์โหลดซับไตเติ้ล DMD LAND 3 The Final Land Day 1
ดาวน์โหลดซับไตเติ้ลสำหรับวิดีโอ DMD LAND 3 The Final Land Day 1 เพื่อช่วยให้เข้าใจเนื้อหาได้ง่ายขึ้น และเพิ่มความสะดวกในการติดตามทุกช่วงเวลา เหมาะสำหรับผู้ชมที่ต้องการความชัดเจนและเข้าถึงข้อมูลอย่างครบถ้วน

Descarga Subtítulos para NARCISISMO | 6 DE COPAS - Episodio 63
Accede fácilmente a los subtítulos del episodio 63 de '6 DE COPAS', centrado en el narcisismo. Descargar estos subtítulos te ayudará a entender mejor el contenido y mejorar la experiencia de visualización.

Subtítulos para TIPOS DE APEGO | 6 DE COPAS Episodio 56
Descarga los subtítulos para el episodio 56 de la tercera temporada de 6 DE COPAS, centrado en los tipos de apego. Mejora tu comprensión y disfruta del contenido en detalle con nuestros subtítulos precisos y accesibles.

Download Subtitles for Your Favorite Videos Easily
Enhance your video watching experience by downloading accurate subtitles and captions. Enjoy better understanding, accessibility, and language support for all your favorite videos.

If you found these subtitles useful, consider buying us a coffee. It would help us a lot!