Download Subtitles for Emini Review - Feb 04, 2026
Emini Review - Wednesday, February 04, 2026 - Joseph Imbornone
Joseph Imbornone
SRT - Most compatible format for video players (VLC, media players, video editors)
VTT - Web Video Text Tracks for HTML5 video and browsers
TXT - Plain text with timestamps for easy reading and editing
Scroll to view all subtitles
Hey everybody,
I hope everyone is doing well and had a
good day.
Thank you for joining me for today's end
of day review of the E- Mini 5m minute
chart for Wednesday, February 4th, 2026.
Here's
the context going into the day.
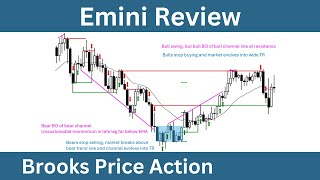
We have this very tight bare channel.
Small pullback trending behavior
pullbacks all through here. Very shallow
lasting one to three bars and bulls not
really getting any traction through
here. And we finally got this minor
reversal. Is 57 going to reverse the
market in a major way? In other words,
what's the probability the market goes
from a small pullback bare trend into a
strong bull spike and small pullback
bull trend.
The reality is that it's really unlikely
for there to be a major trend reversal
into an opposite bull trend without
their first being a test of the bare
trends extreme, which is this blue line,
yesterday's low. It's a strong enough
minor reversal that it's going to get a
second leg. And it did. And the second
leg was strong enough for a second leg
as well. But at some point the market's
going to find resistance. That might be
somewhere around here. Market found
support here several times. Tight
trading range. This was an area of
interest. It's a magnet. So the market
may have to get back here. But the
question is what will it do then?
If it's unlikely that the bare trend
converts directly into a bull trend,
then the more probable outcome is it
converts into a wide trading range. So
maybe we find resistance up here. This
becomes the top of the range and then
maybe the bottom of the range is all the
way down here at yesterday's low. So on
the open we already have three maybe
four legs up to resistance and then on
the smaller time frame bars two three
and four there's three pushes up bull
breakout too
relatively deep pullback on bar three
but break out to a new high pull back
and a third breakout to a new high so on
smaller time frame that's three pushes
up in a
it's a channel basically ally a trading
range that is sloped. So down here on
the smaller time frames, traders are
buying low and selling high. But then
look to the left, we're at this
resistance area
after three or four legs up. So for
there to be a reversal here or at least
a correction would not be surprising.
But it's not until we get the breakout
that the probability increases for the
bears. Before the breakout, the bears
have good riskreward, but where's the
bare breakout to capture the second leg
of doesn't really exist. There has not
been a meaningful trend line break
through here, right? It's a tight bull
channel.
There's your trend line and there's your
trend line break. So, a bare breakout
with follow-th through strong three bar
micro channel, four bar micro channel.
Certainly a strong enough bare breakout
for a second leg. But
what I was talking about back here, so
let's break it down again. Small
pullback trend, bare trend line. Bulls
break the trend line, but it's unlikely
we get a major trend reversal before
their test of the bare trends extreme.
So the way a you know if you study the
Brooks trading course and you see the
sections on major trend reversals, you
need the ingredients for a major
reversal. You need a trend line break, a
retest of the lows and then you might
get a major reversal. But even then only
about 40% of major trend reversals
become strong opposite trends. Most of
the time the market converts into a
trading range.
So the same is true over here. This is a
decent bull swing.
You can call it a bull trend. You can
call it a spike, pullback, tight
channel, bull trend. I'm calling it a
swing because
that's just kind of the terminology that
Al would use.
You can call it, you know, price action
is fractal. So sure if you look at the
one minute chart then from bar 57 to bar
4 today certainly it's a bull trend but
on this time frame the five minute chart
we can see it's a more bearish regime
more bare bars and
bigger distance moved by the bears and
even this you can call it a bare swing
because then there's a bull swing.
This you can call it a bare trend.
But once you get this opposite swing,
stop [clears throat] order traders can
make two, three, four, five times their
risk, then you can start calling it a
swing.
So the bulls have a swing, but they're
testing resistance. And if they're going
to get a major reversal, we still need a
test of these lows. But the same thing
is happening on the smaller time frame
here. Bull swing. So, bull trend line
trend line break, but we still need a
pullback. The expectation is we're going
to get a pullback and test of the bull
swings extreme, bull trend, bull swing,
it doesn't matter what you call it. What
really matters is the expected response
from the market. the market behavior.
Bull breakout, tight channel breakout on
a higher time frame, trend line break,
expectation is a test of the extreme and
then maybe a major reversal. But either
way, this bare breakout is likely to get
a second leg down.
Problem with bar 8 for the bears. Bar 8
is a strong enough bull bar for a second
leg.
So the first attempt to resume done will
probably find buyers. The traders who
sold the close six, sold the close
seven, disappointed with bar eight. So
they use any shallow pullback they can
get to exit. They're looking to sell
higher. The bulls who bought, they're
looking to capture a second leg of bar
eight,
which there's your shallow pullback and
second leg. So the bulls get there.
Leg one equals leg two. measured move
testing resistance
bull swing trend line break two-legged
retest expectation is sellers up here
and then a strong reversal and follow
through bar 13 now the problem with 13
that I have it's strong enough for a
second leg I still think the bears this
breakout down to bar seven needs a
second leg but these two legs up were
fairly tight this was a really shallow
pullback and on a smaller time frame
you wouldn't have seen pullback. It
would simply be a pretty decent bull
breakout bar. So, my hesitation with
selling on 13 is that might be a 50%
pullback of the rally. It's about a 50%
pullback of the rally. This rally is
probably going to get at least some
hesitation, meaning at least a small
second leg. The hesitation being that
bears may not just step in and sell the
close here because they're testing
support
bull breakout the breakout point. We may
have to pull back here but ultimately I
think the upside is limited and I think
the bears need a better second leg down
from this breakout than they've gotten
so far on 12 and 13.
Another couple of legs up for the bulls.
Bar 14 rallied so it went up down 15
went up down now it's two legs testing
resistance but a tight trading range so
it might be better to wait for the
breakout
16 a lot of overlap not ideal for
selling probably sellers above
trading range bars tight trading range
continuing wait for the breakout and we
get the breakout on bar 19
bulls can argue view. Three legs down,
double bottom.
Bears, they see a bare breakout
of a tight trading range. Second leg
down likely. So, it's still close and
scale in with follow-through. So,
breakout with follow through. Good for
the bears, but testing a support area.
So, we may have to bounce here. But this
is a tight bare channel. The bulls
already got breakout second leg the
higher rally breakout disappointing
pullback right it pulled back probably
close to 75%
and then an attempt at a second leg
which
not quite symmetrical maybe they got 7R
758
something like that pretty decent second
leg enough for trapped bulls to use 14
and 15 to exit losing positions. Now the
bulls might be uninterested in buying
until there's evidence that strong bulls
are buying again. They need to see
strong buying pressure through here. We
don't have it. So tight bear channel,
micro channel 18, 1920 second leg down
likely and still test of yesterday's low
likely.
So finding some support at 21, but
probably minor. 21 really needs a decent
follow-through bar and doesn't get it
low one short but at the bottom of a
trading range support here
probably buyers below 21 for at least
temporarily for a scalp but ultimately I
think it's always in short
23 a decent reversal bar and actually
a reasonable buy 23 24 follow-through
bar. So, a reasonable buy setup. Three
legs down. I said wedge double bottom
reversal and follow through. One problem
the bulls have 24 is a lot smaller than
23. So, if there's truly strong
momentum, then why is bar 24 so much
smaller than bar 23?
23 also heavily overlapping the prior
bars. It's not really breaking out of
anything. Although it is reversing after
three legs down, the bulls do have that
going for them. But then 24 testing that
breakout point from earlier from bar 19.
So the bulls may need one more bar here
and then they don't get it 25. So still
always in short if you exited, if you
bought reasonable to sell below bar 25
because second leg down is still likely
tight bare channel.
pull back. Expect a second leg. And then
you can see the second leg measured move
target was reached. And there's a
reaction reversal follow through 2930.
Strong enough for a second leg up.
But this bare breakout is also strong.
The odds are it'll get a second leg
down.
So both sides need a second leg.
Probably better to wait for a second
entry short based on the strength of 29
and 30.
But then testing breakout points.
Bulls losing momentum. 50% pullback of
the selloff.
Bears they can sell below 32. 33 high
one but at resistance after a bare
breakout that needs a second leg. Bulls
are expected to get two legs. One
pullback two above 33 likely.
And then you can sell below 34. Follow
through 35. You can sell. Still
expecting a more symmetrical second leg
down.
36 sell vacuum testing that support that
measured move target. Now we finally got
back to yesterday's low. We saw a minor
reversal on 37 but not enough to
completely reverse the market.
Yeah, you can call it a wedge several
weeks down. But until the bulls
accumulate enough buying pressure, you
have to assume that the bears are going
to sell every time we test the trend
line.
But we are testing a general line. Let's
draw that.
So 36 37 buy zone of the channel. And
the expectation for a bare channel is
that it's going to
evolve into a trading range and get a
bull breakout.
The expectation is not
most of the time bare let me rephrase
that. Most of the time bare channels do
not break below the channel line down
here. Break below it and then become an
even stronger bare trend. Most of the
time the market goes sideways or up
breaking the bare trend line and the
channel becomes several legs down in an
overall trading range. So it's more
likely we test the start of the channel
somewhere up here
than falling for a measured move. The
bulls do have some buying pressure along
the way. Decent bar 811
reversal follow through 2324 that
trapped traders that's an area of
interest that's an area of resistance
and then 2930 also pretty decent bars
but still second leg down likely after
34 through 36
reversal bar 39 after several legs down
four or five legs down reasonable to
exit shorts above 39 and wait because
you may get a correction and the market
can easily test the trend line after
attempting to break below the channel
line. So if you're short, reasonable to
buy back shorts above 39. If you're
flat, it's aggressive, but some bulls
will buy above 39 getting a great
riskreward ratio. But the only way they
can get great riskreward is if they have
low probability. So bar 39 maybe a 30 or
40% buy setup.
Same with bar 41
reversal follow through but a much
smaller bar.
But you can see the hesitation. We're
going sideways after breaking below
yesterday's low. The question is are
there more buyers or sellers below
yesterday's low? You see the daily chart
on the left here. big tail at the bottom
of yesterday's daily chart bar because
of this rally into the close, the trend
line break. So, it's going to limit the
downside. This was a really decent trend
line break by the bulls
and the market may be in a wide trading
range now and it's trying to break below
it.
Bears unable to get big consecutive
breakout bars with little overlap. 44. A
decent bar, but an outside bar. It's
breaking above and below the prior bar.
It's a tight trading range. Buy low,
sell high. So, tight trading range
through here.
Bulls finally getting a breakout at 48.
Trapping traders below this green box.
It's a tight trading range and area of
agreement.
traders are buying low, selling high,
buy low, sell high. If you sold here,
you got trapped on bar 48, trapped into
a losing position. So remember,
expectation sellers at the trend line,
but breakout follow through 4748
probably will pull back and get a second
leg because of the trap traders in the
tight trading range. drew a horizontal
line here and it's just a best fit line.
Some area
of resistance here is likely to become
support because of the breakout on 48.
So maybe that's it. Maybe it's the close
of 47. Maybe it's here. Probably support
in this area. So expectation is buyers
below 48. fires on the close of 49.
Second leg up likely, but 49 strong
enough bear bar for at least some
hesitation. A small second leg down.
That may be all the bears get. Leg one,
deep pullback. Leg two. Bulls still need
their second leg.
Bulls getting their second leg.
Finding support. Like I said here, the
breakout point 48. Test. Found buyers.
Test again. Found buyers again. Is 54 a
good sell? Low one, low two, low three.
It's a reversal bar, closing below its
midpoint. Good for the bears,
but the selling pressure through here
could be stronger. 49's a decent bar. I
said it probably needs a second leg, but
it already got its second leg.
So, it got a symmetrical second leg. Leg
one, pull back, leg two. Bears got their
minimum. bulls. Maybe they need a
measured move up based on their breakout
and follow-through. 4748
reversal follow-through 55. It's an okay
sell.
The problem is that this tight trading
range may have been a small triangle and
final flag for the bare channel and 4748
has flipped the always in direction to
long. So, it's still always in long
here. So if you do sell, you have to
exit above 56. And if you're flat, you
can buy above 56. Expecting
a second leg up.
Bear bulls getting there. Second leg.
Tight bull channel. Second leg up here
likely. Remember 2324 reasonable buy
setup. Failed to get even its minimum.
Second leg. The 24 close is a test
target. So this might be a measuring gap
with targets above. So 60 61 are
reasonable to buy.
Nothing to sell. Climactic bar 64.
We've already got one, two, three, maybe
four legs up.
There's an established bull channel line
and 64 is breaking above it and testing
that resistance.
Another bar with a big tail 65. Then an
inside bar 66. So late leg top of a
trading range testing resistance. And
then here kind of similar to bars 2,
three, and four. Up, down, up, down, up.
So that's three pushes up on the smaller
time frame. 66 an inside bar. So not
breaking out of the prior bar. It's a
trading range bar. might be a buy vacuum
test of resistance
on the smaller time frame and on the
five minute chart. This is happening
across different time frames. So 66 not
ideal for buying based on the context
late leg at resistance and the smaller
structure suggesting a correction is
more likely. We're testing an area where
the bulls who bought got trapped and
lost money. So, are the bulls really
going to be eager to buy here? Even
though it looks like they have decent
momentum, there's
hints in the price action that this may
correct. One, two, three pushes up.
Breaking above a channel line correction
more likely than more to the upside.
But tight bull channel need a trend line
break first.
69 breaking the trend line. Good for the
bears, but still probably probably going
to test the top of this bull swing.
Sellers above 69 likely
74.
Now it's two maybe three legs up.
Testing resistance not great for buying
tight trading range. 75 a reasonable bar
to sell. Context support's always in
short. If you're long, you can exit
below 75 76 kind of like 73 74. Now it's
more clearly three legs up. Testing
resistance 76. They sell the close bar.
Bare surprise 77 bare breakout. Second
leg down likely, but pullback also
likely. Testing support here.
Breakout point. Bar 62 high here. So
bare breakout, pullback likely. But
second leg down also likely bears get
follow through. They get their second
leg
breakout.
Breakout follow through pullback
symmetrical second leg and then profit
taking reaction on bar 80 reversal after
two legs down to support
breakout point
and then out of time late in the day.
All right, that's going to be it for
today's end of day review.
As always, thanks for watching. And to
go deeper into price action and to learn
more, you can check out all of the
resources in the description of my
videos. All right, thanks again for
watching and I hope everyone has a great
night.
Full transcript without timestamps
Hey everybody, I hope everyone is doing well and had a good day. Thank you for joining me for today's end of day review of the E- Mini 5m minute chart for Wednesday, February 4th, 2026. Here's the context going into the day. We have this very tight bare channel. Small pullback trending behavior pullbacks all through here. Very shallow lasting one to three bars and bulls not really getting any traction through here. And we finally got this minor reversal. Is 57 going to reverse the market in a major way? In other words, what's the probability the market goes from a small pullback bare trend into a strong bull spike and small pullback bull trend. The reality is that it's really unlikely for there to be a major trend reversal into an opposite bull trend without their first being a test of the bare trends extreme, which is this blue line, yesterday's low. It's a strong enough minor reversal that it's going to get a second leg. And it did. And the second leg was strong enough for a second leg as well. But at some point the market's going to find resistance. That might be somewhere around here. Market found support here several times. Tight trading range. This was an area of interest. It's a magnet. So the market may have to get back here. But the question is what will it do then? If it's unlikely that the bare trend converts directly into a bull trend, then the more probable outcome is it converts into a wide trading range. So maybe we find resistance up here. This becomes the top of the range and then maybe the bottom of the range is all the way down here at yesterday's low. So on the open we already have three maybe four legs up to resistance and then on the smaller time frame bars two three and four there's three pushes up bull breakout too relatively deep pullback on bar three but break out to a new high pull back and a third breakout to a new high so on smaller time frame that's three pushes up in a it's a channel basically ally a trading range that is sloped. So down here on the smaller time frames, traders are buying low and selling high. But then look to the left, we're at this resistance area after three or four legs up. So for there to be a reversal here or at least a correction would not be surprising. But it's not until we get the breakout that the probability increases for the bears. Before the breakout, the bears have good riskreward, but where's the bare breakout to capture the second leg of doesn't really exist. There has not been a meaningful trend line break through here, right? It's a tight bull channel. There's your trend line and there's your trend line break. So, a bare breakout with follow-th through strong three bar micro channel, four bar micro channel. Certainly a strong enough bare breakout for a second leg. But what I was talking about back here, so let's break it down again. Small pullback trend, bare trend line. Bulls break the trend line, but it's unlikely we get a major trend reversal before their test of the bare trends extreme. So the way a you know if you study the Brooks trading course and you see the sections on major trend reversals, you need the ingredients for a major reversal. You need a trend line break, a retest of the lows and then you might get a major reversal. But even then only about 40% of major trend reversals become strong opposite trends. Most of the time the market converts into a trading range. So the same is true over here. This is a decent bull swing. You can call it a bull trend. You can call it a spike, pullback, tight channel, bull trend. I'm calling it a swing because that's just kind of the terminology that Al would use. You can call it, you know, price action is fractal. So sure if you look at the one minute chart then from bar 57 to bar 4 today certainly it's a bull trend but on this time frame the five minute chart we can see it's a more bearish regime more bare bars and bigger distance moved by the bears and even this you can call it a bare swing because then there's a bull swing. This you can call it a bare trend. But once you get this opposite swing, stop [clears throat] order traders can make two, three, four, five times their risk, then you can start calling it a swing. So the bulls have a swing, but they're testing resistance. And if they're going to get a major reversal, we still need a test of these lows. But the same thing is happening on the smaller time frame here. Bull swing. So, bull trend line trend line break, but we still need a pullback. The expectation is we're going to get a pullback and test of the bull swings extreme, bull trend, bull swing, it doesn't matter what you call it. What really matters is the expected response from the market. the market behavior. Bull breakout, tight channel breakout on a higher time frame, trend line break, expectation is a test of the extreme and then maybe a major reversal. But either way, this bare breakout is likely to get a second leg down. Problem with bar 8 for the bears. Bar 8 is a strong enough bull bar for a second leg. So the first attempt to resume done will probably find buyers. The traders who sold the close six, sold the close seven, disappointed with bar eight. So they use any shallow pullback they can get to exit. They're looking to sell higher. The bulls who bought, they're looking to capture a second leg of bar eight, which there's your shallow pullback and second leg. So the bulls get there. Leg one equals leg two. measured move testing resistance bull swing trend line break two-legged retest expectation is sellers up here and then a strong reversal and follow through bar 13 now the problem with 13 that I have it's strong enough for a second leg I still think the bears this breakout down to bar seven needs a second leg but these two legs up were fairly tight this was a really shallow pullback and on a smaller time frame you wouldn't have seen pullback. It would simply be a pretty decent bull breakout bar. So, my hesitation with selling on 13 is that might be a 50% pullback of the rally. It's about a 50% pullback of the rally. This rally is probably going to get at least some hesitation, meaning at least a small second leg. The hesitation being that bears may not just step in and sell the close here because they're testing support bull breakout the breakout point. We may have to pull back here but ultimately I think the upside is limited and I think the bears need a better second leg down from this breakout than they've gotten so far on 12 and 13. Another couple of legs up for the bulls. Bar 14 rallied so it went up down 15 went up down now it's two legs testing resistance but a tight trading range so it might be better to wait for the breakout 16 a lot of overlap not ideal for selling probably sellers above trading range bars tight trading range continuing wait for the breakout and we get the breakout on bar 19 bulls can argue view. Three legs down, double bottom. Bears, they see a bare breakout of a tight trading range. Second leg down likely. So, it's still close and scale in with follow-through. So, breakout with follow through. Good for the bears, but testing a support area. So, we may have to bounce here. But this is a tight bare channel. The bulls already got breakout second leg the higher rally breakout disappointing pullback right it pulled back probably close to 75% and then an attempt at a second leg which not quite symmetrical maybe they got 7R 758 something like that pretty decent second leg enough for trapped bulls to use 14 and 15 to exit losing positions. Now the bulls might be uninterested in buying until there's evidence that strong bulls are buying again. They need to see strong buying pressure through here. We don't have it. So tight bear channel, micro channel 18, 1920 second leg down likely and still test of yesterday's low likely. So finding some support at 21, but probably minor. 21 really needs a decent follow-through bar and doesn't get it low one short but at the bottom of a trading range support here probably buyers below 21 for at least temporarily for a scalp but ultimately I think it's always in short 23 a decent reversal bar and actually a reasonable buy 23 24 follow-through bar. So, a reasonable buy setup. Three legs down. I said wedge double bottom reversal and follow through. One problem the bulls have 24 is a lot smaller than 23. So, if there's truly strong momentum, then why is bar 24 so much smaller than bar 23? 23 also heavily overlapping the prior bars. It's not really breaking out of anything. Although it is reversing after three legs down, the bulls do have that going for them. But then 24 testing that breakout point from earlier from bar 19. So the bulls may need one more bar here and then they don't get it 25. So still always in short if you exited, if you bought reasonable to sell below bar 25 because second leg down is still likely tight bare channel. pull back. Expect a second leg. And then you can see the second leg measured move target was reached. And there's a reaction reversal follow through 2930. Strong enough for a second leg up. But this bare breakout is also strong. The odds are it'll get a second leg down. So both sides need a second leg. Probably better to wait for a second entry short based on the strength of 29 and 30. But then testing breakout points. Bulls losing momentum. 50% pullback of the selloff. Bears they can sell below 32. 33 high one but at resistance after a bare breakout that needs a second leg. Bulls are expected to get two legs. One pullback two above 33 likely. And then you can sell below 34. Follow through 35. You can sell. Still expecting a more symmetrical second leg down. 36 sell vacuum testing that support that measured move target. Now we finally got back to yesterday's low. We saw a minor reversal on 37 but not enough to completely reverse the market. Yeah, you can call it a wedge several weeks down. But until the bulls accumulate enough buying pressure, you have to assume that the bears are going to sell every time we test the trend line. But we are testing a general line. Let's draw that. So 36 37 buy zone of the channel. And the expectation for a bare channel is that it's going to evolve into a trading range and get a bull breakout. The expectation is not most of the time bare let me rephrase that. Most of the time bare channels do not break below the channel line down here. Break below it and then become an even stronger bare trend. Most of the time the market goes sideways or up breaking the bare trend line and the channel becomes several legs down in an overall trading range. So it's more likely we test the start of the channel somewhere up here than falling for a measured move. The bulls do have some buying pressure along the way. Decent bar 811 reversal follow through 2324 that trapped traders that's an area of interest that's an area of resistance and then 2930 also pretty decent bars but still second leg down likely after 34 through 36 reversal bar 39 after several legs down four or five legs down reasonable to exit shorts above 39 and wait because you may get a correction and the market can easily test the trend line after attempting to break below the channel line. So if you're short, reasonable to buy back shorts above 39. If you're flat, it's aggressive, but some bulls will buy above 39 getting a great riskreward ratio. But the only way they can get great riskreward is if they have low probability. So bar 39 maybe a 30 or 40% buy setup. Same with bar 41 reversal follow through but a much smaller bar. But you can see the hesitation. We're going sideways after breaking below yesterday's low. The question is are there more buyers or sellers below yesterday's low? You see the daily chart on the left here. big tail at the bottom of yesterday's daily chart bar because of this rally into the close, the trend line break. So, it's going to limit the downside. This was a really decent trend line break by the bulls and the market may be in a wide trading range now and it's trying to break below it. Bears unable to get big consecutive breakout bars with little overlap. 44. A decent bar, but an outside bar. It's breaking above and below the prior bar. It's a tight trading range. Buy low, sell high. So, tight trading range through here. Bulls finally getting a breakout at 48. Trapping traders below this green box. It's a tight trading range and area of agreement. traders are buying low, selling high, buy low, sell high. If you sold here, you got trapped on bar 48, trapped into a losing position. So remember, expectation sellers at the trend line, but breakout follow through 4748 probably will pull back and get a second leg because of the trap traders in the tight trading range. drew a horizontal line here and it's just a best fit line. Some area of resistance here is likely to become support because of the breakout on 48. So maybe that's it. Maybe it's the close of 47. Maybe it's here. Probably support in this area. So expectation is buyers below 48. fires on the close of 49. Second leg up likely, but 49 strong enough bear bar for at least some hesitation. A small second leg down. That may be all the bears get. Leg one, deep pullback. Leg two. Bulls still need their second leg. Bulls getting their second leg. Finding support. Like I said here, the breakout point 48. Test. Found buyers. Test again. Found buyers again. Is 54 a good sell? Low one, low two, low three. It's a reversal bar, closing below its midpoint. Good for the bears, but the selling pressure through here could be stronger. 49's a decent bar. I said it probably needs a second leg, but it already got its second leg. So, it got a symmetrical second leg. Leg one, pull back, leg two. Bears got their minimum. bulls. Maybe they need a measured move up based on their breakout and follow-through. 4748 reversal follow-through 55. It's an okay sell. The problem is that this tight trading range may have been a small triangle and final flag for the bare channel and 4748 has flipped the always in direction to long. So, it's still always in long here. So if you do sell, you have to exit above 56. And if you're flat, you can buy above 56. Expecting a second leg up. Bear bulls getting there. Second leg. Tight bull channel. Second leg up here likely. Remember 2324 reasonable buy setup. Failed to get even its minimum. Second leg. The 24 close is a test target. So this might be a measuring gap with targets above. So 60 61 are reasonable to buy. Nothing to sell. Climactic bar 64. We've already got one, two, three, maybe four legs up. There's an established bull channel line and 64 is breaking above it and testing that resistance. Another bar with a big tail 65. Then an inside bar 66. So late leg top of a trading range testing resistance. And then here kind of similar to bars 2, three, and four. Up, down, up, down, up. So that's three pushes up on the smaller time frame. 66 an inside bar. So not breaking out of the prior bar. It's a trading range bar. might be a buy vacuum test of resistance on the smaller time frame and on the five minute chart. This is happening across different time frames. So 66 not ideal for buying based on the context late leg at resistance and the smaller structure suggesting a correction is more likely. We're testing an area where the bulls who bought got trapped and lost money. So, are the bulls really going to be eager to buy here? Even though it looks like they have decent momentum, there's hints in the price action that this may correct. One, two, three pushes up. Breaking above a channel line correction more likely than more to the upside. But tight bull channel need a trend line break first. 69 breaking the trend line. Good for the bears, but still probably probably going to test the top of this bull swing. Sellers above 69 likely 74. Now it's two maybe three legs up. Testing resistance not great for buying tight trading range. 75 a reasonable bar to sell. Context support's always in short. If you're long, you can exit below 75 76 kind of like 73 74. Now it's more clearly three legs up. Testing resistance 76. They sell the close bar. Bare surprise 77 bare breakout. Second leg down likely, but pullback also likely. Testing support here. Breakout point. Bar 62 high here. So bare breakout, pullback likely. But second leg down also likely bears get follow through. They get their second leg breakout. Breakout follow through pullback symmetrical second leg and then profit taking reaction on bar 80 reversal after two legs down to support breakout point and then out of time late in the day. All right, that's going to be it for today's end of day review. As always, thanks for watching. And to go deeper into price action and to learn more, you can check out all of the resources in the description of my videos. All right, thanks again for watching and I hope everyone has a great night.
Download Subtitles
These subtitles were extracted using the Free YouTube Subtitle Downloader by LunaNotes.
Download more subtitlesRelated Videos
Download Subtitles for Emini Review - Feb 05, 2026 Analysis
Enhance your understanding of the Emini Review by downloading accurate subtitles for the February 5, 2026 session with Joseph Imbornone. Captions help you follow detailed market insights and trading strategies with ease, improving accessibility and retention.
Download Subtitles for Emini Review - Feb 17, 2026 Analysis
Get accurate and easy-to-follow subtitles for Joseph Imbornone's Emini Review on February 17, 2026. Enhance your understanding of market insights by downloading captions for this timely video. Perfect for traders looking to review key points and strategies discussed.

Download Subtitles for 'After Years of Investing' Video 2026
Get accurate and easy-to-follow subtitles for the video 'After Years of Investing, This Is All I’m Buying in 2026.' Enhance your understanding of investment strategies discussed and never miss key insights by downloading captions.

Download Subtitles for EMA-Stochastic Head & Shoulders Trading Video
Enhance your understanding of the EMA-Stochastic Head & Shoulders trading strategy by downloading accurate subtitles for this video. Captions help you follow each step clearly, ensuring you don’t miss any critical details to boost your trading success.

Download Subtitles for Stock Market Surge Insights Video
Access accurate subtitles for the video discussing major stock price surges and the best timing to sell. Downloading these captions helps you fully understand the expert secret indicators shared for profitable trading strategies.
Most Viewed

Untertitel für 'Nicos Weg' Deutsch lernen A1 Film herunterladen
Laden Sie die Untertitel für den gesamten Film 'Nicos Weg' herunter, um Ihr Deutschlernen auf A1 Niveau zu unterstützen. Untertitel helfen Ihnen, Wortschatz und Aussprache besser zu verstehen und verbessern das Hörverständnis effektiv.

ดาวน์โหลดซับไตเติ้ล DMD LAND 3 The Final Land Day 1
ดาวน์โหลดซับไตเติ้ลสำหรับวิดีโอ DMD LAND 3 The Final Land Day 1 เพื่อช่วยให้เข้าใจเนื้อหาได้ง่ายขึ้น และเพิ่มความสะดวกในการติดตามทุกช่วงเวลา เหมาะสำหรับผู้ชมที่ต้องการความชัดเจนและเข้าถึงข้อมูลอย่างครบถ้วน

Descarga Subtítulos para NARCISISMO | 6 DE COPAS - Episodio 63
Accede fácilmente a los subtítulos del episodio 63 de '6 DE COPAS', centrado en el narcisismo. Descargar estos subtítulos te ayudará a entender mejor el contenido y mejorar la experiencia de visualización.

Subtítulos para TIPOS DE APEGO | 6 DE COPAS Episodio 56
Descarga los subtítulos para el episodio 56 de la tercera temporada de 6 DE COPAS, centrado en los tipos de apego. Mejora tu comprensión y disfruta del contenido en detalle con nuestros subtítulos precisos y accesibles.

Download Subtitles for Your Favorite Videos Easily
Enhance your video watching experience by downloading accurate subtitles and captions. Enjoy better understanding, accessibility, and language support for all your favorite videos.

If you found these subtitles useful, consider buying us a coffee. It would help us a lot!