Download Subtitles for Emini Review - Feb 05, 2026 Analysis
Emini Review - Thursday, February 05, 2026 - Joseph Imbornone
Joseph Imbornone
SRT - Most compatible format for video players (VLC, media players, video editors)
VTT - Web Video Text Tracks for HTML5 video and browsers
TXT - Plain text with timestamps for easy reading and editing
Scroll to view all subtitles
Hey everybody,
I hope everyone is doing well and had a
good day.
And thank you for joining me for today's
end of day review of the E- Mini 5
minute chart for Thursday, February 5th,
2026.
And
I'll put the timestamp
in the description of this video when
the review starts. But before we begin
the review of the five-minute chart,
there's a question that I wanted to
answer.
So, somebody commented on one of my
recent videos and they were expressing
their confusion when it comes to
deciding whether to look at the Globex
chart or the regular trading hours
chart, the RTH chart.
And I think it's a good question that's
worth
bringing attention to so that we don't
have confusion with it moving forward.
My initial thought with that question is
that
it's definitely not something we want to
take too much of our attention.
We don't want to give too much of our
attention to it because we can solve it
pretty fairly simply and that's by
understanding that the context carries
over and both charts are going to give
us basically the same picture.
If you think about gaps, why is there a
gap down going into the day?
On the RTH chart,
price closed at 400 p.m. yesterday
here at
6,914
and on the open of the day. So
overnight, the market must have traded
lower. price has fallen
and we opened at 6853 and a half.
So it's more than 50 points that the
market fell in price overnight. And it
doesn't matter whether it's overnight,
you know, it doesn't matter the time
frame. All that matters is that price
was way up here and now price is way
down here.
If we look at the Gloex chart, it's
going to give us the same information.
It's just going to give us more detail.
So, this person is wondering, should I
use the RTH chart or the OEX chart?
[clears throat] The reality is that you
use whichever chart you want to use. I
think it's useful to use the GlobeEx
chart at least in the first hour or so
just because seeing the bars to the left
helps me but especially I mean there's
really an easy way to think about it
which I'll get into no matter what
happens we can see here Globeex chart
clearly a strong bare breakout
covering a lot of bars and a lot of
points bulls really not making money
through this entire sell-off minor
reversal here,
a brief second leg, but this is still a
minor reversal on the open.
And you've heard Al talk about this in
the course in the books. Anyone who's
studied Al knows he talks about how
reversals are common on the open. And
one way that you can kind of take away
that mysterious factor is by looking at
the GlobeEx chart. You have more
information. You can see rally bars one,
two, and three on the open, but
following a steep selloff and testing
resistance. So, three bar micro channel
for the bulls. Yes. But do you really
want to buy at resistance
after this big sell-off? Price may have
to go lower to find strong buyers. I'm
not necessarily convinced that bars one,
two, and three was because of strong
bulls buying.
I think more likely these bars were
produced by strong bears taking profits,
probably at a measured move target.
And that's in part due to all the
overlap and also the tail on bar three.
It's telling me we rallied, pulled back,
rallied, pulled back, rallied a third
time. We're not really breaking out of
all the bars left. So, that's good to
know on the GlobeEx chart, but let's go
back to the RTH chart.
How can we use what we see with the gap
to give us a maybe not as complete
picture as the GloEx chart, but how do
we interpret the gap down? You can
remember that a gap is just a space
between two prices. So, every trend bar
is a gap. Look at bar 77 yesterday.
It's a trend bar, but you can also call
it a gap. There's a space between two
prices. There's a space between the low
of 76 and the high of 78. There's a
space between the close of bar 76 and
the close of bar 77.
Market moved a big distance in a small
amount of time. That traps traders,
creates resistance, and produces second
legs.
The bears had a breakout follow-through,
a pullback, and a second leg. And then
they took profits on that second leg,
which produced bar 80. But this is still
a minor reversal, three bar micro
channel, or excuse me, tight bare
channel. Not a micro channel, but tight
bare channel.
Minor reversal, although it's a deep
pullback, and then gap down. That's a
new bare breakout.
You can measure it from the high of 81
to the open of the day. You can measure
from the close of the prior day, the
close of 81 to the open of the day.
There's always different ways to measure
the breakout.
So the gap down can be seen as a bare
breakout bar. The result,
first of all, we get close to a 50%
pullback
on bar five and then a symmetrical
second leg down. So, yeah, we're missing
some information, but also
there's breakout points along the way
that the market's retesting. Yesterday's
low is a big one, but also all of these
higher lows during the rally
become resistance.
So in short, blowback's chart will give
you more information,
but the RTH chart will tell you the same
information in less detail. You don't
need to see the Globex chart to know
that it's either a bare trend or a bare
channel. Some sort of bare breakout
occurred. You just don't know if it was
a bare breakout followed by a trading
range. You don't know if it's a
consistent tight bare channel. You don't
know if it's a wide trading range. Big
down, big up, big down. But either way,
the general principle remains true that
breakouts get second legs. So if there's
a gap, you're probably going to get a
second leg in the direction of the gap
most of the time within the first 12 or
so bars on the five minute.
One more thing I want to add is that I
mentioned there's kind of a simple way
to deal with that.
I said you can imagine there's bearish
price action based on the gap down. And
the same is true for when there's a
small gap or no gap. Look at this day.
Very small gap up going into the day.
What does that tell us about the GlobeEx
session? Means that it's a trade range.
you don't have to go and check the
GlobeEx chart to tell you that it's a
trading range. And usually when that's
the case, I won't even use the GlobeEx
chart. I'll just look at the five minute
RTH chart. So in this case, when there's
a small or no gap, I'll just continue
trading as if it's a continuous chart
because the price will obey the support
and resistance from the prior day.
Anyway, here's the prior day's high.
So
we can look really quickly
at the end of second.
Here's the close of the day back here.
So here's the glowback session for that
small gap that we can interpret.
or infer that it's a trading range. And
the result is that it's a trading range.
Of course, it's possible that it's an
opposite or it's a reversal. It could
have been a bull trend followed by a
bare trend and the gap looks like price
didn't move, but there's actually
momentum. That's kind of what we see
here.
You know, it was more bearish going into
this day,
but overall, it's a trading range. you
have this decent rally. The market's not
clearly in a bare trend at this point.
It's just that there's this
bigger tight bare channel getting a deep
pullback and then a second leg. But
that's where the first bar of the day
actually reached. So there was support
there. It was not necessarily going to
be this big bare trend. This was a reset
of the market cycle.
So I hope that's helpful.
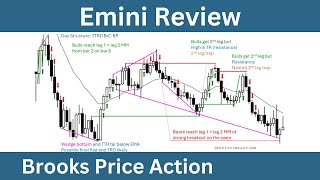
Okay, for the five minute chart today,
we had a gap down going into the day,
which we talked about. And whenever
there's a gap, especially a big gap, the
expectation is a second leg in the
direction of the gap, which means the
rally bars one through four is probably
a minor reversal.
Also the structure bar one rallied,
pulled back, rally, pulled back, rallied
a third time. That's three pushes up.
It's a micro channel for the bulls. So
the downside is probably limited and the
bulls will probably get a second leg,
but it could have been stronger with
less overlap, bigger bull bodies. The
context, like we said, with the gap down
supports a second leg down. So,
increased risk of this being a trading
range open and an opening reversal for
the bulls, especially when bar two, bars
one and two really decent for the bulls.
Even though bar one doesn't have a bull
body, it nearly closed on its high. We
know the second half of this bar
probably had some decent momentum. The
bar sold off and then rallied into the
close. relatively shallow pullback and
then a follow-through bar. So, actually
really decent bars one and two for the
bulls. But because it's big down, big
up, you have to assume that the reversal
is minor and the lows will be tested.
Also, it's nice to know that stat bar
one remains the high or the low of the
day only about once a week. So, about
20% of the time, it's not very likely.
So, the bar one low is a test target.
It's a magnet. Probably are going to go
there before we go much higher. And then
three is a warning that traders are
buying pullbacks and scalping out. Why
does bar three have so much overlap with
the prior bar? And why doesn't it close
on its high? It's an indication that
this is beginning to channel on the
smaller time frame. And because it might
be leg and it's after a gap down,
you have to be careful buying here.
and then an inside bar for indicating
even more momentum stalling for the
bulls. The trader equation is better for
the bears here because the gap down is
likely to get a second leg. Bulls have
now three or four pushes up on the
smaller time frame structure.
I still think bars one through four is
enough buying for a second leg. It's
just that the pullback could be deep.
Like I said, bar one,
the bar one low is a test target and the
market's not going to forget about it.
We may have to come back here before
going much higher.
Outside down bar five, second leg down
likely. We know gap down, second leg
down likely. So, always in short below
bar five.
I don't know if it ever became always in
long. I think it was always in long on
the close of bar two. But then here,
this is disappointing. If you bought
more sideways than up. So, and then
especially when you get bar five, it's
always in short. Probably on the close
of five, certainly below bar five,
always in short.
Reversal and follow through. Strong bare
signal. Second leg down. Likely sell the
close. So, pullback
and then seven getting to that bar one
target.
Three bar micro channel second leg down
likely.
I mentioned the gap down possible leg
one leg two measured move nine reach the
smaller one. Another possible way to
draw it is from the high of 81 the high
of the reversal bar to the close of the
gap down which is actually the open of
the day.
Bar nine just about reaching that as
well.
Not sure if it actually quite got there.
Turned on the snap mode. So bar 10 did
not quite get there. A little reaction,
but 10 more likely a minor reversal
after all these bear bars. Second leg
down likely. Bar 10's a still a close
bar. It might be enough for a small
second leg, but it's still always in
short. And that magnet measured move
target is probably going to be reached.
And it's reached on bar 12. Getting a
small second leg. This is still a micro
channel. So the breakout is growing on
the higher time frame.
Here we can count we actually can count
three legs down. Micro channel
pause in momentum a smaller bar. So
volatility expansion, volatility
contraction, volatility expansion,
pullback. So I'm counting one, pause,
two, pause, three legs down. And in
here, this is three legs on the smaller
time frame. So increases the chance of a
minor reversal. Still always in short,
but you can expect a pullback, which
means it's okay to take profits on
shorts and look to sell higher.
10 or excuse me 14 similar to bar 10.
Maybe it's sell the close. It might be
enough for a small second leg, but it's
still always in short. Bulls haven't
done enough to break a trend line here.
And 15's a weak follow-through bar. So
technically breakout follow-through, but
weak and bad context. Tight bare
channel, micro channel, second leg down
likely. So sell the close 15, sell above
15 because it's always in short in a
strong bare trend. Sell for any reason.
But bigger picture now. One, two,
possible third leg down. Probably
buyers at the new low. Downside may be
limited.
Market going sideways in a tight trading
range. Possible final flag. Good for the
bulls actually because the more the
bulls can go sideways, the more they
break this bare trend line.
and the day structure supports some sort
of trading range day. It's probably not
a bare trend day. Remember the buying on
the open was actually fairly impressive.
Bars one and two. A pretty decent
signal. I don't think traders have
forgotten about that price. Somewhere in
this area, it might be yesterday's low,
might be the close of two. It might be
the breakout point at the low of bar
four. I won't keep all these here, but
my point is that there's a lot of
breakout points and magnets to be tested
in trading ranges. Breakout points and
magnets get tested. And my thought is
that it's probably a trading range day
today.
Big up, big down on the open. Lots of
trading range price action here. And
daily range is already
at this point almost 80 points which
must be around the daily average. I
don't have it off the top of my head but
it's unlikely that we grow a lot more to
the downside which only leaves room for
the upside.
Of course it can be a trend day and it
can the range of the day can double. But
when we here's the daily chart context
and I'm going to do this zoomed out.
You can count three legs down in a bare
channel testing support in a trading
range. So the downside today probably
limited.
So, we'll just use yesterday's low
as a more major test target.
So, the problem with selling here bars
1920,
you have a nested completed structure.
The bears have a breakout bar 16 pulled
back and then it got a second leg.
This entire micro channel down to 14 or
13 is likely to get a second leg, but
there may be a more complex and deeper
correction before that second leg
begins. The smaller structure, the bar 9
breakout, this got a second leg. That
tight bare channel got a second leg.
remember from the bar eight is a smaller
bar than the breakout bars. So I see
that as more of a channel or trading
range bar and then a new breakout on bar
9.
But then tight channel is actually a
micro channel down to bar 13.
So breakout pullback reaching that
second big target. So I think the
downside here might be limited.
Another fractal
breakout second leg pattern 1920 bare
reversal follow through pullback 21 and
second leg 21. I don't know if they
reached their target.
I don't think it quite got there on bar
21.
Bar 22. Now we have a
wedge structure three or four legs down
in a big bull breakout bar. Second leg
up likely. It's probably always in long
on the close of bar 22 which means by
the close by the pullback.
Yes, it's forcing you to buy at
resistance top of this trading range
beginning of the channel the moving
average the breakout point the bar one
low. So, it's not an ideal trade, but I
think the options here are to be long or
flat
breakout follow-through, but a smaller
follow-through bar
with yesterday's low in mind as a profit
target. First target probably measured
move of the bar, bar 22,
which looks like the bulls reached it on
bar 25.
So we may find a minor reversal here but
a micro channel with all good closes
closing above every bar closing above
the high of the prior bar. Lots of
qualities going for this bull micro
channel.
So first reversal probably minor buyers
below bar 25.
Minor reversal. This is two three legs
down on a smaller time frame. We broke
below 25. We tested the moving average.
Bulls are going to buy this for a
minimum test of this high, but also that
target there.
Since 203 is a smaller bar, this might
be a spike in channel on a smaller time
frame. 22 is the initial burst of
momentum. So, the second leg measured
move may be based on the size of 22
alone. That takes you a little higher.
So there's magnets up here. High one
buy. Bulls make their scalp.
Reversal follow-through strong enough
for a second leg, which the bulls got on
bar 30. Three bar micro channel. Second
leg up likely. So 31 probably a minor
reversal testing support. The traders,
the bears who sold here got trapped.
They may use 31 as an opportunity to
break even or avoid a loss which creates
support. So 31 a buy the close bar.
32 buy the close. Disappointing follow
through for the bears. High two buy
setup bar 33.
Pulls can buy above 33. Looking for a
second leg.
Outside up 35. Bears got three legs
down. One, two, three. Wedge double
bottom with 28 bull breakout. Second leg
likely. This is a complex two-legged
pullback. I said it's a high two. On the
lower time frame, it's a it's a high
three in here.
And again, that second leg may just be
based on the size of bar 22. So, bulls
made that or just about made that on 35.
But also in the channel, they'll
probably get to the new high. Probably
test yesterday's low.
Enough momentum 35. We're going at least
probably going at least a little bit
higher. But the upside is limited.
Probably sellers above 30 and at
yesterday's low. Why are there probably
sellers at yesterday's low? Market broke
below it, tested above it, and then got
another strong bare breakout in this
area. Remember
this breakout point, the bar four low,
the bar five low, that's about the same.
The traders,
the reason there's probably resistance
here is because
let's think back to bar two or bar
three. Bulls were buying betting on a
second leg. This is obviously Al Brook's
price action philosophy and theory. So,
I cannot prove that this is true, but I
do believe that it's true and I do trade
based on the belief that it's true. And
I'll make a separate video on the theory
and the basically the overall
philosophy. I won't get into it in this
review, but basically the belief that I
hold is that
bars one and two, computer algorithms
pick up a burst in momentum.
They quantify the strength of a breakout
and bars one and two is strong enough
for a second leg and second legs are
usually symmetrical to the breakout
signal. So the bulls who bought here
were trapped by the bare reversal. And
if they were not quick to exit, they
suffered a loss or they're holding a
losing position. Maybe they bought
scaled in lower.
And if a bull bought and scaled in
lower, what are they going to do when
price gets back to their original
entry price? So here we are on bar 35.
Are you eager to buy here or are you
desperate to sell out of longs? If you
think about that logic, bulls are
desperate to exit losing positions or
break even if they got lucky or if they
managed their trade properly. The best
scenario for the bulls is to basically
avoid a loss or make a small win. If you
bought here, scaled in, scaled in,
especially if you increased your
position size, you may be at a profit at
this point. But are you going for a
measured move here, or are you just
happy to get out here? My belief is that
the bulls are just happy to get out here
at a relatively good value.
So, they're going to sell out of their
longs. You also have the bulls who
bought down here. Forget about the
trapped bulls up here. You got the bulls
who bought bar 22 or anywhere through
here capturing second legs. And they
know the upside is limited because of
these bulls. They know it's probably a
trading range day. In a trading range,
you want to buy low, sell high. We're
testing high in the range. So
the bulls who bought here capturing
second legs
as they make profits on their positions
they have to reduce their risk and take
profits on those positions. So I think
the upside here is limited even though
35 strong enough bull bar for a second
leg. It might be like three in a trading
range. So follow through. 36. Not a
great sell. Probably buyers below. Small
second leg up likely. But 37 reasonable
to be short below it. The only thing is
you probably want to use a wide stop,
not a stop directly above bar 37 or 36
because 35 probably had enough momentum
for at least a small second leg. Some
hesitation here that may go above bar 35
and 36 or excuse me 37 and 36. So, you
can sell here, but be prepared for a
deep pullback. Don't put your stop here.
Maybe use a measured move for your stop.
But I think it's probably better to be
always in short below bar 37. So, if
you're long, just exit below 37.
And then the bull's getting a small
second leg, but finding resistance at
yesterday's low breakout points earlier
in the day. 40 outside down probably
always in short.
It's enough of a reversal that
it's probably going to get a small
second leg down and the structure
supports a correction. We're testing a
bull channel line. Strong enough
breakout. It may get another second leg
later, but after three or four legs up,
it's two legs up on a higher time frame.
testing resistance. It's probably going
to correct for at least 10 bars and two
legs. That's why it's probably always in
short below 37 and 40 reversal and
follow through. Bad high one, top of a
trading range. Sellers above, sell the
close. Three bar micro channel, sell the
close, sell above the first pullback,
which is 43.
Second leg down likely.
Bears have a target
through our micro channel pullback
vacuum test of that measured move
target. So second leg but tight bear
channel minimal pullback here. So this
breakout is growing. So we see two legs
one pullback two but it's one leg on a
higher time frame and it might be one
pullback two. So now this entire tight
channel is a breakout signal. Any
reversal is probably minor. So sell
above 48,
sell anywhere, tight bear channel,
second leg down likely. So what I'm
talking about is from the high to the
low close, pullback, second leg target
here,
which is around the breakout points down
here.
Another micro channel down to R53. But
now you've got three legs down. It's
still a tight bare channel. Second leg
down likely, but one, two, three pushes
down. Testing
support breakout point here. Three legs
down here. This bull breakout still may
need a second leg. So, there's reasons
that the downside here might be limited.
I forget if we looked at this measured
move
leg one pullback leg two.
So a leg two measured move in leg three
as support in a trading range. Better to
take profits here. 54 not a particularly
strong bullbar but the context supports
a reversal or a at least a correction.
So 54, it's okay to exit shorts above
it, but it may be a little aggressive to
buy above it. Bull breakout 55, but big
tails still not ideal for buying after a
tight bare channel. Bulls need one more
bar. And then the bulls get one more
bar, three bar micro channel. It's
probably buy the close here on bar 56.
It was always in long based on context
here, but for me, it's always in long
based on price action evidence here. So
this is by the close. Second leg up
likely
target possibly this
leg one leg two brings you back to that
resistance. The only thing is it's
actually more bearish overall.
The bigger bare breakout the gap down
this big breakout. This still may be
getting a second leg down. something
like this.
Leg one
deep two or three-legged pullback and
then a second leg target down here.
So the upside for the bulls,
the bulls may be increasingly likely to
fail because it's a trading range and
you know there's disappointed bulls up
here. Again, tight bare channel. the
traders who bought here trapped,
disappointed, looking for any rally they
can get to avoid a loss or break even.
So
I still think in this area there's
trapped bulls and therefore resistance
but strong enough micro channel here for
second leg. It is by the close
57 accelerating but then a smaller bar
58. This is already possibly a measured
move up.
And it looks like the next bar 59
reached that leg one equals like two
measured move. Testing resistance. Not
quite at yesterday's low, but
enough
tests of this area. We tested it here.
The bar five low. Bar 7 tested it 30 and
several bars through here.
So leg one, leg two, top of a trading
range and testing an area of resistance
trading range bar probably
better to sell the close. If it's
when you think about always in if you
had to be in the market at this instant,
it's probably always in short based on
context. You've got two legs up to a
resistance area high in a trading range.
It's true that the bulls have still some
distance before
this measured move target is reached,
but they don't necessarily have to get
there.
And especially if you consider,
you know, there's different ways to draw
it. 22 23 maybe that's the initial burst
of momentum. Then there's a pullback 24.
So maybe some traders are seeing this as
the target and they're already taking
profits. There's different ways to
measure breakouts and to look at it. But
the evidence here, three bar micro
channel,
second leg, measured move, top of a
trading range, and a trading range bar.
If anything, it's probably better to
look to be short and take profits on
your longs because bulls are taking
profits at measured move targets at the
top of a trading range. It's also leg
two. There's different ways to look at
this. Maybe it's leg one. All of this is
part of the pullback and then a new
burst of momentum, possible second leg
trap, top of a trading range. That's why
the context supports always in short on
the close of 59. But of course, there's
no bare breakout yet, at least on this
time frame to warn us or to tell us that
it's always in short. So on the close of
59, it's always in short based on
context, but no price action, no price
action evidence. And then there's the
bare breakout bar 60. So that's a sell
close bar always in short. It's possible
you get a second leg after this much
buying. You probably will, but in this
context, top of a trading range, strong
bare breakout, second leg down, likely
sell the close, sell a pullback.
Bears get immediate follow through
still. We'll probably find support down
here. We did bounce on 61. It's also a
measured move of the bar.
So 60 immediately got one R. It's also
testing this breakout point the bar 54
high but much momentum to be buying
second leg down likely. So minor
reversal
possible but more likely.
Do you really want to buy here after the
bears have a breakout and follow through
that's likely to get a second leg and
the best can hope for is a minor
reversal or a bounce.
So, it's probably better to look to sell
finding some support. It's possible we
get that small second leg, but tight
bear channel, micro channel, second leg
down, likely.
So, what do you do here? Big up, big
down, testing support.
In this tight trading range, it's
probably better to wait for the
breakout. Breakout direction close to
50/50. Tight trading range. Bulls may
get a second leg. Bears may get a second
leg. Both sides look strong enough for a
second leg. The bull breakout trapped
traders created support. The bear
breakout trapped traders created
resistance.
Basically, you could probably take
either side here. And if you manage the
trade correctly, you can make money.
We're in a buy zone, but there's the
increased risk that this bare breakout
gets a second leg before the bulls get
very much because the bull break out may
have been a second leg trap, trapping
bulls into tra into into buying too
high. And it's actually more of a vacuum
test of resistance than a reset of bull
strength and momentum.
Bulls getting their second leg, but the
upside limited. Remember, probably
sellers here at this breakout point
back to top of a trading range. Call it
a bare channel. Here's a bare channel
line, but it's very broad. And either
way, you trade the channel like you
would trade a trading range. Buy low,
sell high.
So, another might be a fractal second
leg trap. Leg one, pullback, leg two.
But why is bar 68 growing in a parabolic
fashion at resistance?
So it might be more of a sell the close
bar upside probably limited
reversal bar 69 probably sell the close
always in a short bear's getting their
second leg also the bigger picture maybe
getting its second leg maybe from here
to here or here or the low close
there's a leg two target
might be too late in the day to reach
that there's also support the bears
would have to get through
maybe this tight channel is getting a
symmetrical second leg.
So there's actually a reaction to that.
This breakout point, this tight bare
channel breakout on a higher time frame.
Leg one pullback leg two. Leg two
subdivided into two legs. So downside
limited 75 an outside bar at support in
leg two. Maybe even leg three nested leg
three
in a trading range. So
one, two, three. One, two, three.
75 maybe better take profits.
Context supports always in long, but
price action tight bear channel supports
always in short. So minor reversal
likely, but still lower prices
ultimately more likely.
minor reversal.
Reversal followed through 7778, but it's
weak. It's testing resistance
and it's following a tight bear channel
that's probably going to get a second
leg. 78 is a to sell the close bar.
Bulls have two legs up. One pullback,
two minor reversal, tight bear channel,
breakout, pullback. Probably will get a
second leg.
And the the bears got their second leg.
and then followed by profit taking again
nested three-legged pattern. Three legs
here, three legs here, low in the
trading range and then just out of time
in the RTH session.
All right, that's it for today's end of
day review. Thanks again for joining me
for today's video and make sure you
check out the description of my videos
for many more resources on the topic.
All right, thanks again and I hope
everyone has a great night.
Full transcript without timestamps
Hey everybody, I hope everyone is doing well and had a good day. And thank you for joining me for today's end of day review of the E- Mini 5 minute chart for Thursday, February 5th, 2026. And I'll put the timestamp in the description of this video when the review starts. But before we begin the review of the five-minute chart, there's a question that I wanted to answer. So, somebody commented on one of my recent videos and they were expressing their confusion when it comes to deciding whether to look at the Globex chart or the regular trading hours chart, the RTH chart. And I think it's a good question that's worth bringing attention to so that we don't have confusion with it moving forward. My initial thought with that question is that it's definitely not something we want to take too much of our attention. We don't want to give too much of our attention to it because we can solve it pretty fairly simply and that's by understanding that the context carries over and both charts are going to give us basically the same picture. If you think about gaps, why is there a gap down going into the day? On the RTH chart, price closed at 400 p.m. yesterday here at 6,914 and on the open of the day. So overnight, the market must have traded lower. price has fallen and we opened at 6853 and a half. So it's more than 50 points that the market fell in price overnight. And it doesn't matter whether it's overnight, you know, it doesn't matter the time frame. All that matters is that price was way up here and now price is way down here. If we look at the Gloex chart, it's going to give us the same information. It's just going to give us more detail. So, this person is wondering, should I use the RTH chart or the OEX chart? [clears throat] The reality is that you use whichever chart you want to use. I think it's useful to use the GlobeEx chart at least in the first hour or so just because seeing the bars to the left helps me but especially I mean there's really an easy way to think about it which I'll get into no matter what happens we can see here Globeex chart clearly a strong bare breakout covering a lot of bars and a lot of points bulls really not making money through this entire sell-off minor reversal here, a brief second leg, but this is still a minor reversal on the open. And you've heard Al talk about this in the course in the books. Anyone who's studied Al knows he talks about how reversals are common on the open. And one way that you can kind of take away that mysterious factor is by looking at the GlobeEx chart. You have more information. You can see rally bars one, two, and three on the open, but following a steep selloff and testing resistance. So, three bar micro channel for the bulls. Yes. But do you really want to buy at resistance after this big sell-off? Price may have to go lower to find strong buyers. I'm not necessarily convinced that bars one, two, and three was because of strong bulls buying. I think more likely these bars were produced by strong bears taking profits, probably at a measured move target. And that's in part due to all the overlap and also the tail on bar three. It's telling me we rallied, pulled back, rallied, pulled back, rallied a third time. We're not really breaking out of all the bars left. So, that's good to know on the GlobeEx chart, but let's go back to the RTH chart. How can we use what we see with the gap to give us a maybe not as complete picture as the GloEx chart, but how do we interpret the gap down? You can remember that a gap is just a space between two prices. So, every trend bar is a gap. Look at bar 77 yesterday. It's a trend bar, but you can also call it a gap. There's a space between two prices. There's a space between the low of 76 and the high of 78. There's a space between the close of bar 76 and the close of bar 77. Market moved a big distance in a small amount of time. That traps traders, creates resistance, and produces second legs. The bears had a breakout follow-through, a pullback, and a second leg. And then they took profits on that second leg, which produced bar 80. But this is still a minor reversal, three bar micro channel, or excuse me, tight bare channel. Not a micro channel, but tight bare channel. Minor reversal, although it's a deep pullback, and then gap down. That's a new bare breakout. You can measure it from the high of 81 to the open of the day. You can measure from the close of the prior day, the close of 81 to the open of the day. There's always different ways to measure the breakout. So the gap down can be seen as a bare breakout bar. The result, first of all, we get close to a 50% pullback on bar five and then a symmetrical second leg down. So, yeah, we're missing some information, but also there's breakout points along the way that the market's retesting. Yesterday's low is a big one, but also all of these higher lows during the rally become resistance. So in short, blowback's chart will give you more information, but the RTH chart will tell you the same information in less detail. You don't need to see the Globex chart to know that it's either a bare trend or a bare channel. Some sort of bare breakout occurred. You just don't know if it was a bare breakout followed by a trading range. You don't know if it's a consistent tight bare channel. You don't know if it's a wide trading range. Big down, big up, big down. But either way, the general principle remains true that breakouts get second legs. So if there's a gap, you're probably going to get a second leg in the direction of the gap most of the time within the first 12 or so bars on the five minute. One more thing I want to add is that I mentioned there's kind of a simple way to deal with that. I said you can imagine there's bearish price action based on the gap down. And the same is true for when there's a small gap or no gap. Look at this day. Very small gap up going into the day. What does that tell us about the GlobeEx session? Means that it's a trade range. you don't have to go and check the GlobeEx chart to tell you that it's a trading range. And usually when that's the case, I won't even use the GlobeEx chart. I'll just look at the five minute RTH chart. So in this case, when there's a small or no gap, I'll just continue trading as if it's a continuous chart because the price will obey the support and resistance from the prior day. Anyway, here's the prior day's high. So we can look really quickly at the end of second. Here's the close of the day back here. So here's the glowback session for that small gap that we can interpret. or infer that it's a trading range. And the result is that it's a trading range. Of course, it's possible that it's an opposite or it's a reversal. It could have been a bull trend followed by a bare trend and the gap looks like price didn't move, but there's actually momentum. That's kind of what we see here. You know, it was more bearish going into this day, but overall, it's a trading range. you have this decent rally. The market's not clearly in a bare trend at this point. It's just that there's this bigger tight bare channel getting a deep pullback and then a second leg. But that's where the first bar of the day actually reached. So there was support there. It was not necessarily going to be this big bare trend. This was a reset of the market cycle. So I hope that's helpful. Okay, for the five minute chart today, we had a gap down going into the day, which we talked about. And whenever there's a gap, especially a big gap, the expectation is a second leg in the direction of the gap, which means the rally bars one through four is probably a minor reversal. Also the structure bar one rallied, pulled back, rally, pulled back, rallied a third time. That's three pushes up. It's a micro channel for the bulls. So the downside is probably limited and the bulls will probably get a second leg, but it could have been stronger with less overlap, bigger bull bodies. The context, like we said, with the gap down supports a second leg down. So, increased risk of this being a trading range open and an opening reversal for the bulls, especially when bar two, bars one and two really decent for the bulls. Even though bar one doesn't have a bull body, it nearly closed on its high. We know the second half of this bar probably had some decent momentum. The bar sold off and then rallied into the close. relatively shallow pullback and then a follow-through bar. So, actually really decent bars one and two for the bulls. But because it's big down, big up, you have to assume that the reversal is minor and the lows will be tested. Also, it's nice to know that stat bar one remains the high or the low of the day only about once a week. So, about 20% of the time, it's not very likely. So, the bar one low is a test target. It's a magnet. Probably are going to go there before we go much higher. And then three is a warning that traders are buying pullbacks and scalping out. Why does bar three have so much overlap with the prior bar? And why doesn't it close on its high? It's an indication that this is beginning to channel on the smaller time frame. And because it might be leg and it's after a gap down, you have to be careful buying here. and then an inside bar for indicating even more momentum stalling for the bulls. The trader equation is better for the bears here because the gap down is likely to get a second leg. Bulls have now three or four pushes up on the smaller time frame structure. I still think bars one through four is enough buying for a second leg. It's just that the pullback could be deep. Like I said, bar one, the bar one low is a test target and the market's not going to forget about it. We may have to come back here before going much higher. Outside down bar five, second leg down likely. We know gap down, second leg down likely. So, always in short below bar five. I don't know if it ever became always in long. I think it was always in long on the close of bar two. But then here, this is disappointing. If you bought more sideways than up. So, and then especially when you get bar five, it's always in short. Probably on the close of five, certainly below bar five, always in short. Reversal and follow through. Strong bare signal. Second leg down. Likely sell the close. So, pullback and then seven getting to that bar one target. Three bar micro channel second leg down likely. I mentioned the gap down possible leg one leg two measured move nine reach the smaller one. Another possible way to draw it is from the high of 81 the high of the reversal bar to the close of the gap down which is actually the open of the day. Bar nine just about reaching that as well. Not sure if it actually quite got there. Turned on the snap mode. So bar 10 did not quite get there. A little reaction, but 10 more likely a minor reversal after all these bear bars. Second leg down likely. Bar 10's a still a close bar. It might be enough for a small second leg, but it's still always in short. And that magnet measured move target is probably going to be reached. And it's reached on bar 12. Getting a small second leg. This is still a micro channel. So the breakout is growing on the higher time frame. Here we can count we actually can count three legs down. Micro channel pause in momentum a smaller bar. So volatility expansion, volatility contraction, volatility expansion, pullback. So I'm counting one, pause, two, pause, three legs down. And in here, this is three legs on the smaller time frame. So increases the chance of a minor reversal. Still always in short, but you can expect a pullback, which means it's okay to take profits on shorts and look to sell higher. 10 or excuse me 14 similar to bar 10. Maybe it's sell the close. It might be enough for a small second leg, but it's still always in short. Bulls haven't done enough to break a trend line here. And 15's a weak follow-through bar. So technically breakout follow-through, but weak and bad context. Tight bare channel, micro channel, second leg down likely. So sell the close 15, sell above 15 because it's always in short in a strong bare trend. Sell for any reason. But bigger picture now. One, two, possible third leg down. Probably buyers at the new low. Downside may be limited. Market going sideways in a tight trading range. Possible final flag. Good for the bulls actually because the more the bulls can go sideways, the more they break this bare trend line. and the day structure supports some sort of trading range day. It's probably not a bare trend day. Remember the buying on the open was actually fairly impressive. Bars one and two. A pretty decent signal. I don't think traders have forgotten about that price. Somewhere in this area, it might be yesterday's low, might be the close of two. It might be the breakout point at the low of bar four. I won't keep all these here, but my point is that there's a lot of breakout points and magnets to be tested in trading ranges. Breakout points and magnets get tested. And my thought is that it's probably a trading range day today. Big up, big down on the open. Lots of trading range price action here. And daily range is already at this point almost 80 points which must be around the daily average. I don't have it off the top of my head but it's unlikely that we grow a lot more to the downside which only leaves room for the upside. Of course it can be a trend day and it can the range of the day can double. But when we here's the daily chart context and I'm going to do this zoomed out. You can count three legs down in a bare channel testing support in a trading range. So the downside today probably limited. So, we'll just use yesterday's low as a more major test target. So, the problem with selling here bars 1920, you have a nested completed structure. The bears have a breakout bar 16 pulled back and then it got a second leg. This entire micro channel down to 14 or 13 is likely to get a second leg, but there may be a more complex and deeper correction before that second leg begins. The smaller structure, the bar 9 breakout, this got a second leg. That tight bare channel got a second leg. remember from the bar eight is a smaller bar than the breakout bars. So I see that as more of a channel or trading range bar and then a new breakout on bar 9. But then tight channel is actually a micro channel down to bar 13. So breakout pullback reaching that second big target. So I think the downside here might be limited. Another fractal breakout second leg pattern 1920 bare reversal follow through pullback 21 and second leg 21. I don't know if they reached their target. I don't think it quite got there on bar 21. Bar 22. Now we have a wedge structure three or four legs down in a big bull breakout bar. Second leg up likely. It's probably always in long on the close of bar 22 which means by the close by the pullback. Yes, it's forcing you to buy at resistance top of this trading range beginning of the channel the moving average the breakout point the bar one low. So, it's not an ideal trade, but I think the options here are to be long or flat breakout follow-through, but a smaller follow-through bar with yesterday's low in mind as a profit target. First target probably measured move of the bar, bar 22, which looks like the bulls reached it on bar 25. So we may find a minor reversal here but a micro channel with all good closes closing above every bar closing above the high of the prior bar. Lots of qualities going for this bull micro channel. So first reversal probably minor buyers below bar 25. Minor reversal. This is two three legs down on a smaller time frame. We broke below 25. We tested the moving average. Bulls are going to buy this for a minimum test of this high, but also that target there. Since 203 is a smaller bar, this might be a spike in channel on a smaller time frame. 22 is the initial burst of momentum. So, the second leg measured move may be based on the size of 22 alone. That takes you a little higher. So there's magnets up here. High one buy. Bulls make their scalp. Reversal follow-through strong enough for a second leg, which the bulls got on bar 30. Three bar micro channel. Second leg up likely. So 31 probably a minor reversal testing support. The traders, the bears who sold here got trapped. They may use 31 as an opportunity to break even or avoid a loss which creates support. So 31 a buy the close bar. 32 buy the close. Disappointing follow through for the bears. High two buy setup bar 33. Pulls can buy above 33. Looking for a second leg. Outside up 35. Bears got three legs down. One, two, three. Wedge double bottom with 28 bull breakout. Second leg likely. This is a complex two-legged pullback. I said it's a high two. On the lower time frame, it's a it's a high three in here. And again, that second leg may just be based on the size of bar 22. So, bulls made that or just about made that on 35. But also in the channel, they'll probably get to the new high. Probably test yesterday's low. Enough momentum 35. We're going at least probably going at least a little bit higher. But the upside is limited. Probably sellers above 30 and at yesterday's low. Why are there probably sellers at yesterday's low? Market broke below it, tested above it, and then got another strong bare breakout in this area. Remember this breakout point, the bar four low, the bar five low, that's about the same. The traders, the reason there's probably resistance here is because let's think back to bar two or bar three. Bulls were buying betting on a second leg. This is obviously Al Brook's price action philosophy and theory. So, I cannot prove that this is true, but I do believe that it's true and I do trade based on the belief that it's true. And I'll make a separate video on the theory and the basically the overall philosophy. I won't get into it in this review, but basically the belief that I hold is that bars one and two, computer algorithms pick up a burst in momentum. They quantify the strength of a breakout and bars one and two is strong enough for a second leg and second legs are usually symmetrical to the breakout signal. So the bulls who bought here were trapped by the bare reversal. And if they were not quick to exit, they suffered a loss or they're holding a losing position. Maybe they bought scaled in lower. And if a bull bought and scaled in lower, what are they going to do when price gets back to their original entry price? So here we are on bar 35. Are you eager to buy here or are you desperate to sell out of longs? If you think about that logic, bulls are desperate to exit losing positions or break even if they got lucky or if they managed their trade properly. The best scenario for the bulls is to basically avoid a loss or make a small win. If you bought here, scaled in, scaled in, especially if you increased your position size, you may be at a profit at this point. But are you going for a measured move here, or are you just happy to get out here? My belief is that the bulls are just happy to get out here at a relatively good value. So, they're going to sell out of their longs. You also have the bulls who bought down here. Forget about the trapped bulls up here. You got the bulls who bought bar 22 or anywhere through here capturing second legs. And they know the upside is limited because of these bulls. They know it's probably a trading range day. In a trading range, you want to buy low, sell high. We're testing high in the range. So the bulls who bought here capturing second legs as they make profits on their positions they have to reduce their risk and take profits on those positions. So I think the upside here is limited even though 35 strong enough bull bar for a second leg. It might be like three in a trading range. So follow through. 36. Not a great sell. Probably buyers below. Small second leg up likely. But 37 reasonable to be short below it. The only thing is you probably want to use a wide stop, not a stop directly above bar 37 or 36 because 35 probably had enough momentum for at least a small second leg. Some hesitation here that may go above bar 35 and 36 or excuse me 37 and 36. So, you can sell here, but be prepared for a deep pullback. Don't put your stop here. Maybe use a measured move for your stop. But I think it's probably better to be always in short below bar 37. So, if you're long, just exit below 37. And then the bull's getting a small second leg, but finding resistance at yesterday's low breakout points earlier in the day. 40 outside down probably always in short. It's enough of a reversal that it's probably going to get a small second leg down and the structure supports a correction. We're testing a bull channel line. Strong enough breakout. It may get another second leg later, but after three or four legs up, it's two legs up on a higher time frame. testing resistance. It's probably going to correct for at least 10 bars and two legs. That's why it's probably always in short below 37 and 40 reversal and follow through. Bad high one, top of a trading range. Sellers above, sell the close. Three bar micro channel, sell the close, sell above the first pullback, which is 43. Second leg down likely. Bears have a target through our micro channel pullback vacuum test of that measured move target. So second leg but tight bear channel minimal pullback here. So this breakout is growing. So we see two legs one pullback two but it's one leg on a higher time frame and it might be one pullback two. So now this entire tight channel is a breakout signal. Any reversal is probably minor. So sell above 48, sell anywhere, tight bear channel, second leg down likely. So what I'm talking about is from the high to the low close, pullback, second leg target here, which is around the breakout points down here. Another micro channel down to R53. But now you've got three legs down. It's still a tight bare channel. Second leg down likely, but one, two, three pushes down. Testing support breakout point here. Three legs down here. This bull breakout still may need a second leg. So, there's reasons that the downside here might be limited. I forget if we looked at this measured move leg one pullback leg two. So a leg two measured move in leg three as support in a trading range. Better to take profits here. 54 not a particularly strong bullbar but the context supports a reversal or a at least a correction. So 54, it's okay to exit shorts above it, but it may be a little aggressive to buy above it. Bull breakout 55, but big tails still not ideal for buying after a tight bare channel. Bulls need one more bar. And then the bulls get one more bar, three bar micro channel. It's probably buy the close here on bar 56. It was always in long based on context here, but for me, it's always in long based on price action evidence here. So this is by the close. Second leg up likely target possibly this leg one leg two brings you back to that resistance. The only thing is it's actually more bearish overall. The bigger bare breakout the gap down this big breakout. This still may be getting a second leg down. something like this. Leg one deep two or three-legged pullback and then a second leg target down here. So the upside for the bulls, the bulls may be increasingly likely to fail because it's a trading range and you know there's disappointed bulls up here. Again, tight bare channel. the traders who bought here trapped, disappointed, looking for any rally they can get to avoid a loss or break even. So I still think in this area there's trapped bulls and therefore resistance but strong enough micro channel here for second leg. It is by the close 57 accelerating but then a smaller bar 58. This is already possibly a measured move up. And it looks like the next bar 59 reached that leg one equals like two measured move. Testing resistance. Not quite at yesterday's low, but enough tests of this area. We tested it here. The bar five low. Bar 7 tested it 30 and several bars through here. So leg one, leg two, top of a trading range and testing an area of resistance trading range bar probably better to sell the close. If it's when you think about always in if you had to be in the market at this instant, it's probably always in short based on context. You've got two legs up to a resistance area high in a trading range. It's true that the bulls have still some distance before this measured move target is reached, but they don't necessarily have to get there. And especially if you consider, you know, there's different ways to draw it. 22 23 maybe that's the initial burst of momentum. Then there's a pullback 24. So maybe some traders are seeing this as the target and they're already taking profits. There's different ways to measure breakouts and to look at it. But the evidence here, three bar micro channel, second leg, measured move, top of a trading range, and a trading range bar. If anything, it's probably better to look to be short and take profits on your longs because bulls are taking profits at measured move targets at the top of a trading range. It's also leg two. There's different ways to look at this. Maybe it's leg one. All of this is part of the pullback and then a new burst of momentum, possible second leg trap, top of a trading range. That's why the context supports always in short on the close of 59. But of course, there's no bare breakout yet, at least on this time frame to warn us or to tell us that it's always in short. So on the close of 59, it's always in short based on context, but no price action, no price action evidence. And then there's the bare breakout bar 60. So that's a sell close bar always in short. It's possible you get a second leg after this much buying. You probably will, but in this context, top of a trading range, strong bare breakout, second leg down, likely sell the close, sell a pullback. Bears get immediate follow through still. We'll probably find support down here. We did bounce on 61. It's also a measured move of the bar. So 60 immediately got one R. It's also testing this breakout point the bar 54 high but much momentum to be buying second leg down likely. So minor reversal possible but more likely. Do you really want to buy here after the bears have a breakout and follow through that's likely to get a second leg and the best can hope for is a minor reversal or a bounce. So, it's probably better to look to sell finding some support. It's possible we get that small second leg, but tight bear channel, micro channel, second leg down, likely. So, what do you do here? Big up, big down, testing support. In this tight trading range, it's probably better to wait for the breakout. Breakout direction close to 50/50. Tight trading range. Bulls may get a second leg. Bears may get a second leg. Both sides look strong enough for a second leg. The bull breakout trapped traders created support. The bear breakout trapped traders created resistance. Basically, you could probably take either side here. And if you manage the trade correctly, you can make money. We're in a buy zone, but there's the increased risk that this bare breakout gets a second leg before the bulls get very much because the bull break out may have been a second leg trap, trapping bulls into tra into into buying too high. And it's actually more of a vacuum test of resistance than a reset of bull strength and momentum. Bulls getting their second leg, but the upside limited. Remember, probably sellers here at this breakout point back to top of a trading range. Call it a bare channel. Here's a bare channel line, but it's very broad. And either way, you trade the channel like you would trade a trading range. Buy low, sell high. So, another might be a fractal second leg trap. Leg one, pullback, leg two. But why is bar 68 growing in a parabolic fashion at resistance? So it might be more of a sell the close bar upside probably limited reversal bar 69 probably sell the close always in a short bear's getting their second leg also the bigger picture maybe getting its second leg maybe from here to here or here or the low close there's a leg two target might be too late in the day to reach that there's also support the bears would have to get through maybe this tight channel is getting a symmetrical second leg. So there's actually a reaction to that. This breakout point, this tight bare channel breakout on a higher time frame. Leg one pullback leg two. Leg two subdivided into two legs. So downside limited 75 an outside bar at support in leg two. Maybe even leg three nested leg three in a trading range. So one, two, three. One, two, three. 75 maybe better take profits. Context supports always in long, but price action tight bear channel supports always in short. So minor reversal likely, but still lower prices ultimately more likely. minor reversal. Reversal followed through 7778, but it's weak. It's testing resistance and it's following a tight bear channel that's probably going to get a second leg. 78 is a to sell the close bar. Bulls have two legs up. One pullback, two minor reversal, tight bear channel, breakout, pullback. Probably will get a second leg. And the the bears got their second leg. and then followed by profit taking again nested three-legged pattern. Three legs here, three legs here, low in the trading range and then just out of time in the RTH session. All right, that's it for today's end of day review. Thanks again for joining me for today's video and make sure you check out the description of my videos for many more resources on the topic. All right, thanks again and I hope everyone has a great night.
Download Subtitles
These subtitles were extracted using the Free YouTube Subtitle Downloader by LunaNotes.
Download more subtitlesRelated Videos
Download Subtitles for Emini Review - Feb 17, 2026 Analysis
Get accurate and easy-to-follow subtitles for Joseph Imbornone's Emini Review on February 17, 2026. Enhance your understanding of market insights by downloading captions for this timely video. Perfect for traders looking to review key points and strategies discussed.
Download Subtitles for Emini Review - Feb 04, 2026
Access accurate subtitles for the Emini Review video dated Wednesday, February 4, 2026, featuring Joseph Imbornone. Enhance your understanding of market insights and trade analysis with clear captions that improve accessibility and learning.

Download Subtitles for 'After Years of Investing' Video 2026
Get accurate and easy-to-follow subtitles for the video 'After Years of Investing, This Is All I’m Buying in 2026.' Enhance your understanding of investment strategies discussed and never miss key insights by downloading captions.

Download Subtitles for EMA-Stochastic Head & Shoulders Trading Video
Enhance your understanding of the EMA-Stochastic Head & Shoulders trading strategy by downloading accurate subtitles for this video. Captions help you follow each step clearly, ensuring you don’t miss any critical details to boost your trading success.

Download Subtitles for Stock Market Surge Insights Video
Access accurate subtitles for the video discussing major stock price surges and the best timing to sell. Downloading these captions helps you fully understand the expert secret indicators shared for profitable trading strategies.
Most Viewed

Untertitel für 'Nicos Weg' Deutsch lernen A1 Film herunterladen
Laden Sie die Untertitel für den gesamten Film 'Nicos Weg' herunter, um Ihr Deutschlernen auf A1 Niveau zu unterstützen. Untertitel helfen Ihnen, Wortschatz und Aussprache besser zu verstehen und verbessern das Hörverständnis effektiv.

ดาวน์โหลดซับไตเติ้ล DMD LAND 3 The Final Land Day 1
ดาวน์โหลดซับไตเติ้ลสำหรับวิดีโอ DMD LAND 3 The Final Land Day 1 เพื่อช่วยให้เข้าใจเนื้อหาได้ง่ายขึ้น และเพิ่มความสะดวกในการติดตามทุกช่วงเวลา เหมาะสำหรับผู้ชมที่ต้องการความชัดเจนและเข้าถึงข้อมูลอย่างครบถ้วน

Descarga Subtítulos para NARCISISMO | 6 DE COPAS - Episodio 63
Accede fácilmente a los subtítulos del episodio 63 de '6 DE COPAS', centrado en el narcisismo. Descargar estos subtítulos te ayudará a entender mejor el contenido y mejorar la experiencia de visualización.

Subtítulos para TIPOS DE APEGO | 6 DE COPAS Episodio 56
Descarga los subtítulos para el episodio 56 de la tercera temporada de 6 DE COPAS, centrado en los tipos de apego. Mejora tu comprensión y disfruta del contenido en detalle con nuestros subtítulos precisos y accesibles.

Download Subtitles for Your Favorite Videos Easily
Enhance your video watching experience by downloading accurate subtitles and captions. Enjoy better understanding, accessibility, and language support for all your favorite videos.

If you found these subtitles useful, consider buying us a coffee. It would help us a lot!