Introduction
In this comprehensive guide, we will explore various correlation techniques used for statistical analysis, specifically focusing on how to perform these analyses using Excel and SPSS. Understanding different correlation techniques is crucial for researchers who need to examine relationships between variables effectively. This article will cover Pearson correlation, Spearman rank correlation, Phi coefficient, and Point Biserial correlation.
What is Correlation?
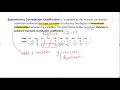
Correlation is a statistical method that evaluates the strength and direction of the relationship between two variables. The correlation coefficient, which ranges from -1 to 1, quantifies this relationship:
- 1 signifies a perfect positive correlation,
- -1 indicates a perfect negative correlation,
- 0 denotes no correlation.
Common Correlation Techniques
-
Pearson R
- Measures the strength of a linear relationship between two continuous variables.
- Assumes normal distribution of variables.
-
Spearman Rho
- A non-parametric measure that assesses the strength and direction of association between two ranked variables.
- Useful when data doesn’t follow a normal distribution.
-
Phi Coefficient
- Used to measure the association between two binary variables.
- Ideal for yes/no or agree/disagree type questions.
-
Point Biserial Correlation
- Measures the relationship between one continuous variable and one dichotomous variable.
- A special case of Pearson correlation applicable when one variable is binary.
Understanding the Techniques
Pearson R
Pearson correlation is about establishing a linear relationship between two continuous variables. To compute Pearson R in Excel, you can use the CORREL function:
=CORREL(array1, array2)
This will return the Pearson correlation coefficient. A coefficient of around 0.6 indicates a strong positive relationship.
Example Calculation:
- Gather your data points for the two variables.
- Use
=CORREL(range1, range2)in Excel, replacing the ranges with your actual data ranges. - Interpret the results based on the coefficient generated.
Spearman Rho
Spearman is used when data does not approximate a normal distribution. It ranks the data points for both variables and computes the correlation based on these ranks. Steps to Calculate Spearman in Excel:
- Rank your data from highest to lowest.
- Use the
CORRELfunction on the rank data.
Example Calculation: If your math and science scores were not normally distributed, you would rank these scores first. The calculation follows the same process as Pearson.
Phi Coefficient
To calculate the Phi coefficient in Excel:
- Create a contingency table displaying frequencies of the two binary variables.
- Use the formula from your contingency table to calculate the coefficient.
Formula:
[ \Phi = \frac{(ad - bc)}{\sqrt{(a+b)(c+d)(a+c)(b+d)}} ] This will show the strength of the relationship between two binary variables.
Point Biserial Correlation
The Point Biserial correlation can be calculated similarly to Pearson but focuses on one binary and one continuous variable. Use the IF function in Excel to convert the binary variable into numerical values (0 for one category, 1 for the other).
Formula in Excel:
=CORREL(if(array1 = condition1, 1, 0), array2)
This will evaluate the correlation of your binary variable against the continuous variable.
Choosing the Right Technique
When deciding the correlation technique to use, it's essential to first check the data characteristics:
- Normality Test: Check if your continuous data approximates a normal distribution using graphical methods like QQ plots or statistical tests such as Kolmogorov-Smirnov.
- Determine Variable Types: Understand if your variables are continuous, binary, or categorical to select the appropriate correlation technique.
Conclusion
In summary, understanding and applying correlation techniques such as Pearson, Spearman, Phi coefficient, and Point Biserial are crucial for analyzing data relationships effectively. By mastering these methods and knowing when to apply them, researchers can draw insights and conclusions that are backed by statistical evidence. Make sure to conduct normality checks, choose the right technique based on data types, and interpret the results clearly for successful statistical analysis with Excel and SPSS.
Good day Uh this video discussion is for um lesson one that is correlation techniques so we will test and measure
for the correlation using Excel and SPSS But before that um Let's have a quick review of the concepts and the
definition per correlation technique so the most common is the peons are so it measures the strength and magnitude of a
linear relationship between two variables so having said that most of the time um peons are yung ginagamit
natin to measure for the relationship of two continuous variables Okay and then we have Spearman raw so
Spearman raw is the nonparametric version of pearson R it measures the strength and and Association Between Two
rank variables so in case that your data does not follow or does not approximately follow a normal
distribution We will use the nonparametric counterpart of pi's R which is pm draw so yan and then we have
another technique which is f coefficient So it is said to be the measure of the amount of the Association Between Two
binary variable So if the nature of your data of your two variables under study is both of them are binary ang gagamitin
niyo would be f coefficient So ano ba yung binary variables ito yung gumagamit ka ng two scale method so pwedeng yes or
no agree disagree yung mga ganan mga ganong example So if ganon Iyung data niyo you will use F coefficient to
measure for the relationship and then the last one would be point by serial So it used to measure the strength and
direction of the Association that exist between one continuous variable and the other one must be dichotomous so in case
you have one binary variable and one continuous variable you can use point base seral coefficient to measure for
the relationship By the way point based serial is a special Extension of pearsons R again peons are dalawang
continuous variables Iyung gusto mo i-correct for the formula if you want to
compute them by hand um So ganyan lang and then para alam niyo lang din kung paano na- derive yung formula or Sorry
Iyung formula so we have person product moment we have Spearman row so as you can see ang ginagamit dito a d so Iyung
d here would be difference in ranks and we have Spearman row with ti runs So yung isa um no tie ranks and then yung
isa with tie ranks and we we have point by serial um and then we have the F coefficient so
mamaya i-compute natin y Okay so ang nacompute lang diyan by hand or semi automatically would be ito f coefficient
The Other kaya naman i-run using Exel na formulas Okay and then review lang tayo Paano yung process and rotation no so
first and foremost ang chine-check natin would be normality of data para malaman natin again kung ang gagamitin would be
pearson which is a parametric test or Iyung nonparametric counterpart niya which is spe draw Okay so How will we
check for the normality of data usually we use box plots and then I don't know if you're familiar with kolmogorov is
smirnov and shero test so again ang difference lang niya If you have 2000 samples are more It's better or it's
best to use kolmogorov is smirnov to test for normality and then if you have less than 2,000 samples of course We
will use shya per wik test and then the use of normal QQ plot if medyo mas Uh illustrative person kayo or Mas madali
kayong mag-analyze using charts yan We can use also the QQ plot Okay and then um After that we will apply the proper
correlation technique to use with dito sa apat kung alin diyan Okay and then interpret the correlation results So um
I know na you're familiar with Yung ganitong scale um yan with if 0 to1 very weak Actually if zero nga negligible na
e and then 20 to 39 weak ganyan ah Minsan gumagamit tayo ng um ng satisfactory correlation ganan ganan
strong and very strong so sample lang to and then yung iba ang ginagamit lang imbis na five ah three lang so small um
moderate saka large so large large correlation meaning kasi um pwede ding mag-translate yyan to
large effect size yung mga ganon pero at least um we have knowledge naman kung ano iba't ibang scaling for the Uh
interpreting correlation coefficient and then we will test for significance So by the way ito ah do not use this pala kasi
this one is the outdated formula to compute for the P for the t no so Mamaya naman sa Excel makikita natin yung
updated na formula so Ayan and then so let's go to the Excel Sample muna so ang gagawin
natin i-compute natin yung um ah co-computer Nira natin sa SPSS dapat
same result Okay so let's go muna with the here Actually naglagay lang ako reference here this one yung IQ range
For your information lang yan pag nag-in kayo ng IQ in case lang meron tayong dito kasi sa data natin merong IQ So if
you want to interpret um the result very well detailed gagamit Excuse me gagamit tayo nito Okay pero diyan lang yan for
your info lang yan Okay so note in ranking for Spearman raw the data are ranked from highest to lowest so
descending Order and then for point by serial Uh again It's a special case of pearson R lang and then for f
coefficient under SPSS makikita niyo siya sa descriptive cross tab so nilagay ko lang siya diyan para ah For quick
guidance niyo lang pero this one would be our data so let's see kung ilan yung respondents natin we have 100
respondents and then ah we get their sex age height IQ Uh their scor in math science English Filipino and then yyung
position nila or yyung agreement nila with death penalty issue so agree disagree lang yan so dalawang two
scoring method lang ginamit Okay so let's go to the example of pearson R so for example here gusto nating i-test
yung correlation between age and height so copy lang natin yung data ng age and height so copy and then paste yan okay
if you want to use Excel Actually merong formulas naman ng Excel diyan pero for Uh more explanation lang i-type na lang
natin So equals ang ang Excel is gumagamit ng formula na correl So it Returns the correlation coefficient
Between Two data sets Okay so corel corel of array 1 that would be age Actually pwedeng mag-in change pwedeng
height unahin niyo or pwedeng age Same lang yan Same yung lalabas ni correlation so array 1 and then without
the Heather ha and then comma array 2 so hindi niya kasi mag-compute kapag merong heer ito
yung words and then y the height So what would be the correlation wi age and height that is 63 or 64 going back to
Powerpoint presentation 64 um Falls under the Strong relationship ' ba Okay so mamaya sa interpretation alam na
natin na strong relationship you can use different kinds of ito sa actual thesis niyo ha ano lang to um quick reference
lang natin Pero mas ma ah Actually kapag um mas sensitive yung data dapat mas strict yung correlation natin na scaling
like if ever less than 10 na siya imb na very weak negligible na meaning ng negligible as in no correlation At All
Or very insignificant Iyung correlation niya na hindi na need iate sa study So yung ganon so pero for ano lang Basic
lang We can use this one Okay so going back What would be our degrees of freedom so pinakamadali ilan
condence mo 100 ayan -2 mo lang so ang formula ng degrees of freedom for correlation would be n- 2 y kasi palagi
po tayong 2 tailed so n- 2 um would be 98 or if you want if ever kunwari hindi kayo nakapaglagay ng ng
numbering na 1 to 100 so we can use the word the Excel formula count literal yyan bibilangin niya lang kung ilan yung
binigay niyong um kung ilan yung value sa binigay niyong array so count a32 102 so bibigay niyan 100 and then
lagay niyo lang Min 98 Okay and then For your information The Count formula ang kount lang niya yung numbers hindi niya
kount yung words So kahit i-extend nio yung range niy diyan 98 pa din ire niya or 100 pa din kahit lagyan niyo ng
words and then gusto niyong icount yung name or words so kunyari you have ito quick ano lang ha Excel guide lang so
kunyari we have three names are Sige done kunyari ganyan and then
kunwari Marami Marami yan Sige so kunwari sobrang dami niyan
yan and then if you want to count that um We will use the Excel formula count a so so yan naman yyung
nagka-cancer range that are not empty Okay so count a and then this one so 16 we have 16 names pero pag
ginamit niyo diyan count zero Yan lagi Okay so again if ah sa Paano niyo to magagamit sa database management for
example gender Yan You can use count kasi male female male female hindi ika-cancel kung count lang na Excel
formula so you can use count a Okay sige Going back na so degrees of freedom would be count Nandito naman sa gilid
yyung formula for your information so count a a32 102 -2 and then we will use um Bakit natin i-compute yyung t and P
kasi we know the correlation pero hindi natin alam kung significant or not ' ba sa SPSS automatic lang niya i-compute
ung significance if less than 0.05 or greater than 0.05 ' ba in here kasi ang Excel ah Kailangan mong i-translate muna
into t computed value yung relationship bago mo ma-test yyung p value Okay so let's compute for the t Uh computed
value of our relationship so ito yun computing for p value para lang malaman natin ung kung significant or not yung
relationship ng nacompute natin So yan that would be R * ro n - 2 so R natin pwede niyong i-link na lang cell link so
ang R natin would be f3 so tapos Times Square Root so you can use Excel formula
sqrt root n - 2 which is our degrees of freedom so link niyo na lang degrees of freedom would be located in um cell
F4 Okay and then sabi dito ah divided by so ah i-ano lang natin i-close lang natin yung buong numerator natin into
parenthesis tapos divided by so again meron siyang square root doon so square root of um 1 - r s so 1 - quantity yung
R natin would be which is 0.63 i-raise lang natin siya into 2 Ayan so 1 - r s or you can use the Kung ayaw niyo
gamitin to yung shift 6 na symbol which parang upper case ang pwede niyong gamitin 1 - r s so pwedeng power
exponent yan meaning ng power so power of kung ano Iyung number or Iyung base niyo power of R rais to Anong power 2 so
Ayan that will return a 8.17 60 t computed value as you know naman kapag may
t computed value we can compute na for the p value niya Okay so again um to compute for the significance of your
correlation coefficient you need to translate this um correlation coefficient into t computed value and
then once ma-translate mo na siya saka natin siya kukunan ng P value ang formula ng P value would be t that dis
Ayan t distribution and then ang gagamitin natin two tailed kasi as as naman kaya nga laging may minus two dito
laging two tailed kasi ang correlation Okay so Ayan t distribution to tailed and then um Excel would ask Ano Iyung x
mo that would be your T Uh computed value and then the degrees of freedom would be
98 Ayan na So that's your p value Okay so meaning ah significant yung correlation natin so we can report for
the results na ang magiging interpretation natin sample lang age and height are strongly correlated with one
another with R computed value equ to 0.63 7 p value of 0.00 less than 0.05 level of significance again we're using
three decimal places for p values kasi we're very strict doon sa 0.05 kasi ah pwedeng kapag two decimal
place lang pwede tayong makapag possible makapag compute tayo ng P value equ to 0.05
so which is the Boundary no so mahihirapan tayo kung ire-reject natin or ia-accept yung anal hypothesis natin
ah sorry kung ire-reject or failed to reject natin yyung null hypothesis So we're using 3 decimal kasi yung 0.05 na
Ian pwedeng 049 pwedeng 0.045 46 yung mga ganyan So this one Uh
itong 0.045 kahit ganyan na lang this one alam natin um significant to So this one
itong itong 0.045 ito ang ah kapag strict tayo or sensitive yyung data natin um not significant na to agad
nagfo-focus and then for your info then you can test for correlation using the data data
analysis of Excel now on some cases kasi need mo to i-install yung nasa dulo pero no need to look for Application Store
para is i-install mo Iyung data analysis and solver ng Excel what you need to do lang is to
look for the options under file so again Punta ka sa file and then options and then add ins and then makikita niyo
analysis tool pack so go niyo lang yan and then check niyo lang kung ano yung gusto niyong addin na makikita So
andiyan yung solver add in yung Euro currency tool then analysis tool px so solver add in magagamit natin yan Kapag
nagano tayo nag-run tayo ng scenarios hopefully ma matalakay din natin siya sa study pero analysis tool pack muna tayo
yan and then makikita niyo na yan dito Extension so again um under data if wala kayong data analysis or analyze na
Extension Yun lang gagawin niyo go to file then option look for addin and then install niyo analysis toolpak or vba
Kahit ano diyan sa dalawa and then basta click niyo lang yung go yan and then check for analysis tool package ng Gusto
mong makita lang and then click Okay Ayan nandito na yan magpapakita Okay so for data analysis
Meron diyang correlation Actually marami Ong ang Excel marami siyang kayang irun na ano statistical treatment so Ayan
Excel can Run an Nova with And without replication as long as two factor siya and single factor and may correlation
covariance if you want to see the descriptive stat the exponential is smoothing the moving average meron ding
regression of course regression and then we have t test and Z test for two sample means Okay so let's look for correlation
and then click Okay and then tatanong niya input range So this one for for the Range pwedeng kasama yung label yung or
yung Heather yyung age and height basta iche-check mo lang to labels in first row pag sinama niyo siya sinama niyo
siya sa range Okay and then group by so naka-gray columns b and C so naka-check and then output R for that output range
ang output range gusto k makita sa dito magsimula sa cell i3 and then
cck so same kayo ng macompute kahit using corel per w again wala onong p value so you need to
translate coefficient sa t computed value para makuha niyo p
value now how to check if tama yung computed value natin What ifun natin siya sa SPSS okay for the
SPSS procedure naman or counterpart you need to copy lang itong data or para mabilis para mabilis lang
kasi may IR din natin onong tatlo sa SPSS so ito na lang kopyahin natin yung buo
so ang SPSS kasi ' ba mukha siyang Excel type um luckily pwedeng direct past ka from Excel to SPSS pwedeng ganyan Okay
pero i-correct niyo lang siya sa variable view kung ano yung mga proper header niya So respondent number Chu
Ayan respondent number male female ganyan pero um since we have the data na Alam niyo
naman kung paano iano yan i-rename y mga ganyan I have kasi the data na so open ko na lang yung data para we can save
time naman okay so lesson 2 Ah sorry sorry lon one and then we have this
one yan Okay so Ayan na siya if ever from the raw um yan from the raw palit-palitan lang nilagyan lang natin
ng proper labels and then kung ano yung variable variable view niya Okay and then for the um Ayan ang Uh for
the checking lang of our person are na computed in Excel so dito ang korr relate natin h and height So how we will
correlate that um sa SPSS go to analyze Medyo Alam niyo na ' and then correlate and then by variate and then age and
height select niyo lang yung dalawang Uh variables and then lagay niyo dito sa pain sa right pain and then check niyo
lang Pon and then two Tail flag significant correlation you can see options here if gusto niyo dagdagan ng
mean and standard deviation and then cross product deviation and covariance sa actual thesis niyo Pwede niyo lagyan
ng mean um and standard deviation pwed i-compare niyo yan for the correlation kaya lang um again sa lahat to
nag-a-apply sa lahat ng statistical treatment ha if ever sa actual thesis niyo magdadagdag kayo ng table dapat
kasama siya sa explanation Okay so hindi pwedeng nagdagdag kayo ng means and cross product pero hindi niyo
iniinterpret doon sa chapter 4 of your actual thesis so dapat lahat ng makikitang table doon ni reader
ine-explain niyo Okay and then click Okay so in here naka-frame computed value ni Exel Ay
sorry ni SPSS for the correlation of age and height is 0.63 7 the same with our Excel 0.63 7 and then the significance
0.00 same with our excels also Ayan So that's how will you run um piar on R both in Excel and SPSS now
Delete ko lang ' para Focus tayo sa next natin so next natin would be Spearman raw again Spearman raw is the
nonparametric counterpart of pearson R if ever und data niyo hindi nag-follow ng normal distribution the bell shape
and hindi din siya approximately normal We will run Spearman raw So how will we Run muna
for how will we know ba if normal yung Dato or not so let's go to um sps again y and then guys
um we will go to wait Ah very quick lang let me check lang this one no no no no not here
Okay wait lang ha Let me check lang kung saan yung ayan ito nakita ko na okay okay nakita ko na Okay so How will we
test for normality muna Uh we will go to analyze under descriptive statistic nandon yyung explore yan and then ang
ano yung mine measure natin ang tine-test natin would be math and science so math and science Ayon math
and science um pwede siya here sa dependent list wala naman tayong um grouping factor or ano ah kaya hindi
natin need fill up on to so and then we will go to plots and then check niyo lang to normality plot with test then
continue then click Okay So we're testing for normality here ha so Ayan makikita niyo lang yyung
descriptive um specifically on skewness and cortos para malaman niyo if ever almost Bell
shape siya or not kung skewed ba yung minya to the left or right or not not yung mga ganon Ayan so in this case ang
test of normality niyo Ayan as you can see both Uh math and Science of significant um coefficients no ng We're
Looking under shya pero will test again Bakit siya pero will test ang binbase natin kasi less than 2000 yung samples
natin if ever malaki yung sample natin greater than 2000 We will look at kolmogorov is mern but dito tayo sa
shero Okay so for the test of normality kapag significant to which is less than 0.05 ibig sabihin yung data natin does
not follow normal distribution so again if our computed significant Uh or if our computed p value would be Uh less than
0.05 this means that Iyung data natin do not or does not follow a normal distribution or hindi siya approximately
normal din Okay so kailangan um ah gagamit tayo ng significant ay gagamit tayo ng parametric test if yung
significant or p value natin would be greater than 0.05 So if ever greater than 0.05 yung p
value ang gagamitin natin parametric test Pero kung less than nonparametric test ang gagamitin natin now if ever may
question kayo Ma'am ah Paano po nasabi na um yung data ko hindi siya normal so you
can check here d sa descriptive sa taas kasi It's either skewed to the right yung mean mo ibig sabihin mas maraming
bulk ng data on the right tail and then or skewed to the left pwede d you can test for kurtosis naman kasi Gaano ba
ka- spread yyung data mo kung platic ba yung yung data mo or leptokurtic so pag sinabing platic yung um ends niya
malapad yung spread or malapad yung malapad yyung deviation So ibig sabihin meron kang outlier na Sobrang layo from
the mean so dito niyo yan mate-test sa xess and cortos yan Okay so Ayan so we know na na yyung dalawang data natin
which is Math score and science score does not follow or do not follow a normal or approximately normal
distribution ang gagamitin natin na test would be nonparametric Okay so let me go back with the Exel so
ang ang Exel Wala siyang test for normality Okay so yun yung isang limitation niya so let's go or let's
copy the data of math and science an Again by definition ang Spearman raw ang ang kino-corrupt
formula rank average so rank average of this number first number would be on b3 Ay sorry rank Average ng array so
b32 b102 Okay and then yan reference or order so nabanggit
natin kanina na dapat Sorry sorry sorry ulit so r Average ng number so
that would be b3 comma reference so reference array natin would be b3 to b102 and then kama reference or order so
nabanggit natin here kanina na ang ranking natin for Spearman from highest to lowest so
descending so ang descending dito is zero anan and then enter Okay Likewise in rank of science
naman ganun din rank average of the first cell which would be C3 comma um reference array would be C3 to c102 and
then comma order would be descending now may mali dito Ano yung mali natin dito so isa sa tuturo natin today would
be um locking the cell ila-lock natin yyung cell y as you can see tama yung first input natin rank of the Uh rank of
first data would be which is b3 and then versus the array so rank niya sa buong array ba pero pag dinag down niyo yung
formula like this like this one pag chineck niyo si Um yung next na cell as you can see hindi nasasama yung taas and
then um Ano yan lahat yan Okay so ang nangyari umuusog din Pababa yung kada enter natin ng values umuusog din baba
yung array natin Ayan which is blank na yung ano kaya kailangan natin i-lock yung cell so again delete ko ' ha Kasi
mali yan Okay Paano natin ila-lock yung cell or ano yung meaning ng locking ng cell so literal siya pag ni-lock mo
yyung cell hindi gagalaw yung ah range mo na iyon so let's say for example here it's either cell or range So pwede
nating i-lock ha Okay so for in this case itong b3 Okay lang siya freely kasi p nag-drag tayo ng formula Pababa dapat
Bababa din yung yung reference ng b3 ' ba dapat maging b4 b5 siya Okay na siya doon ang ila-lock natin yung array so
Dapat di siya gagalaw Pwede mo siyang i-lock kasi ang ang ang range natin or yyung array natin
lock na siya from range from row 3 to row 102 Ayan to row 3 to row 102 So pwede mo
na siya i-lock sa row 3 pa Ano ang locking ng cell F4 for the keyboard ng ah desktop pero pag sa laptop I think
you Uh need mo i-press yyung function yyung fn na button and then saak mo lang pwede iano Iyung F4 so Ayan So makikita
mo nagkaroon ng dalawang dollar sign sa before ng column letter and the row number so in in this case ibig sabihin
naka-lock yung ah range natin sa b colum b So ibig sabihin kapag nag-drag tayo pakanan dapat uusog siya ng C D E gann
dapat ha pero since naka-lock siya hindi stay siya sa B Okay and then for um row number naka-lock siya sa 3 So kahit
i-drag daw natin siya Pababa hindi na siya hindi siya Magiging 4 5 6 kasi naka-lock siya sa 3 So Likewise ganun
din dito pwede nating i-lock so function f for for laptop users yan so pag inok natin yan ah pag inenter natin yan ayan
so let's see ha Ayan as you can see hindi na nag sumasama Pababa and then Ayan na hindi na siya bumababa yung
range natin okay now ito yung isang explanation din ng pag-lock pag dinag ko'
pakanan mali din ' ha pag dinag ko'to pakanan naka-lock up siya kay sa science iraan niya si science pero sa array ng
Math kasi nga ni-lock mo din siya sa column B Okay ni-lock mo yung array sa column b now if May plan ka pala i-drag
yung formula pakanan kailangan i-freeze ung reference array mo to right to the right ' so
Ayan Yan so ppag ganiyan ung formula ko and then kinopy paste ko pagdating dito sa Science so uusog din siya so yun yung
importance ng pag-lock ng cell okay or you can manually type for the dollar sign kung gusto niyong Kung ayaw
niyo nung F4 or function F4 lalo na sa laptop mahirap ung function F4 eh So pwede niyo i-type na lang yung dollar
sign so again if you plan to move your range pala huwag niyo siya i-lock sa column letter and then kung gusto niyo
fix lang yung row numbers yun lang yung lagyan niyo ng dollar sign before before nung number Okay so Ayan So okay na tayo
and then we will compute for the difference of rank so ah Math minus science or anything Ah wala namang kaso
kung science minus Math kasi ang mangyayari naman diyan is square mo So mawawala yung um difference ng sign I
mean magiging siyang important unimportant or insignificant yung sign Okay kasi i-square
natin So again that would be f3 s Okay tapos you will you need to compute for the um x Min mean rank Okay
so dito sa sa baba ah Ay sorry sorry sa baba L Wait lang ha Let me Check this one
l13 l ah okay so in this case you need to
compute for the um mean rank Okay so going back lang doon sa formula para maalala
natin Ayan So yung um difference Here it Ayan with ti ranks kasi tayo kasi 100 e pag lumalaki yung sample mas nagkakaroon
ka ng tide ranks as you can see meron dito x Min yung mean y Min yung mean so meaning yan yung um x natin Imus natin
siya sa ah rank mean Okay so l13 Wait lang ha Let me Double
check lang What's this
one Okay ignore niyo lang to nasa taas parang guide ko lang y
Okay 1 and l1 Okay so we will have here mean d1 d1
Min Wait lang ha ah here Okay let's get the average rank Okay let's get the average rank for
X and then for Y Ay ba't ba't dito ba kahit dito sa baba pero pag sa baba ko kasi nilagay Baka may Nahirapan kayo
tigan Sige dito na lang we need to compute for the mean rank of x and then we mean rank of y
yan Okay out Okay so for the mean rank of x so simply average mo lang yyung rank rank
of x so rank ng Math So from cell d3 to d12 so wala naman tayong balak i-drag yung formula Pababa or pakanan so
pwedeng kahit wala na tayong i-lock na cell Okay so the mean rank of x would be 50.5 and then mean rank of y would be
rank average y so that would be science no oop sorry sorry average
average average of ah rank y so Ayan o 50.5 din Okay so ang gagawin natin x Min mean rank delete ko' para hindi na kayo
mabother Okay so x would be the rank of x minus mean rank again we're dealing with ranks na dito ha hindi na doon sa
RW sc kasi ang ang ginawa natin yung RW sc natin tinransfer Y Ay mean rank of x would be
ah x x Min mean So here 50.5 pero This Time ila-lock natin siya buo so on ah column O tsaka row 5 kasi ida-drag
natin yung formula Pababa eh yan so pag chineck niyo yan laging bumababa yung cell reference natin for X pero naka-fix
tayo for mean rank okay Oops sorry sorry sorry sorry yan and then we will compute for
the y mean naman na rank so y that would be the rank of science minus ito Iyung mean rank of y located in Cell
o 6 Okay so and then i-ano natin um lock natin So again that's that would be function F4 or F4 for keyboard user ah
PC users or desktop users and then um for laptop naman function F4 Okay so Ayan na yung x mean and y y mean rank
natin So anong gagawin after after niyan um Let's go back to quickly lang doon sa formula so nandito tayo sa ano ha Dito
tayo sa ti rank So pwede nating gawin yan summation of x Min mean um y- mean Chu or pwedeng i-relate na natin siya So
correlate array 1 Actually correlate array Wait lang ha array 1 and array 2 If I'm not
mistaken Sorry If I'm not mistaken pwedeng ganito na siya pwedeng ang i-direct correlate na
natin would be the ranks kahit hindi na pala natin computin by hand kas sorry sorry per Let us checkit lang let me ah
make this white muna Ay sorry ah i-g ko muna to kasi I think I think kasi when looking back at
the formula Ngayon ko lang napansin computation to ng correlation eh pero ng rank So kaya pwede nating i-direct
formula na lang na equals correl or correlation pero correlation of array 1 would be the rank um
equivalent na of math and then science hindi yung Ross scores ha again so Ayan try try muna natin ' and then um pag
nacompute natin yung p value here ah and then the coefficient saka natin i-compare with SPSS dapat same sila eh
So kung anong sabihin ni SPSS yun yung i-correct natin yung ano natin degrees of freedom 98 pero sige
formula lang count nito kahit Sama mo yung Heather -2 Okay 98 and then for for the t computed value Let's do the
formula again so equal siya kay R um correlation natin to 0.02 tapos times root of n- 2 so 98
divided by um square root again square root and then let's enclose pala our numerator for proper ano
lang proper input Okay and then s root of 1 r 1 Min
Quan ros s shift
62 and then enter so t computed value would be 0.29 and Our p value would be
TD x would be here and then degrees of freedom would be here cell l5 Ayan so 0.77 1222 let's check for the
SPSS ha um sa SPSS Teka delete ko lang ' para malinis hindi tayo nag-scroll down okay for the
SPSS let's Run analyze correlate by variate and then instead of pearson ang iche-check natin
Spearman and then palitan natin ung variable pala palitan natin ng math and science yan and then two tailed flug
significant correlation then click Okay ah there O tama pala so ang ang correlation natin would be
0.029 comparing to excel Ayan 0.029 and then p value would be
0.77 Okay so hindi na natin kailangan to Kailangan lang natin ' if we want to compute Ford um Spearman raw coefficient
by hand ito So kung gusto niyo computin Ong pi na' ay pi na' coefficient na to ah using the formula na ganito or semi
automatically pwede naman pero pwedeng from the rank para mabilis kung Tutal ang
ginagamit niyo naman Exel yan um kung gusto niyo ita-translate niyo lang yung RW score niyo into ranks tapos kunin
niyo na lang using corel na function Excel function after all Ito kasing mga formula na ganyan to compute for
correlation lang as you can see medyo Familiar sa atin Iyung Ayan na Familiar sa atin yyung itsura ng x - me na mga
ganyan okay so we can skip this one if you use Excel to compute for Spearman raw Okay
so what would be ito wala na din to hindi na to Kailangan yan So doon lang pala tayo sa first Uh step which is to
get the rank equ equivalent of R x and r y and then Yeah diretso na tayong computation for correlation coefficient
So what would be our interpretation math and science scores have no or negligible correlation with R is equ to 0.029 4 p
value of 0.77 122 which is greater than 0.05 level of significance pwede ding sinabi sabihin natin dito math and
science sces have no significant correlation kasi ' sinabi nating negligible insignificant na siya so
sobrang liit ng correlation na hindi na siya maganda for proving Okay so yyan yung Spear manra
natin and na-check na natin siya kay SPSS now We'll move on to Phi coefficient so again PH coefficient ah
ginagamit Ong correlation technique kapag ah you have two binary variables so in this case ang binary natin would
be se So may and female and then kung ano yung argument side nila sa death penalty that would be agree or disagree
Okay so ka- niyo lang ilang Male ang nag-agree ilang Male ang nag-agree ilang female ang nag-agree and then ilang
female ang nag-agree as you can see I'm using count if function ng um Exel Okay so Paano ba
yan delete ko muna ang kailangan niyo ito contingency table kailang un yung contingent contingency and then out of
the contingency table saka natin i-compute yung file here Okay so ang um pag bumalik tayo sa data
kailangan natin mabilang yung male na nag-agree and then yung male na nag-disappear
Okay so we have an existing ah Excel formula pero kasi baka mabigla kayo let me give you a quick scratch lang so
suppose meron tayong data here kunyari 1 1 2 3 4 5 Okay and then gusto mong malaman Ilan ang one Ilan ang two Ilan
ang 3 Ilan ang 4 Ilan ang five so ito yung value ito yung frequency Sige na nga buuin ko na ngayon
Ayan frequency Okay so you want to ah know out of your data set O sige tuloy pa natin one two
Ah sorry sorry sorry 1 3 2 2 2 5 5 yan out of your given data set ilan ng one ilan ng two ilan ng 3 ilan ng 4 ilan ng
five So um may condition tayo so ika-cancel kung may condition tayo so tatanungin ka niya ano yung i-c kong
range ang icount mong range would be um a2 to a15 again kailangan nating i-lock Why Kasi
mag-droga Kasi may two pa may 3 May 4 and May 5 tayong kukuna ng frequency so Need natin i-lock yung ah array natin or
yung range natin So pwedeng manually type niyo na lang yung dollar sign and F4 again so Ayan
puttin natin siya lang Okay so range Okay ika-cancel sa inyo i-c count ko'to Anong
condition ang icount mo muna one so that would be cell D2 so ayan pag dinarag down natin yung
formula sasabihin SAO ang one mo sa dataset apat ang two mo apat ang three mo dalawa ang four mo Isa lang and then
ang five mo tatlo so pag kinuha natin ung sum ang total number mo sa data set would be 14 so 14 count 14 so ganun siya
yun yung count if Okay so going back so ang mangyayari dito i-c ah i-c mo yung array ko kapag ang sagot nila or
ang kapag ang gender nila male Okay so yun Yung sa first simple simple example of
um count so simple ay huwag naman simple basic count if Okay so sa Basic count if isa lang
ang condition mo so in this case i-c count mo kung one icount mo kung equal kay two icount mo kung equal kay 3 Pero
dito kasi you have two condition i-c count mo kapag male siya and at the same time nag-agree
siya Okay so you have two conditions so mahaba-haba to' na explanation no okay ang mangyayari
ika-cancel so let's go to the simple example muna of count ifs naman kasi dalawa Iyung
condition mo eh Okay so in this kind of data set hiramin natin ulit to Okay so hiramin natin ' so si data set Ay sorry
Okay copy paste and then you have kunyari here color so kunyari ang color ni one iba-iba may Red pwede letter na
lang Ayan Mahirap mag code red yellow blue green green orange red red blue blue orange um green yellow yellow Ayan
kunyari ganyan Okay so out of your data set gusto mo malaman yung
value at saka yung color ito ano lang to ha simple discussion ng count if para hindi ko na
din i-cover to sa next studies natin I mean hindi ko na i-cover sa next Exel formula na pag-aaralan natin para mas
marami tayong ma-discuss na Excel Okay so value color and then yung frequency
Okay so ang value ko 1 2 3 4 5 lang ang color ko ilan lang ang color ko ang color ko Apat lang so I have red blue
green orange Ah sorry Lima din pala yellow so aan so let's say for example Ang gusto
ko lang icount niya alam kong may may may one na yellow Okay may one na yellow pero ang gusto kong i-compute lang ni
Exel or i-c count niya yung one na red Okay so one na red ang gusto ko and then two na blue three na green four na
orange and then five na yellow yun lang yung gusto kong I i-c count niya non or kung gusto niyo simple sige wait medyo
complicated pala yung example ko okay kung gusto niyo simple one and two lang tayo para quick binary Ayan tapos
two and then isang kulay lang kapag one Ay sorry sorry kapag one red pag two blue Ayan para sobrang dali aan yan
yanan yan Okay ayan
yan Okay so ito very simple ano ha example so ang 1 r alam natin pito pito na 1 r okay manual counting Alam nating
seven ' and alam natin na yung two na blue Alam nating pito din Okay so Paano natin iform yan if ever
complicated yung cell ano natin data so gagawin gagamitin natin count ifs again Okay count if itatanong ka niya
criteria range one so ang criteria range ko ito yung first data set Okay again ida-drag ko yung formula Pababa para i-c
count niya naman yung two kaya ila-lock ko yung cell so F4 Okay so this This Would Be My criteria range one and then
comma tatanungin ka ni Excel okay ika-cancel siya sa one ano pa yung condition mo
condition ko would be sa criteria range to naman which is ito yung color naman again lock F4 i-c mo So kama i-c mo yung
second criteria would be the which would be the color so again parang paggawa lang ng statement yyung coding sa Excel
count ifs kasi you have two condition you have multiple conditions so count if sa cells g 3 to
g16 which which would be your first data set so sa first data set I would like you to count Ilan ang 1 so j3 and at the
same time at the second data set which would be h3 to h16 I want you to count kung ilan ang red so yun yung dalawang
condition icount mo yung one sa first criteria but at the same time icount mo din kung ilan yung red Okay so ganyan
siya explain kay Excel Ayan seven and then when you drag down the formula seven din ibibigay niya Okay so balik
tayo dito ganun na ganon natin siya iinput So count
ifs criteria range one so Punta tayo sa data So ika-cancel
coefficient if male or Kung gusto mo pwede mong sabihing if mail ganyan Kung gusto mo wording ha
count if so yan yyung first condition mo count mo yung first if male and then kama Ano yung second criteria natin
icount mo yung mail pero dapat so ito yung data j3 to j12 for the agreement on death
penalty kung nag-aagree siya okay so yan ung condition sa first range bilangin mo Ilan ang male sa
second range bilangin mo Ilan ung nag-agree so Ayan Bibigyan ka niyang 54 and then kapag kinopy mo yung formula
let's say pakanan gusto mo all maale lang muna so Dito naman sa second male
palitan mo to ng disagree Okay kung gusto mong wala ng typing typing ng agree or disagree kasi
ito naman this one pag din down mo to yan naka-lock up siya sa male pero agree so Lagay mo na lang female na nag-agree
five ganyan and then drag mo dito so female na nag-agree an if ever gusto mo wala N tina-type I
mean ito kasi pinapalitan natin Everytime na nag-drag tayo kung gusto mo Automatic i-link mo dito so mail and
then since ida-drag ko to pakanan ag pag dinag ko pa kanan yung formula yung male uusog dito so kailangan ko siya i-lock
sa column a niya Okay so Bakit column a lang hindi ko ni-lock sa row kasi ida-drag ko din
Pababa so dapat free yyung row number ko free yyung row number ko pero dapat um limited siya or naka-lock siya sa column
a kasi nandun lang yung male na salita pag dinag ko ' pakanan at hindi naka-lock yung a magigi on b4
Okay so kailangan k i-lock a4 and then for the word na agree pwedeng i- up ko na lang dito yan
so cell b3 and then ila-lock ko siya sa row 3 Okay bakit kasi pag dinag ko to pakanan dapat mag-move siya sa disagree
kasi na- niya na yung agree eh now gusto k macount din yung disagree Okay so and then lock lang siya sa row 3y kasi pag
dinag ko yung formula pababa kasi itong formula na'to is to count male na nag-agree pag dinag ko Pababa Gusto ko
din ma-cut oma yan pag dinag mo yung formula so same same lang
yan Okay so yun yung importance ng pag-lock ng cell okay Dapat alam ni mas masanay kayo mag-lock ng cell and then
this one yung total mga sum lang nung binary scores natin yan sum lang niya column
and row Okay so to summarize we have 54 male na nag-agree sa death penalty out of 100 and we have one nag-agree so
total male natin would be 55 total na nag-agree sa death penalty would be 59 total na nag-agree would be 41 Pero out
of um 41 40 yung nag-agree na female Okay and then for nag-agree naman 5 na
female so total of 45 females for our respondent or sample size and ay so ito yung labeling niya So A B C D E F G H so
gagawin natin to for the pH coefficient so equ a Tim d daw so a and d located yung diagonal Pababa so ito
times ito 54 40 so the product of a d Min b and C Min B Tim C so minus quantity uli B Asan yung
B so ito B so siya yung male na nag-demo and then Anong gagawin divided by so ito lang for formality lang iclose
ko yung buong numerator natin sa parenthesis and then over sare root of sare root of the product ng efgh so ef
and then GH so e f Tim
G Tim h yan yan ang PH coefficient natin 88 which is a strong or high correlation no
If I'm not mistaken 88 Ayan nand siya sa very strong or very high correlation
so degrees of freedom natin we know n - 2 98 and then t natin So ganun lang din ulit equ R which would be 0.88 Tim root
n- 2 which would be 98 so link na lang natin para h na ako mag-type divided by so for formality ulit Close
all numerator sa parenthesis and then divided by um Sorry root of root of 1 - r s so root of 1 Min again gamitin ko na
lang yung power ha power of R ra 2 ah yan ra 2 yan So may T computed value would be
18.4 Okay so since may T computed na ako I can compute for the p value of our coefficient so T this d 2t or t
distribution 2 tailed of the t computed value comma degrees of freedom Ayan so significance sc would be
0.000 so for the interpretation sex and argument towards death penalty have very strong
correlation with R = 0.88 1 p value of 0.00 less than 0.05 level of significance Okay so if we will run that
using SPSS again delete ko lang yung output para malinis lang yung
yung panel natin So you will see yung f coefficient going back lang dito sa reference aan
coeff can be found in descriptive then crosss tayo kay SPSS analyze
descriptive then crosss Okay so what would be your row and column So kanina sa example natin dito
ang row natin would be sex ang column natin yung argument sign Okay so ang row natin daw would be sex so dapat naka ano
yan ha naka nominal or categorical na symbol hindi naka-sale ha so scale yan so Dapat naka nominal tayo and then our
column natin would be argument and then if you look at the exact kahit um default niyo na lang wala kayong
gagalawin pero sa statistic Ayan makikita niyo siya here Ayan PH and creamers v so you can compute for the k
square Then after all PH and creamers VR based on ki square derivation Okay and then if your data is nominal or ordinal
Ayan pwede niyong gamitin yung mga correlation techniques Pero in this case we're using ph and creamers v You can
check for correlation Pero ito na kasi yun e kaya baka masyadong maraming tables lumabas Okay then continue and
then for the cells wala kayong gagalawin observe observe and expected which is yung naaano natin sa claimers and then
row and order Ay sorry for the cells yung observe expected yan yung ba kapag nagkak square tayo yun yung ginagamit
nating raw data so same same lang wala kayong gagalawin diyan kini-click ko lang para makita niyo kung ano yung
makikita niyong options kapag kinlick natin yung sell so again ang gagalawin niyo lang talaga would be statistic
check niyo lang yung f and cram and then click Okay Ayan So makikita niyo dito yung ayan quick
descriptive lang kung may missing variable ka or ilan yung n mo and then ito yung contingency table na ginawa
natin So female na agree 5 same yan Ay sorry yan so female na nag-agree lima lang and then and so on ganyan pagdating
dito so you can see two option ay two calculation using Phi and then using cramer V ang value nila 0.00 which is
same sa Excel computation natin and then the coefficient would be 881 now The only difference would be the
sign 4 PH negative siya for creamers V positive siya ah ma'am Ano pong susundin namin nag negative correlation o
positive correlation in this case you will use positive correlation kay creamers v paano ang lagi niyong
gagamitin creamers V na coefficient kahit yung kay F ha ano yan e laging same yan laging same ng coefficient yan
pag magkaiba to Imposible yon laging same ng coefficient yan ang laging difference lang nila would be the sign
now again ang susundan niyo lagi creamers V Here's Why okay so in-explain ko lang here ano yung
pagkakaiba ng ph and creamers v Although same sila ng computation for numerical coefficient Okay so highlight ko na lang
para ano ang ang ang f kasi it under state asymmetric relationship Okay however however kapag
dichotomous yung data mo f is still a symmetric measure and the sign can be ignored When using dichotomous nominal
data so since above we're using dichotomous which is binary and then at the same time nominal data we can ignore
for the sign of for the computed sign of PH coefficient so ayan yun okay f Ayan can be ignored When using dichotomous
nominal data again ma i-ignore mo lang siya When using dichotomous nominal data ha kasi kaya lang naman siya
nag-negative ibig sabihin mas malaki yung ad natin kaysa sa ah Ah mas mas maliit pala sorry mas maliit yung
product ng a natin kaya sa bc Ay sorry sorry sorry so ad - bc Ah okay sorry so in this case kasi mas
malaki yung ad natin eh kaya sa bc yung product ng ad kaya sa bc pero pag Tinignan mo yung contingency graph kasi
niya ito pala dito pala dapat ako nagre-refer pag Tinignan mo yung contingency graph ni f dito na m yung ah
female no so ang ad niya or the product of ad niya would be 5 and one and then the bc niya here would be 54 and 40 so
ang nangyayari um mas malaki yyung ah first product kaya sa second product kaya nag-negative
pero kasi ang classification natin male muna bago female dito kasi female bago male so symmetric naman kasi si f kaya
pwede mong i-ignore ung sign niya doun lang sa placing lang naman yung ah nagkabaliktad tayo with the ano with the
Fi kaya okay lang kayo F i-ignore yung sign Okay so Ayan highlight ko lang ha um since we're using 2 by2 contingency
table ah and then are our we're using dichotomous nominal data pwede nating i-ignore yyung
signify so for the cramer V naman ito kasi kaya hindi siya affected by sign it does not which is the independent
variable So kahit pagbaliktarin mo yan yung agree yung nandito sa row and then yung female and male yung nasa column
same pa din Yung ibibigay ni creamers B Okay so ayan ah makikita niyo naman yung um difference ni Fi and cramer how to
interpret meaning of Association symmetrical n data level and other features pero again same sila ng
coefficient kasi pareho silang derivative ni K square wala namang ano do Ayan as you can see sa formula nila
wala namang difference sila kapag um kapag dichotomous or binary iung variable wala silang difference Okay so
again highlight ko ha kapag ang nature ng data would be binary or dichotomous and then nominal walang difference si Fi
and creamers dapat except for sign And then Iyung sign can be ignored kasi dito lang yan sa placing sa contingency table
so same pa din tayo 881 at 0.00 Okay same pa rin tayo with the computation of Excel yan so yan yung
magiging interpretation natin and then last one would be point by serial for the point by serial kasi um
sige delete ko na lang for the point by serial gagamit tayo uli ng Exel dito ha i mean Exel
function delete ko to para malinis yung ating ano this one iwhite ko muna yan So ano ul malinis Okay so again for
the point bas serial ang kailangan mo would be What kind of variables isang
continuous and isang dichotomous so in this case we have sex and then we have IQ so copy
natin So we have sex which would be female or male and we have IQ and then Let's go to point by skill
aan okay delete ko to Okay so for the sex na nominal pag sinabing nominal words siya
So male and female um hindi mo siya marun for Exel na correlation ayan na tahin mo
corel correlation nito saka IQ Ayan Magna yan kasi nakaw yung nakaw yung
um natin naka naka nominal pa siya So kailangan natin siya [Tawanan]
iquotientsolutions yung ginagamit sa algorithm so we will use the EXL function if so kailangan
i-quote Ah sige before ko iinput yung formula pag Gumamit ka ng if function um As I said condition
' So if ilalagay mo yung condition mo tapos napatunayan mong true yun ano yung ire-rate if b3 which would be Our first
cell is equal to male na salita so kailangan kapag word ang tina-type niyo dapat naka-close siya sa quotation
mark So if b3 is equ to male ano ire return ko if male ka if napatunayan mong male yung contain yung value na under ng
b3 re return mo zer if not 1 kasi Dalawang option lang naman siya e zer for male and then kung false ibig
sabihin hindi male yung nakasulat female so which is yung quantity or numerical equivalent niya would be
1 and then you can Drag down the formula na ayan so yan female one female one female one male zer female one Ayan Yan
yung condition without locking ha kasi din na-drag natin Pababa eh so wala ka
namang ila-lock na formula Ayan So yun na yung icor mo corel and then array 1 and then array
2 yan so 0.06 again maliit ano and then degrees of freedom 98 t ito uli so R Actually Ah pwede natin i-copy
to tapos yan ang kinagandahan sa Excel kasi pag kinopy mo and then tama yung pag-lock mo ng cells pag kinopy mo yung
ibang formula Ayan and then pinaste mo diretso na siyang maglu-lunch e no so in this case um let me highlight
lang Ayan So h3 yun yyung correlation natin So r and then times s root of h4 that would be your degrees of freedom
yyung n- 2 over root 1 - r s so root 1 - power f h3 2 and then computed Fe value would be Ay
sorry t.d. 2t so t distribution 2 um ano Iyung t value that would be located on cell h6 Ah sorry h5 So
0.625 h4 yung degrees of freedom so yan yung 0.54 so ang
natin would be h and height Oh sorry ako mali sorry ag and height Kasi IQ kasi so ulitin natin sex and IQ Kasi ba't naka
and height pa to so sex and IQ are um insign have
insignificant correlation with one another tapos R equ to
0.063 tapos or 0.063 and then p value equ to 0.53 4 greater than 0.05 level of
significance yan so sex and High Q have insignificant correlation with one another r equ 0.063 p value of 0.54
level of significance So pwede niyo din sabihin si x and IQ have negligible so again ang
negligible sobrang insignificant na hindi mo na need i-report have negligible or hindi mo magagamit yyung
correlation nila for um testing or for any kind of inferential statistic si x and IQ have negligible correlation
directa ka na with r equ 0.063 p value ch2 again sinipag ako mag-type p value
equ to 0.54 greater than level 0.05 level of significance so laging 0.05 yung level of significance natin na
common na ginagamit kasi We believe na 5% yung inaalat natin for margin of error margin of error
and 95% tay ung confident sa data Pero kapag Nag ma-master thesis na kayo dapat 1% lang yung margin of error
tapos dapat 99% kang confident sa data Okay so lagi naman tayong 0.05 kasi
Bachelor pa lang Okay so let's test the correlation using SPSS for the SPSS Ayan so try natin ha
analyze correlate may variate and then um tanggalin natin to okay for the correlation kasi as I
said continuous data Dapat ' ba so hindi niyo makikita dito yyung nominal data hindi niyo makikita yyung sex na naka
nominal Dito Ayan wala siya diyan Kaya kailangan magkaroon kayo ng another row which is yung ano natin
ah ah which contain yung numerical equivalent ng male and female niyo yun yung binary yung 0 10 one na ginawa
natin sa Excel so ang maganda dito pwede niyong i-copy na lang yan tapos directly paste niyo dito Ayan Same lang naman yan
so pagdating niyo sa analyze correlate by variate Ayan tanggalin natin to and then Andon ang ang ano yung
inaano natin IQ saka IQ saka Ayan sex and then ang Check natin yung Spearman Check natin yung pearson then click Okay
Ayan so correlation niya would be 0.063 equal siya doon sa computation natin
0.063 significant total niya 534 Ayan so Ayan din yung ano niyya So That's How You Run um the four correlation
techniques pearson R Spearman R PH coefficient and point by serial in Excel and at the same time in SPSS but um
always please Keep in mind not to check for the normality of your data first before running for the ano ah running
for the statistical test para malaman niyo kung nonparametric or parametric ang gagamitin niyo Pero not all the time
agag na-violate yyung normality of data non par agad so you need to considerate muna to be considerate muna bakit siya
naging non bakit siya naging ah ba hindi pumasa sa pagiging normal yung data niyo check niyo muna bakit
kasi baka naman may outliers na pwede nating i-delete or pwede nating i-transfer kasi mas mataas yung accuracy
ng parametric test kaya sa nonparametric so ah kung kaya naman i ang bawal kasi is data manipulation Pero kung kaya
naman i-transfer test pero pag hindi talaga kahit anong gawin nating correction or
data transformation talagang abnormal or yung data natin does not follow normal distribution do pa lang tayo gagamit ng
nonparametric counterpart So that's all for this video discussion regarding lesson 1 which is
correlation techniques
Heads up!
This summary and transcript were automatically generated using AI with the Free YouTube Transcript Summary Tool by LunaNotes.
Generate a summary for freeRelated Summaries

Understanding Correlational Research Design in Cognitive Psychology
This lecture by Dr. Arkwarma provides a detailed overview of correlational research designs used in cognitive psychology. It explains how correlations between variables are identified, interpreted, and statistically analyzed, illustrating key concepts such as scatter plots, Pearson's correlation coefficient, and multiple regression analysis.

Understanding Correlation, Sampling, and Experimental Bias in Research
This lecture explores key concepts in research analysis including the difference between correlation and causation, the importance of representative sampling, and how experimental biases like placebo effects and experimenter bias can impact study results. Learn practical examples and strategies such as double-blind procedures to ensure research validity.
Understanding Spearman's Rank Correlation Coefficient Rs Explained
This video explains Spearman's rank correlation coefficient (Rs), a measure of monotonic relationships between ranked variables. Learn how to rank data, calculate Rs using a graphing calculator, and interpret the relationship between wind speed and robot charging time.

Mastering Descriptive Statistics in Excel: A Step-by-Step Guide
In this tutorial, learn how to analyze single variables in Microsoft Excel using pivot tables. Discover how to count responses, calculate percentages, and compute averages and medians for effective data analysis.

Analyzing Data with Cross Tabulation in Microsoft Excel
In this video, we explore how to compare two variables using cross tabulation in Microsoft Excel through pivot tables. The tutorial covers setting up pivot tables, interpreting results, and visualizing data effectively.
Most Viewed Summaries

A Comprehensive Guide to Using Stable Diffusion Forge UI
Explore the Stable Diffusion Forge UI, customizable settings, models, and more to enhance your image generation experience.

Kolonyalismo at Imperyalismo: Ang Kasaysayan ng Pagsakop sa Pilipinas
Tuklasin ang kasaysayan ng kolonyalismo at imperyalismo sa Pilipinas sa pamamagitan ni Ferdinand Magellan.

Mastering Inpainting with Stable Diffusion: Fix Mistakes and Enhance Your Images
Learn to fix mistakes and enhance images with Stable Diffusion's inpainting features effectively.

Pamamaraan at Patakarang Kolonyal ng mga Espanyol sa Pilipinas
Tuklasin ang mga pamamaraan at patakaran ng mga Espanyol sa Pilipinas, at ang epekto nito sa mga Pilipino.

How to Install and Configure Forge: A New Stable Diffusion Web UI
Learn to install and configure the new Forge web UI for Stable Diffusion, with tips on models and settings.

If you found this summary useful, consider buying us a coffee. It would help us a lot!