Introduction
Welcome to the video series on analyzing survey data using Microsoft Excel. This episode focuses on basic navigation and manipulation skills essential for effective data analysis.
Understanding Rows and Columns
- Rows: Represent individual survey respondents, identified by numbers (e.g., 7, 8, 9).
- Columns: Contain various types of information, including response times, progress, and survey questions.
- Headers: The first two rows often include headers; it's advisable to keep only one for clarity.
Data Cleaning and Management
- Deleting Rows and Columns: You can delete unnecessary rows (e.g., incomplete responses) or columns (e.g., IP addresses) by highlighting and right-clicking.
- Editing Cells: Be cautious when editing cell contents to avoid accidental changes to survey responses.
Analyzing Survey Responses
- Types of Questions:
- Single Choice Questions: Easy to analyze (e.g., yes/no responses).
- Check All That Apply: More complex, requiring manual recoding of responses.
- Open Textbox Questions: Require translation into numerical data for analysis.
- Numerical Scores: Can range widely and are straightforward to analyze.
Adding New Variables
- Inserting Columns: You can add new columns for recoding responses by right-clicking on the column header.
- Multiple Sheets: Excel allows multiple sheets within a single file, enabling you to keep raw data intact while working on a separate analysis sheet.
Conclusion
These foundational skills in Microsoft Excel will prepare you for more advanced analysis techniques, including descriptive statistics, in the next video. For those looking to deepen their Excel skills, consider checking out Mastering Excel 2019: Perform Operations Using Formulas and Functions for a comprehensive guide on using formulas and functions effectively.
Additionally, if you're interested in data analysis beyond Excel, our guide on Python Pandas Basics: A Comprehensive Guide for Data Analysis can provide valuable insights into using Python for data manipulation.
For those preparing for the Excel 2019 exam, be sure to review our Essential Tips for Passing the Excel 2019 Exam to enhance your chances of success.
hello hello hello and welcome to your continuing video series all about analyzing survey data using Microsoft
Excel in this video we're going to be talking about some basic navigation and manipulation skills if you've used
Microsoft Excel in the past then you probably know some of this already however if you are new I would
pay close attention so that you learn quite a bit more about how the software works so let's talk about in the most
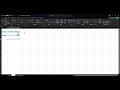
basic terms what we're looking at what is a row and what is a column so the rows start on the numbers over here
and I can click on 7 8 9 10 and so on each one of these rows represents one of our survey respondents and as we scroll
across the row we can see all of the information we have about each respondent so here's respondent number
nine and we can see that this person finished in 51 seconds and we can see the answers
to each and every one of their individual survey questions here uh on the far
end by contrast the columns are all the types of information we have so we have information about how long everyone took
we have information about the progress how far they completed things
and then we have each and every one of the survey questions which can be counted as a variable so this is a
variable this is a variable and this is a variable
okay the only information that's any different is rows one and two which are headers all they really tell us is what
what each one of these columns is supposed to represent and by the way Microsoft Excel
usually prefers to have just one header um and so qualx gives us two we can just delete the one on top because it's not
providing us any additional information so I'm going to right click I'm going to select highlight this whole first row
going to right click and I'm going to delete it okay now that we have um our header
set we can take a look at the contents of this some of this information as we've already talked about some of these
variables that come before survey questions are actually quite useful you might want to examine things like the
progress um the reason why is because maybe someone didn't finish the survey in that case do you want to keep that
survey responded maybe the answer is no so let's scroll through true there are a couple of ways that we could examine
this we could scroll all the way down and look for any number besides a 100 here's two of
them um and down here at the bottom here's a third one that only completed 50% a faster way to do that would just
be to sort the table uh and the way that we sort the table is by clicking this arrow button uh on the progress header
and we say sort smallest to largest or largest to smallest whatever whatever you prefer I'm going to go smallest to
largest and so right now at the top now I have the person who only completed 50% of the survey so let's take a look what
did they and did they not answer so I'm going to scroll over to the questions and it looks like this
individual responded to some questions but not others we've
got they answered are you a freshman they answer they got as far as this question have you declared a major
and then they stopped none of the questions after that got an answer do we think this is complete
enough of a response in order to consider it some people might say no um
especially if the questions that you have towards the end and are really important to your analysis then that
means this person can't really inform the whole thing so we could go ahead and delete that we can delete any column and
any row we want just like we did with the header so we will highlight this row and we will say goodbye to this
person okay now we don't want to go around deleting any variables that could be useful nor do we want to delete any
uh respondents that are appropriate to our analysis we have to be very careful with this skill but we can do the same
thing with a column if we want might be a good idea to delete your IP addresses because that's a way to identify
individuals so maybe we don't want that similarly we can edit the contents of any cell in the spreadsheet that we
want so none of this information is protected I can overwrite any of it I can fill in answers to
questions anywhere I want by simply typing in the cell so be very very careful as you click around
make sure you're not accidentally pressing buttons as you select random cells along the way because you could be
editing your data we definitely don't want to change people's survey responses Okay so we've seen a little
bit about navigation let's take a look at how variables can look so this survey
response has a good spread of different uh survey questions which is why I've chosen it so let's run through a few of
them this first question are you a freshman is a great example of a survey question that uh is a simple choose one
answer question it's either yes or it's no and so you see everyone's got a two or a one except for this person who has
a missing response to this question and most of them actually um they got through the survey they got a
92% but they didn't answer the questions this might be another person we might want to delete and so I'm going to
delete them too of course you'll want to go through and systematically examine your data set for cleaning I'm just
doing this on the fly to show you how things are done so this is what a good uh single
Choice question will look like you'll see twos you'll see ones those are the only answers that anyone can have and so
this makes the easiest form of variable to do analysis with however ever you may have asked some other types for example
you might have asked a question that included a check all that apply option which in general makes things harder
this variable in the T column is an example of that so you can see that the numbers are
Justified differently in the cell instead of on the right side they're on the left side and that's because Excel
doesn't know what to do with it here we have a respon that says 1 comma 4 this means that they checked
both one and four because response options like this exist we can't simply add things up
across the whole variable you would have to recode these things by hand and decide individually what it means for
someone to have chosen both of those response options that's why check all that apply
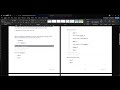
variables can be quite challenging to analyze we can also see an example of an open textbox question so this question
uh what major are you people were able to write in anything they wanted to this question
and so as you can see uh it's everything that people typed including whether or not they capitalize sentences or words
so that means that if you want to make use of this you're going to have to translate that into a number in some
way and last but not least we have an example of what it looks like to have a numerical score instead of uh 1 2 3 or
four choices uh people could have any score between 0o and 100 in this question and so we see the full range of
those numbers available okay how we handle each one of these variables obviously uh matters to our future
analysis as you've been learning in class as it relates to to doing those recodes uh you will probably need the
ability to add columns add new variables to your table the way that you do that is by
selecting say we wanted to put a new column right after this one so that we could assign new codes to it new numbers
so we could select the column that comes after it click right right click and then click insert and so now we have a
whole new column that we can do anything we want it's totally blank maybe we'll call it recode and we'll
assign uh new numbers here wherever we need to you could also insert a new row but that's inserting a new respondent by
hand and we don't want to do that for this project in particular the last thing that you might
want to know about in terms of navigation is that Microsoft Excel is not just one spreadsheet per file it's
many potentially you can have multiple sheets all contained in the same file there's a really quick way to do that if
you see here at the bottom there's this little tab that says sheet zero and there's a plus sign afterwards if I
click that plus sign it'll create a completely new and empty spreadsheet this is actually really handy because
you can keep this as your raw data completely unchanged and simply copy and paste maybe just the parts that you find
most important maybe you want to select just your survey questions and not worry about the rest and you can copy
it and paste it into a new spreadsheet and now here's just your
survey data on a completely separate sheet and no matter what you do over here in your new sheet nothing will
affect the original anymore that means that even if you screw up you can always go back to that original data without
having to download or start over that's pretty handy you can even rename these for fun um and that will allow you
to keep track of what's what so those are some of the basics for navigating Microsoft Excel these skills
will help you begin analysis in the next video we will start to take a look at descriptives and descriptive statistics
In a Microsoft Excel spreadsheet, rows represent individual survey respondents, while columns contain different types of information about those respondents, such as their responses to survey questions, completion times, and progress. The first two rows often serve as headers, indicating what each column represents.
To sort survey data in Excel, click on the arrow button in the header of the column you want to sort (e.g., the progress column). You can choose to sort the data from smallest to largest or vice versa, which helps you quickly identify respondents who did not complete the survey.
When evaluating incomplete survey responses, consider the importance of the unanswered questions to your analysis. If critical questions are left unanswered, it may be appropriate to delete that response to ensure the integrity of your data.
To add a new variable, right-click on the column header where you want to insert a new column and select 'Insert.' This will create a blank column where you can assign new codes or recode existing responses as needed.
Survey questions can include simple choice questions (e.g., yes/no), check-all-that-apply options, open text responses, and numerical scores. Each format requires different handling; for example, check-all-that-apply responses may need to be recoded manually, while numerical scores can be analyzed directly.
To create multiple sheets in an Excel file, click the plus sign next to the existing sheet tabs at the bottom of the window. This allows you to keep your raw data intact while working on a separate sheet for analysis or summaries.
Be cautious when editing data in Excel, as any changes made to cells can affect your analysis. Always double-check that you are not unintentionally altering important survey responses, and consider working on a copy of your data to preserve the original.
Heads up!
This summary and transcript were automatically generated using AI with the Free YouTube Transcript Summary Tool by LunaNotes.
Generate a summary for freeRelated summaries
Mastering Descriptive Statistics in Excel: A Step-by-Step Guide
In this tutorial, learn how to analyze single variables in Microsoft Excel using pivot tables. Discover how to count responses, calculate percentages, and compute averages and medians for effective data analysis.

Master Excel for Data Analysis: From Basics to Interactive Dashboards
Learn Microsoft Excel for data analysis starting from the basics to advanced features like formulas, pivot tables, and Power Query. This comprehensive guide covers data cleaning, dynamic filtering, advanced lookup functions, and building interactive dashboards for real-world business insights.

Comprehensive Guide to Data Analysis and Visualization in MS Excel
Explore a complete tutorial on using MS Excel for data analysis and visualization, covering essential features like Power Query, Power Pivot, formulas, conditional formatting, pivot tables, charts, and dashboard creation. Learn data cleaning, transformation, and insightful visualization techniques from basics to advanced level.
Analyzing Data with Cross Tabulation in Microsoft Excel
In this video, we explore how to compare two variables using cross tabulation in Microsoft Excel through pivot tables. The tutorial covers setting up pivot tables, interpreting results, and visualizing data effectively.

Mastering Excel 2019: Perform Operations Using Formulas and Functions
In this comprehensive guide, we explore the key domain of the Excel 2019 exam focused on performing operations using formulas and functions. Covering essential topics such as inserting references, calculating and transforming data, and formatting text, this video provides valuable insights and practical tips to help you succeed in the exam.
Most viewed summaries

A Comprehensive Guide to Using Stable Diffusion Forge UI
Explore the Stable Diffusion Forge UI, customizable settings, models, and more to enhance your image generation experience.

Kolonyalismo at Imperyalismo: Ang Kasaysayan ng Pagsakop sa Pilipinas
Tuklasin ang kasaysayan ng kolonyalismo at imperyalismo sa Pilipinas sa pamamagitan ni Ferdinand Magellan.

Mastering Inpainting with Stable Diffusion: Fix Mistakes and Enhance Your Images
Learn to fix mistakes and enhance images with Stable Diffusion's inpainting features effectively.

Pamamaraan at Patakarang Kolonyal ng mga Espanyol sa Pilipinas
Tuklasin ang mga pamamaraan at patakaran ng mga Espanyol sa Pilipinas, at ang epekto nito sa mga Pilipino.

How to Install and Configure Forge: A New Stable Diffusion Web UI
Learn to install and configure the new Forge web UI for Stable Diffusion, with tips on models and settings.

If you found this summary useful, consider buying us a coffee. It would help us a lot!