Introduction to MS Excel for Data Analysis
MS Excel is widely used by over 81% of businesses as a powerful tool for data analysis and visualization. This guide covers Excel’s core capabilities such as data cleaning, transformation, modeling, and analysis to derive valuable insights. For an in-depth tutorial on foundational Excel skills, consider exploring Mastering Basic Navigation and Data Manipulation in Microsoft Excel for Survey Analysis.
Basic Excel Interface and Data Entry
- Navigating the Ribbon: Home, Insert, Page Layout, Formulas, Data, Review, and View tabs.
- Formula Bar: Enter formulas and functions for calculations.
- Worksheets and Workbooks: Managing multiple sheets and saving files.
- Data Entry Best Practices: Adjusting column widths, merging cells, formatting text and numbers.
Essential Excel Functions and Formulas
- Basic Operations: Addition (+), Subtraction (-), Multiplication (*), Division (/)
- Autofill and Flash Fill: Automatically extend data series and extract text patterns.
- Text Functions: CONCATENATE for combining cells, LOWER, UPPER, PROPER for case formatting, LEN for character count, LEFT/RIGHT/MID for extracting substrings.
Data Sorting and Filtering
- Sorting: By date, text (A-Z or Z-A), numbers (largest to smallest), or cell colors.
- Advanced Sorting: Multi-level sorting based on multiple columns.
- Filtering: Using auto-filters with conditions for text, numbers, dates, and color.
- Using shortcuts like Ctrl+Shift+L to toggle filters.
Conditional Logic in Excel
- IF Statements: Define conditions returning specific results.
- AND/OR Functions: Combine multiple logical tests.
- Application examples like bonus calculations or employee inclusion criteria based on department and country.
Date and Time Functions
- Retrieving day, month, year, hour, minute, second from date/time values.
- Adding or subtracting days, months, or years using EDATE and simple arithmetic.
- Formatting dates with custom display options.
Data Validation and Error Handling
- Restricting inputs to valid date ranges, numeric limits, text length.
- Creating dropdown lists for categorical data.
- Custom error messages guiding data entry.
Lookup Functions for Data Retrieval
- VLOOKUP, HLOOKUP for vertical and horizontal lookups.
- Limitations like left-to-right and top-to-bottom lookup constraints.
- INDEX and MATCH functions combined for flexible, dynamic lookups.
- XLOOKUP as an advanced, versatile alternative supporting two-way lookups, exact matches, and error handling.
- Using lookup functions in data validation to create dependent dropdowns.
Data Visualization with Charts and Pivot Tables
- Creating Pivot Tables to summarize large datasets dynamically. Learn additional techniques in Analyzing Data with Cross Tabulation in Microsoft Excel.
- Using slicers with pivot tables for interactive filtering.
- Chart Types: Column, Bar, Pie, Tree Map, Waterfall, Funnel, Scatter, and more.
- Enhancing charts with data labels, legends, trendlines, and slicers.
Advanced Data Handling with Power Query and Power Pivot
- Power Query: Import, clean, and transform data from various sources with reusable steps.
- Handling date formats and adding calculated columns such as age.
- For Python users or data transformation reference, see Comprehensive Guide to Python Pandas: Data Inspection, Cleaning, and Transformation.
- Power Pivot: Building data models by importing multiple tables and defining relationships.
- Creating measures for calculated summaries like monthly totals and combined sums.
- Using data models as source for pivot tables in Excel.
Dashboard Creation and Interactivity
- Combining multiple pivot tables and charts into a cohesive dashboard.
- Adding slicers and timelines for dynamic data filtering.
- Designing charts with appropriate titles, labels, and formatting for clarity.
Automating Tasks with Macros
- Recording macros for repetitive formatting and data validation tasks.
- Assigning macros to buttons for easy execution.
- Practical applications include sorting data, applying conditional formatting, and setting dropdown lists consistently.
This comprehensive guide equips users with practical knowledge and actionable skills to leverage MS Excel’s powerful features for efficient data analysis, visualization, and reporting, suitable for beginners and advanced users alike. To broaden your competencies further, consider Master Excel for Data Analysis: From Basics to Interactive Dashboards.
According to Forrester Research, more than 81% of the businesses use MS Excel. MS Excel is one of the crucial tools for a data analyst.
Excel provides us with all the features and functionalities through which we can clean, transform, model and analyze data.
And lastly, we can get some valuable insights. It has a lot of different features. For example, we can use Power Query to transform data.
We can use Power Pivot to model data. Lastly, using Pivot Tables and Charts, we can create amazing dashboards in MS Excel.
That's why WS Cube Tech has brought a complete free course in which we will learn how we can analyze and visualize data using AI-driven features.
This course covers all the topics from beginners to advanced. Also, if you want us to bring a free course on Analytics
with MySQL, you can comment in the comment box and show your support. And soon we will bring a playlist of Data Analytics with
MySQL for you. Also, if you want to become a successful data analyst and want to learn live data analytics from our experts, you can
call on the given number or fill the form given in the description. Not only that, you get 2 demo classes for free with each of
our patches. So let's get started. MS Excel is one of the amazing softwares.
And in today's video, I am going to give an introduction to MS Excel and a beginner's guide which will help you to get started with MS Excel.
So hello everyone and a very warm welcome to WsCube Tech. My name is Ayushi Jain. And from today, we are going to start a complete new
journey on the course of MS Excel. In this entire course, we are going to learn different functions that are used in MS Excel, different formulas
that we use in MS Excel, how we can create charts, how we can analyze data, we will learn about the pivot table, we will discuss different topics in this entire course.
And in today's video, we are going to talk about the introduction to MS Excel, and how we can start working on MS Excel.
So let's get started. First of all, all we need to do is go to the search bar and write Excel.
As soon as Excel opens, we have to go to the blank workbook. As soon as the blank workbook opens, a page like this will open here.
Now, let's go from top to bottom one by one. First of all, let me talk here. On the top, we have Home, Insert, Page Layout, Formulas,
Data, Review, View, Help. And if we select more things in the future, a few more new columns can also be created here.
So this whole area is called a ribbon here. In the ribbon, you will get different tools for everything. Like in Home, you will get data alignment tools, formatting
tools, there are tools for insert, delete, and format here. If you want some general formulas here, you will get them in the case of numbers here.
If you want to edit cells, we have an option here. Basically, we have a ribbon of Home. In Insert, again, we have some new icons.
Suppose if you want to insert a table, if you want to insert a picture, shapes, icons, or if you want to create a pivot chart, there are many such options here.
Similarly, in Page Layout, Formulas, Data, Review, View, we also have different tools that will help us throughout the course.
So on the top, we have a ribbon. Just after the ribbon, you will see that we have an option here where I am typing anything.
Whatever I am typing, it is being reflected in the cells below. This area is called a formula bar here.
So the second thing we have here, basically, if we want to give a formula to any column, if we want to give a formula to any cell in which we want to get some value, then we
will do all those things in the formula bar. We can pass formulas here. Moving ahead, the next thing over here is, like I select
the same thing, so here you will see that a whole grid has come to me. This whole grid is called a spreadsheet grid.
So all the things that I have selected here, even including the first cell, all this comes in the spreadsheet category here.
At the bottom, you will see that we have sheet 1. You can create multiple sheets here by clicking on this plus symbol.
And if you want to delete it, all you need to do is right-click on it and click on Delete. Again, right-click on it and click on Delete.
Just below that, you will see the status bar here. In the status bar, we have the option of zoom in and zoom out.
So let's keep it on 100%. If you want to zoom in and zoom out the cells here, then we can use the status bar below for that.
Also, if you have a table, you have to show the sum of the table, you have to show the average, you have to show the count of values, then all those things will be easily
visible in the status bar. On the top, we have the save button. You can save your worksheet by using Ctrl-S.
Or you can use this button here to save. As soon as you click on Save, you will be redirected to this page.
You have to save some data somewhere on your desktop. And here I have a folder named GNSX. If I want, I can save it here.
So in this way, we can save the data here. Coming back, to come back, there is a back arrow here. You can come back to your spreadsheet from here.
Now we have to talk about data entry here. You can start entering data from anywhere for data entry. It is not necessary that you start from here.
If you want, you can pick anything from the center. On the top, if you want to give any heading here, like these are your monthly expenses.
So, like I want to give here, January month expenses. So I can give it here like this. If I want to increase its size here, then I can increase
the size. Like if I want to increase its width here, I can increase its width like this.
Suppose you want to give any color here, then you can give color here. For color, I can just select this cell.
Let's go to home. Here you can see the paint option. Whatever color you want to pass here, you can pass that
color here. You can change the text color here. You can change it here.
Suppose I'll go with white. Again, if you want to increase the size of the cell here, then you can increase the size of the cell here like this.
So the size of the cell will increase here. So suppose you want to merge it here into different cells, then you can start selecting from here.
You will get the Merge in Center here. You can click on Merge in Center here. You have to increase the text size.
You will get the text size here on the top. So, January month expenses. I want to create a sheet here like this.
In this, we will start with providing the headers. First of all, let's take the date here. After the date, you have to move to the next cell here.
You can also use the right arrow key or you can also use the tab here. So, in the next arrow, we can take it here that you can
give my expense category here. In which category did I spend here? Plus, I have to give subcategory.
For example, I gave food here. I ordered food from Zomato here. Or I paid by going to the restaurant.
How to give subcategory here? So, you can mention it here. How much did I price it here?
And lastly, payment mode. I also want to see how much I am doing transactions with UPI, how much I am doing transactions with cash and how
much I am doing transactions with cards here. So, I can add payment mode here. Now, you will notice here that what is happening to me here.
For example, this is the date. This is the subcategory. Subcategory is not able to take up the space completely
here. So, in that case, I will go to E here and double click. Now, you will see that the subcategory is fixed here in the alignment.
Same goes with payment mode. The cell of payment mode has increased according to its width.
So, we can do these things here. In the case of date, I will zoom in a little bit. So, in the case of date, we start from the date here.
Also, you will notice that as I am choosing cells here, I am getting C here. C is in the column and 5 is the number of rows.
Which number of rows are we in here? Again, let's zoom in a little bit. So, let's start with the date.
First of all, I mention the date here. For example, I started here from 1st January. 1st January 2023.
After that, we mention the category here. Let's say my first expense was on food. I ordered food from Zomato.
I paid the price, let's say 300. And the payment mode was UPI. So, my data went into the first category here.
Again, you can see the alignment of the data here. 2023 is hidden here. Let's double click here.
So, you can see that the width of the cell has been adjusted according to your data. Also, you will notice that some things are aligned towards
the left and some things are aligned towards the right. So, you will notice that the numbers are aligned towards the right in the numbers category.
Else, the data in the text format or the date format is aligned to the left. So, you can also change the alignment here.
For example, you can pick any cell here. If you want the center alignment, you can choose the center here.
Moving ahead, I will talk about one more thing here. I will zoom out the data. You can't understand the headers or the table content by
looking at the data. So, in that case, if I select 4, it will select the whole row of 4.
Whatever changes I want to make in this row, let's say I want to increase the size of the text. So, I can increase the size of the text here.
I want to keep it bold so that it looks a little different. So, I can keep it bold. Now, it's a little better to understand here.
Let's increase the size here. And the rest of the data is the content inside the table. So, that is the table data.
Similarly, you can start inserting data inside the next row. For example, I want to write 2nd January here. 2nd January, 2023.
And then again, my expenditure was on, let's say, grocery. In the grocery, let's say, we bought fruits and vegetables. So, fruits and veggies. I will mention here that the price
that I have paid is let's say 400 and because it was a fruit vendor, I have paid it in cash. In this way, you can add data. Suppose you want to add a
row above here, then we have a shortcut for that too. Suppose I select it here, I will choose Alt-I and Alt-R, then I will have a row inserted above the row which I had
selected here. So if you want to add more data here, you can add it here. The same goes for column. If you want to choose a new
column for the column, then you can use the symbol Ctrl-Shift-Plus to add a new column. And if you want to undo this, then you can use Ctrl-Z to
undo it. Also, Excel provides you with a very good function that if you know that it is tabular data, then as soon as you
select it here, then you can press Ctrl-T, which will convert all your data to a table. In this, you can say that my table has headers, that is, it
will read the first row of your table as headers. And as soon as I click OK on it, I have data in a table format.
As soon as the table is created here, we have a lot of options at the top right. You can choose any color you want here and you can go with
the color that you already have. Which is a similar color from your January month expenses. So you can choose different categories here.
Another way to add a table was that you do Ctrl-Z here. So whenever you want to undo, press Ctrl-Z, select the table here and then press OK again.
Again, your table will be created here. So both the methods work over here that you can also use Ctrl-T to create a table.
Or you can directly go and click on Insert and go for Table. Lastly, we will click on Ctrl-S to save it. And wherever you want to save it, for example, I want to
save it in the datasets as January data. So as a January data, I will save it. And then whatever changes you want to make, you can save it
by using Ctrl-S here. The first function that I am going to discuss here is Autofill.
Autofill, as the name itself says, automatically fills the values in the order in which you are arranging it. For example, if I have numbers here.
If I start from here, for example, this is 1. Let's say this is 2. Now all I have to do here is drag it here by holding the
Ctrl key. So I will get the values here. So it increases the values here by understanding the
pattern. Not just numbers, if I talk about dates here. So last date is 15.
Suppose I am dragging it. Here I am dragging it by pressing the Ctrl key. So it is giving me 30th January 2023.
The data up to this point will easily open it for me and make fields like this. So guys, this is what Autofill is.
You can use Autofill on numbers. You can also use Autofill on dates. Moving ahead, let's talk about the second function here.
The second function of Autofill is FlashFill. Let's understand what FlashFill is. Similarly, the work of FlashFill is to understand the
pattern here and fill that pattern. Suppose I don't want the full name here, but I want the first and last name here.
So what can I do here? I can write John here. So I will write John here.
Maybe I will start writing Eugene here. You will see that this FlashFill is coming from FlashFill. All the first names are here.
Same goes for Yang. If I write Yang here. And I write H-U-A-N-G here.
You will see that the surnames are here automatically in every column. Now I can categorize this as first names and last names.
So first name and this one is last name. Let's set the size. And here we are done.
We don't have to sort them separately. If you want a small method, that is FlashFill. Suppose you don't have an option here.
In that case, you can go to Fill. In Fill, we have the option of FlashFill. You can choose and use FlashFill here.
And I am able to do it directly. In your case, you can go here and enable it. So this was the second basic function that you should know.
Moving ahead, let's talk about the third function here. The second function here is not just names. But if I talk about January here.
Now I had to take the data of January in such a way that I had to write January here. Let's say I just wanted first here.
Because I have written first here. Again, I want first here too. So you will automatically see that I will get suggestions
here. And I write second here. As soon as I press enter, all the dates that I have written here will come here.
So it works with text. It works with dates. Whatever pattern you see, whatever pattern Excel
understands here. It can FlashFill with that pattern. So I don't need it.
So I take control of it here. Moving ahead, let's talk about the third function here. The third function that we are going to discuss here is
text-to-columns. Text-to-columns means that you have data in some text format here.
Like I have comma separated data here. It is such a sheet in which you have electronics and devices.
And in this way, whatever categories are written here, which are written in a paragraph. You have to separate it into columns.
Then how you can do it is very simple. Suppose this is the data. Now I will choose the entire column here.
In the data, I have the option of text-to-columns here. Delimited means that it is separated from something. So here this comma is separated.
After delimiting, I will click next here. Next, you will see here that I have the option of comma chosen here.
As soon as I choose a comma, I have Afghanistan in one column and its abbreviations in the other column. And now let's click next here.
Next, we have to give a general here, we have to give a text here. We can also define this here.
What will be its destination? We can choose the destination here. So the destination would be, let's say, E column.
And again, let's increase it. And lastly, I finish it. So you will see here that I have some data.
Here are country names and abbreviations. Now we remove the abbreviations from the country names here. And we add abbreviations here.
So sorted. How easily we have converted any text into columns here. This function is very basic.
They can do literally wonders. If you had to do this one by one here, then it would have been a long task.
So guys, formatting the data here is very simple in Excel. Like if you want to format the data on the basis of anything, as of now, if I start here first with the font.
If we talk about font here. So I have to change the font of the cell here. If you want to increase the size, suppose this is a header.
I have to increase the size of the header here. So particularly, I have to increase the size of this here than this.
And if I want to increase the size of this whole thing, in that case, I will select this whole cell. And whatever size I want here, I will mention it here.
Again, let's define their width here. So here you can mention the sizes. If you want to apply any color to them, you can give a font
color. If you want to give a different font style to all of them. That they have a slightly different font style.
So I'll go with this one maybe. So in this way, we can give font style here. Similarly, if you want to bold something, if you want to
italic, underline, double underline. We also have these methods. If we want to give a border to something, for example,
particularly I have to give a border to this cell here. Then give a border at the top, bottom border, left border, right border, no border, all borders.
So if I have to give all the borders here, you can see that I have borders here. If I have to undo this, all I need to do is press ctrl z.
If I select them and then give a border here. Then I can do the same here. I can only give a border on selected cells here.
Okay. I need all this data here in bold. So again.
Although for now we have already set the font size here. But if you want bold and italics, you can do that here. And normal data.
If I talk about bills, let's make it bold. So you can see that it is bold now. Same goes with italics.
There will be a line here in the underline. In the case of double underline, we will add double lines here.
So we will remove all of them from here. Okay. We also have text color and font color.
Moving ahead and let's talk about their alignment here. If you want to set an alignment of a cell, you can definitely set an alignment.
Like I am talking about the category here. Now I want this bill to be aligned in the center. So all we need to do is pass the center alignment here.
Okay. If I want that I want this left or right alignment. So we can also take the right alignment here.
Again, all you need to do is select this. And right alignment, left alignment, center alignment. On the upper side, we have the alignments inside the cell.
In the cell also, you need data on the upper side. You need data on the center side. You need data on the down side.
So these are the different alignments. Also, you will notice here that I have bills written in these three cells.
So if I want, what can I do here? I can select these three here. Similarly, you can see that we have bills inside these
three. So if we had something like this here. I have bills.
Bills. And there are bills. Okay.
Now this is data inside the table. That's why we cannot merge and center it. But if I choose this.
Now if I click on Merge and Center. If we click OK, you will see that it has come to Merge and Center.
If I want to keep it in the center, we can keep it in the center. We have to give left alignment and right alignment.
We can also do that here. So this is all possible with the help of alignments. Moving ahead, if I talk about the amount here.
So in the amount, if I want to add their currency here. So all I need to do is select this. Here we can pass currency.
That rupees in Indian currency. If we had value in percentage style, we can pass that. If we want to increase or decrease the number of decimals,
then again you need to select the cell, decrease the number of decimals, if you want to increase then you can increase the number of decimals as well.
If we open this, then you can increase the number of decimals. All you need to do is click on this arrow over here.
This is how we can increase the number of decimals. Also, you can see here that we have different categories, general number, currency, so basically these are the
different types of data types which are in our per column. So, if we want to handle them, for example, let me talk about the date here.
For the date, let's open it here. Let's go to the date. For now, our date is 12 January 2023.
Now, it is coming in this format. If you want it in any other format, for example, you want the whole date to be written on it, then you can click on
OK, then the whole date will be visible here. Similarly, if I go back here, if I want the date in short, I want the date in the format of year, month and date, all
these things are possible with the help of formatting cells. So, let's take it in short, I click on OK, so I will get the date here in short.
Sorting data according to your priority is very important. And in today's video, we are going to discuss what are the different methods in Excel with which we can sort data.
So, hello everyone and a very warm welcome to WS Cube Tech. My name is Ayushi Jain and in this video, we will be talking about different methods to sort the data in Excel.
So, let's get started guys. So, guys, sorting data is very important according to your priority, according to your needs.
And Excel provides us with different methods, different ways with which we can sort the data. Also, it changes with the data types that we are handling.
For example, if I take a case here, suppose I have dates here. Now, I have the dates in ascending order here.
Suppose, I want to go with the descending order. If I had got these dates randomly here and I had to store it in descending or ascending.
So, all we need to do is click on any cell here. We will go to a home page. On the home page, you will see the option of salt and
filter on the right-hand side. And oldest to newest, if you want to go to the newest data from the oldest.
So, I will choose oldest to newest here. So, it will be sorted in that way. If I go to newest to oldest, then here 19th January is the
newest. And while 1st January is the oldest data. So, in that way also, we can sort it here.
In the same case, in the same table, you will see that I have the option of food. Let's zoom in a little bit.
So, in the same place, you will see the option of food here. In the option of food, the data we have here is in the text format.
So, again we have to sort it. So, if you want to sort it in A to Z ascending order. As soon as I choose A to Z, you will see not just this
column, but all the columns along it have been sorted here in the ascending order. So, B comes first.
That's why bills first, then clothes, then essentials, then food and lastly grocery. So, in this way, our data has been sorted here.
Same goes with amount. In the column of amount, I will choose if I want to filter the data on the basis of amount, then largest to smallest.
I want the lowest payments to come first. So, we will start from 10 here. Lastly, it will go up to 16,000.
And if you want or not, you should get the highest payment first. And then it will keep decreasing.
In that case, again you have chosen the cell. Select and sort. And here we will go to largest to smallest.
So, the highest values will come up first. And then it goes down to the lowest values. This is how basically it works.
Also, there are different methods on which you can do sorting. For example, you can sort the data on the basis of color.
For example, if you see in the payment mode, I have different colors here. For example, UPI color is a bit peachy.
And if I talk about the card color, the card color is a bit green. And blue one goes for cash.
So, I will choose this first. To choose, you have to go to this column. If you go up, you will see an arrow here.
As soon as I click on it, the entire column will be chosen. If I choose G, then the entire column will be chosen. But I have to choose this particular column in this table.
So, I will choose this. All I need to do is go on data. You will also see the sort option here in the data.
We choose this sort. After choosing the sort, we will get a pop-up here. In the pop-up, we have to sort by on whose basis you have
to sort. So, I have to sort it on the basis of payment method, on the basis of payment mode.
I have to do it on the basis of cell values. I have to do it on the basis of cell color. Font color is also an option here.
Or conditional formatting icon is also an option. So, font color is black here. But cell color is different here.
So, we will choose cell color here. In cell color, which one do you have to keep first? First, we have to keep the card on top.
If you want, you can also keep it on the bottom. And as soon as I click on OK, we will get the card on top. As soon as I click on OK, you will see the card on top.
But now you can also give multiple levels here. As soon as I select it again, I sort it. Here, the add level has come.
First, you have given that you want the card. Next, you want blue or peach here. So, we can also show that here.
Again, we have to choose the payment mode. Here, we have to choose cell color. Next, let's say I want cash here.
As soon as I click on OK, next, we have cash and lastly, we have UPI. So, we can also sort the data on the basis of color.
Now, not just this, but if you want, as we have sorted it on the basis of color, similarly, we can also sort two columns together.
For example, if I want clothes here, but I also want ascending or descending order in clothes. First, I have to sort it on the basis of category.
Let me show you after sorting it. Suppose, I want to sort this food here. Again, let's go to home, sort filter.
Let's put A to Z. Now, I have to sort the bills in ascending order. In bills, I have 1,074 first, then 1650 and then 16,000.
So, I want ascending order here. So, I have to put two levels of sorting here. So, for that, what will we do here?
Suppose, we will choose the sort again. In choosing, we have taken the category here. We have to go on the basis of category.
Cell A to Z should be there. This is our first level. Second level, what do we want here?
We want to get the amount here. We want to get the cell values in the amount and smallest to largest.
As soon as I click on OK, bills are here. In bills, we had 16,000 in the amount. But now, we have 1,074, then 1650 and then 16,000.
And same goes for clothes. We have clothes here. Here, we have 1,090.
We have 1,000 here because we have to add L in the spelling of clothes. And then, maybe I will just go for sort.
We have already sorted. Let's click on OK. 1,000 is above and 1,890 is below.
In essentials, the lowest value is 50. Then 120. In essentials, food and oil is 120.
Shampoo is 780. And same goes for food. In food, we will start with the lowest value.
The highest value is 890. In the table, you can also sort in multiple columns. We are using sort in two places.
On one side, we are taking sending order in categories on A to Z. And on the other side, we are taking ascending order on
numbers. So, these things can also work easily. Let's get started, guys.
First of all, I will open Excel. We will continue on the worksheet that we are already working on.
First of all, I am going to talk about filtering the data. To filter the data, we have different parameters. Also, we have different types of data filter.
For example, let's say I want data in payment mode. I want data only for UPI or only for cash. Here, you can see that
I can go to filter, then filter. We also have a shortcut that we can press CTRL, SHIFT and L. By pressing CTRL, SHIFT and L, you can see that filters
have been added. You can apply any filter here. For example, I want only cash data here.
I will discard the rest and press OK. And only cash data will be visible here. So, basically, this is how it works.
Similarly, if I want both cash and card data, then both cash and card data will be displayed here. Again, I will choose Select All.
I will press OK. So, all the data will be displayed here. Again, if you want to remove the filter, press CTRL, SHIFT
and L. Now, you can remove the filter. Again, we will choose a cell here.
Remember, as I have chosen outside, if I press CTRL, SHIFT and L, this will generate an error here that this can be applied to a selected range.
So, we have to choose any cell in the table. Now, we can press CTRL, SHIFT and L. In this way, the filter will be added.
Moving ahead, if I want to work on the text, the text is displayed here. Now, if I talk about the amount,
I have to work on the amount. Again, I can choose the filter that I want to apply here. You can remove Select All.
Now, what is the problem here? The problem is that I don't want to sort in ascending or descending, as you can
see here we have an option for sorting. So we don't want to sort but we want to filter. Let's say I want values above 1000, where I have shopped
above 1000. In that case, we can put number filters here. We can put greater than or equal to.
So greater than or equal to, I want to put 1000 here. As soon as I click on OK, all my expenses above 1000 will come here.
Like cylinder bill, mobile bills, house rent, dress or another dress. So this way I have data that the value is above 1000.
Again, we have to remove the filter. If you remove the filter from amount, the filter will be removed here.
Again, as I am telling you, let's click on this. Let's see number filters. So in number filters, we have a lot of values here.
You need top 10, you need a value between any range. Not equal to, greater than equal to, lesser than equal to. We have all these filters available here.
Similarly, now let's talk about text here. I would like to go into more detail in text. Like we talked about choosing from UPI Cash Card.
But if I open its drop-down, let's talk about text filters. I want text filters to begin with here. That is, whatever text I have here starts with C.
As soon as I click on OK, cylinder, tea and chocolate all start with C. So I will get the data of these three here.
Similarly, if I want to put any other filter here, I will click on text filters. You need ends with, you need contain.
Someone is getting double O, someone is getting double E. You need any such data. So we can put it here easily.
This is text filters. Let's clear it from here. And then let's talk about date filters here.
So we also have date filters here. If you want to put a filter on the basis of date. Now, on the basis of date, you need any date here.
Like we are talking about January here. But if you are dealing here in different years, in different months.
So you can easily get that. You need January data, you need February data. You need 2022, you need 2023, you need 2024.
We can add all these things here easily. So in date filters, we also have a lot of options here. Like you need someone's equal date.
You need before, you need after. You need tomorrow's date. So today let's say 11th of February.
So in 11th of February, you will not get tomorrow's date. But if I say here, next week, next month, this week, this month.
So how will you get all these things basically? If you are talking about the current scenario here, you need that.
You need the value of the last quarter here. You need the values of this quarter here. You need the values of this year.
You need the last year. So you need all the dates of January. Right now, we have this data of January.
So if you want all the dates of January. There are four quarters here. First three months, next three months, then next three
months. And lastly, last three months, we have data like this here. So we can apply a lot of types of filters here on dates.
And lastly, I am going to talk about the filter here. The way we shorted with color, we can also filter things by color.
Like I put it here, filter by color. I need a filter here. I just need the color peach.
So all the UPI payments will be visible. Similarly, again, I clear the filter here. I need filter by color here.
Green. So the green color column will be visible here. So this way we can apply different filters in MX Excel.
I will clear it here. You can also apply a filter here in the data. So I removed the filter here.
And if I put the filter again, the filter will come here again. If you want to clear it, you can clear it from here too.
Any filter that we have applied. And if you want to put the filter here again, remove it. So for that, again, the filter option.
So first of all, if we talk about basics here. So in basics, when we talk about basic operations. That is addition, subtraction, multiplication and division.
And if we talk about Excel here. So Excel gives us so much easiness. Like if I click on both of them here.
So you will see down here that I have the sum here. That is 350. The count has come that there are two cells.
Which I have selected. And the average value of both of them is 175. Similarly, if I right click here.
So you will see a lot of things here. If you want the minimum value here, you can get it here too. If you want the maximum value, you can get it here too.
Like I have clicked on maximum here. You can see that the maximum value here is 200. So whatever things you want to add here.
You can add all those things here. You have to add the numerical count. You have to add the minimum value.
Or whatever you don't want to be here. You can also remove it from here. So this is the first thing.
How we can get basic functions and basic things here. Secondly, if we want to apply the addition formula here. Between the cells.
So it is a very simple task for that. What do we have to do here? Like I want the addition of both of them here.
All I need to do is write equal to. After equal to, which is our first cell? A2.
And we will put a plus symbol in this. And we will select the second cell. That is A3.
A3 means here. A2 and A3 means here. That A is in the column.
2 is the row number here. 3 is the row number here. And as soon as I press enter here.
The addition of both of them. That is 350. I will get it here.
Similarly, we can do the same thing with functions too. That we have functions in Excel. For functions, all you need to do is.
So I am going to take the value in the fifth cell here. In the fifth cell, again we will put equal to. We will use the sum here.
Whose sum do we want to get? Again, we will choose the cell here. This one.
Now we do not need to apply the operation here. Because we have used the function of the sum name here. So I will put a comma.
I will pass A3 here. We close the parentheses here. As soon as I press enter.
Again, I will get the same output here. That here we have just put equal to an operator. And we have used the sum function here.
The same goes for subtraction. For subtraction, all you need to do is. Equal to.
After equal to, we will select the first cell. Minus the second cell. As soon as I press enter, the output here.
That 200 minus 150 is 50. Next, we will talk about multiplication here. If I talk about multiplication here.
Both of them have to be multiplied here. Again, for the multiplication operator. I will put equal to here.
We have to select equal to the first cell. And for multiplying, we will be using the asterisk symbol. Then we select the second cell here.
As soon as I press enter, I will get the multiplication. Also, what we can do is. Write equal to.
Product. And product of. Again, we will choose the cell here.
By putting a comma. The second cell. And I will close the parentheses.
As soon as I press enter. Again, I will get the product here. So both methods are here.
You can also use the function here. In this case, I have used the product function here. In this case, I have used the sum function here.
Or you can also use the operators directly. Lastly, I am going to use the division operator here. For this, I will be writing equal to.
Select the cell. For dividing, slash. That is a forward slash.
And as soon as I press enter. I will get the division here. That 12 when divided by 3.
Gives us the quotient 4. So these are our basic operations. Basic formulas.
Basic functions. Now, next thing. I will talk about cinema hall here.
Here, the way to solve the board mask is. First solve the brackets. Then order.
Then divide. Multiply. Add.
Subtract. So even the formula. You have to give in this format.
The things you have to solve first. On priority. That will go in the brackets.
In the brackets. Here. Brackets.
Order. Divide. Multiply.
Add. Subtract. It will work here.
Now here. As if I take an example. As an example.
I am going to talk here. Like I have food here. Seats.
Seat price. That is 250 here. Three seats.
Then. Seat price. 350.
Seats. Seat price. Multiply.
Seats. Seats. OK.
And then add. Seats. Seats.
OK. Then add. Seats.
Seats. Seats. Seats.
Seats. Seats. Seats.
Seats. Then, multiply. Seats.
Seats. Seats. Seats.
If we want we can close it in brackets We will close it in brackets And inside this we will add 250
And when I will press enter, I will get 1300 output Which we actually wanted So basically the follow rule here is of baud mask
Like we have been learning since childhood That is brackets, order, divide, multiply, add and subtract So I hope guys these things will be clear here
How we can build basic formulas here How we can use basic functions here If we will drag in the status bar below
Then how we will get the value For example, if I drag this here Then I will get sum, maximum, count and average
Even if I drag this whole thing here Again count, average, maximum and sum value will be obtained here
So we can do these things here So guys for text functions I have already opened a sheet
In which I have prefix, first name and last name First of all, we will talk about all the functions one by one We will understand their explanation
And then we will know them practically For example, I will talk about concatenate function Concatenate function works here
If you have different columns and you want to merge them Then you can use merge function You can also merge data from merge function
you can use concatenate method to get all the data in one cell. How to use concatenate method?
All you need to do is write equal to concatenate. After concatenate, select the first cell, comma, second cell, comma, third cell.
Close the bracket and press enter. You will notice that all three cells are joined. Now you will notice that there is no space between the
three cells. To give spaces, simply add two commas. In between these commas, we will give spaces like this.
As soon as I press enter, you will see that the names have come here. After doing this, as soon as you double click, all the data
in this column will come as it is. Moving ahead, let's talk about the next x function. That is lower case.
If we want to convert all these to lower case, all you need to do is use lower function. For that, we will write equal to lower.
We will pass in lower that I want to convert this to lower. As soon as I press enter, the data will come in the lower case.
If you want the same data in the upper case, we will use the same method. Equal to upper.
By mistake, I have pressed enter. As soon as you see the formula, you have to click on the tab button.
After upper, we have to select a cell and convert it to upper. As soon as I press enter, it will be converted to upper.
Next is proper. Proper means that the first letter will be capitalized and the rest of the letters will be small.
Because it is the format of our proper name. For that, again, equal to proper. And we will choose this cell here.
Let's close it and press enter. So now we have data in the proper format. Similarly, length function.
Now the length function works by counting the number of letters here. For example, let's put the length function on the first
name. So I will put equal to length here. After choosing the length, we have to choose the cell here.
Let's close it. As soon as you press enter, its length has come. All the cells need this data.
Double click, you will get this data in all the cells. Just you have to go in the corner, double click, double click and double click.
So we have all the length of names here easily. If you want to adjust them, you can do it. To make it look much better.
After that, the next thing we have is left, right and mid. Now I will explain to you what is left, right and mid. So let's do one thing in the case of upper.
In the case of upper, I make some changes here. Instead of upper E2, let's take another cell here. I take upper B2 here.
And same goes for all of them. And you will notice that as I have made changes here. Because I had taken the data of this cell here.
So dynamically it has changed here too. Now let's move towards left, right and mid. Let's understand the concept of left, right and mid here.
You need some letters from the text. In that case, you need the first letter of the text. You need 2-3 values of the starting of the first.
So in that case, we can use the left. All you need to do is right, left. And we need the text here.
We will choose the text of this cell. If you do not pass the number of characters. The default value is 1 here.
So the first letter will come here, that is G. Similarly, if you pass the number of characters here. No, you need 3 values.
And then we will press enter. So John will come. But because its name is 3 letters here.
So the full name has come. But in the case of others, the starting value of 3 letters will come here.
This you can do with the months. Suppose you have 3 values of the starting of the month. This is January, February, March, April.
So Jan, Feb, March, Mar will come to you. So if you want data like this. Then you can easily obtain it.
Suppose with the right, if you want the data of the right. That is, you need 3 values of the last in this text. You need the value of the last.
So in that case, all you need to do is right. Equal to. We will write right.
To choose the cell, you can choose any cell. I will choose this cell here. Close and press enter.
So the last text is N. So the last letter N will come to us. And the same goes for all of them.
By double clicking it. Mid means here. If you want any value of mid here.
Then you can define mid here. Like. If we want the mid value of any name.
So for mid, we will take here first. Equal to. We put mid here.
Now from mid, the parameters have come here first. Okay. We want text here.
Which text do we want? We want the starting value and the number of characters. Okay, so I want the text here.
So let's say this one. Starting value is of center. So it starts from 2.
If you want to start from 5, you can. Start from 2. And come to me up to 3 characters.
I will press enter. So there were not 3 characters in this. But in the case of the rest, 3 characters will come to me
in the middle. Which starts from 2. So UGE came to me.
UBE comes in the ribbon from 2. So 3 characters came to me here. So if you want to obtain this, you can easily do it with
the help of Excel's text functions. These were some basic functions. Let's talk about some more advanced functions.
Because it is associated with text. In these, first comes Find function.
So for find, I will take a text here. Let's write fine here. We have to find.
Like I have to find some data from this name. So I have to find which number is O. To find, we will write here.
I will press tab here. What we have to find? We have to find alphabet O.
From whom we have to find? Let's say we have to find from John. So we will define cell here.
Let me try once and show you these two things. As I write here, it will tell me on 2 number. But instead of this, instead of G2, it would have been F2,
in which John is also written. Let's change this formula a little. F2 We will not get this value here.
But while at the same time, if we would have seen this for G2, we would have got the value here. Because it is case sensitive.
Similarly, search is not case sensitive. Like this, we have a search. If I write the same thing here, that is, is equal to we
will search alphabet O. From whom we have to search? Let's say, I will take the same concept here.
Let's say, I have to search from F2. As soon as I press enter, I will get this on 2 number, which I was not getting in
this case. So search is not case sensitive here. But find is case sensitive.
Next, we have replace here. If we have to replace any value. Like here,
John is written. I want JIN. So in that case, we will use is equal to replace. And after replace, from which text we want this?
So, I will take here, John. You can see the formula here.
From where it should start? It should start from 2nd number. How many numbers you have to replace?
I have to replace only one number. That is, O has to be replaced. From whom I have to replace?
I have to replace it with I. I will pass I here, in double quotes. As soon as I press enter, instead of John,
I has not come in small. So, I will add it in small. And again, I will press enter.
Instead of John, it has become JIN. So, this was replace. And lastly, we have one more text function.
There are many text functions, but we are covering some basic and important text functions. Lastly, we have substitute.
In substitute, I will take here, is equal to substitute. In substitute, we apply the formula here. That is equal to substitute.
In substitute, we have text, old text, new text. That is, you have to give old text in any text. And what new text you have to add, you have to mention here.
How many times it should happen? For example, in Eugene, 3 times E is coming. Let's try substitute on this.
I am taking here, first G3. On whom I am talking? On whom I am talking?
It should convert in I. We will pass I in double quotes. As soon as I will close it,
I will enter. In that case, we will have E, U, G and I. Again, I guess,
I have taken in capital. Instead of capital, we will add in small. Again, I will press enter.
So, it has become Eugenie. And if you want only one instance, to convert only once, in that case, you can give fourth parameter here.
That is one time. Again, I will press enter. So, you will see last value here.
Earlier, it was UIGINI. Now, it is UIGINI. It means, it has been converted only once.
So, these are some of the text functions, which we have seen in this video. I hope, you don't have any doubt or question in these text
functions. So, let's get started guys. I am going to take an example here.
Let's zoom in. So, here I have some data in this format. I have employee data, employee full name, job title,
department. gender, age, hired age, country. First of all, we will talk about the basic conditions.
If you want to apply any basic condition of greater than or less than then how can you apply it? We are going to see that here.
So, if you want to apply greater than condition in that case you don't have to do anything. If you want that here you can get all the ages which are
greater than 50. So, all the employees whose age is more than 50 can be found here.
All you need to do is greater than 50. As soon as I press enter it will give me true. It will tell me how the conditions are working here.
Whatever condition we have given is it true or false? If I double tap on the corner it will give me true and false for all.
Where our condition is satisfying it is true and else it is false. But what if I have to give data according to me that if it
is more than 50 then that person is a senior person. Or we have to give them a bonus that by the end of the year whoever is above 50 we have to give them a bonus of 5% or
10% of their salary. So, in that case what we will do here as I am going to use if condition we will write is equals to if our condition
will be if the age is greater than or equal to 50 in that condition I will write bonus and I will write no bonus here.
Now, you will notice that whenever we have to write a text we will write it in double quotes otherwise, if we have a column or a number then we have to pass it directly.
So, I have given a condition here that if the age is greater than 50 then in that case greater than or equal to 50 in that case I have to show bonus here else I have to
show no bonus. As soon as I press enter bonus will come here double click here so, wherever we have to give a bonus for example, the
first three ages are 55, 59, 50 there is a bonus at the age of 26, no bonus at the age of 55, 57, bonus at the age of 27, 25, 29, 34, 36 at the age of 27, no bonus
So, in this way also we can use if condition statement Now, along with if we have two more operations that is AND and OR
AND and OR means the two conditions if you have more than two conditions which you need to satisfy for example, I want list of all the employees which are in IT department
and in United States So, I have to include employees of United States in a column so, I will use AND here how to use AND?
First, we will give if here with equal to we will put AND here now, in AND we can give as many logicals as we want for example, as you can see here we have logical 1, logical
2 and so on so, my first logic here is department C2 should be equal to IT so, we will give IT in double quotes I guess I have pressed enter by mistake so, double equals
to we will give IT here second condition is second logical that country should be United States I can also use single equal to in Python we use double
equal so, I have used double equal here but we can also use single equal to and for our country we will select a column that country should be equal to United so, in that
condition our first condition is one should be of United States and other should be of IT if these two conditions are true in that case, we have to include it in our program
else, we don't have to include it so, in that case, we will write included else excluded we will it here when I will press enter first one is included
because it is in IT department and United States now, we will double tap here you will see, second one is excluded even though it is in IT department but it is not in United
States it is in China so, it is excluded third one is also excluded because it is in United States but it is from finance department so, AND means if both conditions are
satisfied only then it will be executed only then it will pass true else, it will give another let's see the formula first, let's talk about AND what we
have passed here is IT department and United States country in that case, it is included which is
IF part else, it is excluded so, in this way, our conditional statements work here I guess, I have made some mistake here so, let's press ctrl
z so, in this way, our AND operation works here lastly, let's talk about OR operation in the concept of OR operation, let's consider let's say, this time
I have to give a condition here that all the female employees and all the employees may be male, but they are in China so, I have to include their data in this program
all female employees AND all female employees or any person who is in China in that case we will give a condition here that if I will put
here that is equals to if we will use OR statement here in OR, what will be the first logical that either they are female that means, our gender here that should be equal to
I guess, I have entered here so, that should be equal to female and my second logical should be that person should be from China so, G2 should be equal to China that means,
that country should be China now, out of these two conditions one should be satisfied, either she is female or she is from China even if she is male, but she should be
from China in that case, we will include her here, I will write included, else I will write excluded as soon as I enter here the first one is included why?
she is female for the second one we will double tap here the second one is also included but she is male but she is in China, so she is included next is female which is
included female which is included in excluded, we will see here in excluded, she is from United States and male, so she is excluded so, if one of the two conditions is
satisfied here, either she is female or she is from China in that case, we will use OR here, when we need one of the two conditions now, it is
not necessary here to give only two conditions in OR to give only two conditions in OR the number of logicals you want to increase you can increase that number of logicals
so, here I have put some different categories that if we want to use different functions here, then how we can use them, first of all if I want to get today's date then I
have to use a simple function of date function that is today, so I will write here is equals to today open close the parenthesis as soon as I press enter, you will see
I have got today's date that is 13 February 2023 similarly, now function brings date and time here like, if I write here is equals to now and open close parenthesis we will
press enter so, we got today's date as well as today's time that is 4.10 similarly, if you want day here whatever date we have put here we want its day here, so in that case what
we can do here, we can write is equals to day, open the parenthesis here serial number means we will pass column, whose date we will equal, I will
to know that here I have the first parameter of date that is day is 13 after 13 comes next thing, here month if we want month here then we have a very simple method that
again we pass month here that is equals to month for month also we will pass date here I will close it as soon as
I press enter, I will get month that is 02, if you want year here again for that we have is equals to year we pass value here and we will get year here that is 1023, suppose
you have not given values like this you have written here 18 06 2022 you need a combined date here in that case what we can do here we will write here is equals to date
I guess I have pressed enter so is equals to date in date you can see the format here first comes year then month and then date so year comma month comma day and I will close it
here and press enter, so here I will get 18 06 2022 similarly you want to get current hour here in that case we can pass here hour that is equals to hour we pass date here
that I want current hour here or if after hour I will pass my serial number here and as soon as I close it, I will press enter then it will be 16, 16
it is 4 o'clock, if we talk about minutes here you will see that automatically data is also changing here because here we have used functions of now, today if I open tomorrow,
then tomorrow's date will come here if I see now, then tomorrow's time will come here I have added the date format items in here.
If we talk about minutes here, I want minutes here, so in that case, simply equals to minutes.
Let's choose our date here. Let's close it. If we press enter, we will get minutes here.
I guess I have done something wrong here. I have taken minimum value instead of minutes. So, I will take minute here.
So, this one is the minute. In minutes, we will pass the value here. Let's close it and press enter.
I will get minutes here. As you can see, we have got minutes in this format. Moving ahead, if I talk about seconds here.
Again, we have a function called seconds. So, I will take seconds here. Seconds.
Let's pass seconds here. I guess I made a little mistake here. I have taken seconds here.
Let's remove it from here and then we will press enter. We will get value in seconds here. Similarly, moving ahead, let's talk about some other
functions here. For example, I want to get the date 3 days later or 3 days earlier.
So, we have a very simple method for that. Suppose, what we have to do here. You have a date.
We will take the date column here. So, today we have a date column. I will pick the date column here.
We have to minus 3 from this. As soon as we press enter, today's date is 13. If I will get minus 3 here, then the date will be 10th
February 2023. Similarly, if I have to get plus, then in this case, we will write plus in this formula.
Let's press enter. 13 plus 3 is 16th February 2023. Same goes for months over here.
In the case of months, if we have to add months, then we have to add a separate function here. That is edate.
I will use edate here. I don't know why, but we press enter again and again. So, edate.
We have to give the start date here. So, this is our start date. Comma, how many months do we have to add in this?
Let's say, we have to add 3 months. As soon as I press enter, I have the format here. Let's change the numbers and set the short date.
So, you will see 13 here. Today is 3 months, it will be 13. As today's date is 13.
And 13th of May 2023. Similarly, if you want to minus, you can do that. Okay.
Now, if we want to increase the years, then in that case, what can we do? In other cases, we have directly added edate here.
But here, we don't have any other function. We will have to use edate only. How will we use it?
We will write edate here. Okay. Let's give the starting date here.
This is the starting date. Comma. What can we do for months here?
Let's say, I have to add 3 years here. 12 multiplied by 3 will be months. So, you can write 12 times 3 here.
You can close it. Let's close it here too. And press enter.
We will get the value here. Again, let's convert it to the short date here. As soon as it is converted to the short date, it is 2023
here. And let's add 3 years. It will be 2026 here.
Similarly, we can also minus the values. Just do this much that if you want to increase the years, you can do 3 times 12 here.
Because there are 12 months in a year. So guys, these were some basic date and time functions. If you want to get the date from these, you can easily get
the day too. For example, if I talk about now here. I have to get the day here.
There is a very simple method to get the day. We will go to custom here. We will go to custom and go to more number formats.
You can see here. In custom, we are getting day, month, year, hours and minutes.
Let's remove it from here. I start writing here. We have 2013 here.
If I pass one more day here, I will get here that it is Monday. As soon as I do OK here,
I will get values like Monday, Tuesday, Wednesday. So as an example, I am taking a sheet of expenses here.
So this is January expenses sheet. Where I have dates, category, subcategory. How much amount has been spent on it.
Whether that payment has been done in cash, UPI or card. So we have all these details here. Now I have to get the sum here first.
Whose sum do I have to get? Obviously, we will get the sum of the amount here. So for the sum of the amount, all you need to do is select
this. You will also get the sum at the bottom here. The sum is 30,149.
You will get the average value. You will get the count that it is 29. You will get the maximum value here.
You will get all these things here. If you want to do this formula, you just have to write that you have to get the sum here.
Whose sum do I have to get? We are going to take the whole range here. Because this is the range of the table.
So as soon as I press enter here, 30,149 has come here. But what if this table was not there and it was just a range like this.
Suppose this range would be like this. 34, 67, 88. I have taken 3 values here.
If I want to get their sum, I can easily get their sum by writing. Now in this case, we don't have to do this.
We will put equals to sum here. And as I have chosen the whole range here, in this case, we can also choose by dragging these three numbers.
And as I will close here, I guess I have made a little mistake here. So I will choose it again here.
And by choosing these three, we will press enter. So the sum of these three will come here. Suppose I make the value 0 here.
So I will have the sum of these two here. The sum of these two will remain here. I will also make the value 0 here.
So I will get only 34 here. So not just on a table, but it can also work on any range. You just have to drag and choose the range for which you
want to get the sum. Okay. So let's remove this part from here and move towards here.
So we have got the sum here. But what if I want to get the sum of all my UPI payments. When will the sum be the payment of UPI?
So for that, we will write SUMIF here. First of all, we have to take the range here. What is the range here?
The payment mode is our range. What will be the criteria after putting a comma? What should it be equal to?
I want all the UPI payments here. So for UPI, I will pass UPI in double quotes here.
Comma. Now we have to put a sum on the sum range. We have to put a sum on the amount.
We will close it and press enter. So for all my UPI payments, the count here is 23,682. So in this way, we can get the value sum here on the basis
of any one condition. But what if we have to get it on the basis of multiple conditions?
So in that case, what can we do here? We can use SUMIF here. I want the payment from UPI while at the same time, it is
the category of food. I want the sum of food category from UPI. I want the sum of food category from UPI.
I want the sum of food category from UPI. For that, we will use SUMIF here. Now the formula itself tells that we have to get the sum
from the sum range. So we need the sum from the amount. Next is criteria range.
What should be the payment mode? UPI. Which criteria are we on?
UPI. Now we have the next criteria. The next criteria is the category that we should have.
That should be food. So we will mention food here. As soon as I enter here,
I will get the sum of UPI payments. The total is 1712. The total is 1712.
What if it was in cash? Let's make it easy. I will write cash instead of UPI.
As soon as I enter, I will get 530. There are some less payments here.
Out of all the cash payments, I have only one payment in food. Rest of the cash payments, there is no food in them.
So we have two categories in total SUMIFs. One is payment from cash and the other is in food category. The two multiple conditions that we have here, that comes
in the category of SUMIFs. You can add more if conditions here. The same goes for count.
If we want to get the total count, all we need to do is write equals to count. Who do we need the count for?
Let's say we need the count of payment. Let's close it and press enter. There are 29 values here.
I need the total payments from UPI. I need the count of all UPI payments and the count of all cash payments.
In that case, we can write count if. I have pressed enter again by mistake. Let's write count if here.
After count if, we need to choose the range. What should be the criteria for the range here? It should be cash.
I will close the parenthesis and press enter. I have 9 payments from cash. So out of 29, 9 payments are from cash.
Similarly, if you want to give multiple if conditions in cash, you need to give multiple if conditions with count. In that case, we will use count if here.
Let's see the formula. We are going to take count if here. First of all, what will be the criteria range?
Our cash payment should be what? Cash. Payment mode should be cash.
Second criteria is category should be food. Let's take category. I made a small mistake here.
Let's choose a category and put a comma. What should be the category here? Capital FWD.
Close it. Let's press enter. So in countif, only one payment is like this in food
category. Like we saw in sumifs that only one payment was like this. We had only one sum which was in cash category.
That was 530. We got the same thing in countif that only one cash payment is like this.
Which is in food category. Rest are in different categories. So this is how sum, sumif, sumifs work and countif,
countifs work. Similarly, average, averageif and averageif also work. So guys this was my expenses sheet which I had created for
January. Now I have to validate this data. So in that case, suppose I enter some wrong data in the
date. Suppose I enter more or less amount. Or I write letters instead of digits.
Suppose I make a mistake in payment. So there can be many mistakes. Suppose I write February instead of January.
By mistake I wrote 02. Or I wrote 2022 instead of 2023. So because of these things we don't have any errors.
For that we will do the same thing. I will write date here. I have made a column here.
You can make it here if you want. So let's join it. I will take date here.
I have created a column here. We will select the column. Then we have to go to data.
In data only we will get data validation. Click on data validation. We will choose data validation.
Now here we have to choose settings. In any value. First thing is our date.
So we will do data validation on date. That I have to keep a date here. Now this is like January month expenses.
For that we need date from 1st January 2023 to 31st January 2023. In that case I can write here 01.
Or you can use a hyphen. 01 2023. And I guess I have taken slash here.
So 01 01. And 01 hyphen. Actually 31 hyphen 01 hyphen 2023.
And as soon as I will click on ok. Now here I will start entering the date. Now here I am entering the date.
04 hyphen 01 2023. Similarly here I am entering the date. Let's say 05 hyphen 01 hyphen.
By mistake I have written here 1022. As soon as I will do here. An error will be generated here.
This value does not match data validation restrictions. Define this cell. We will retry.
05 hyphen 01 hyphen 2023. So in this way an error will be generated. Whoever is entering the data.
Suppose you have created a sheet. And you have put data validation in the columns. So as soon as there will be an error while entering.
That error will be shown here. Moving ahead. Next let's talk about category or subcategory.
We have a text base here. So let's take subcategory here. So as of now I am adding subcategory here.
So in subcategory. How can I put data validation here. It will be text based.
We will go back to text base. We will do data validation. Now I am going to take here.
Text length. We can define text length here. Here is text.
So I do not have any one letter word. So I am starting from 3 letters. Or we can take up to 2.
We are starting from 2 letters. And I do not want maximum. So I am writing whole paragraph here.
But I want length up to 20. Because if I see fruits and veggies. Which is the biggest here.
So it is also coming under 20. And let's say you want to define 30 or 25. Whatever you want to define.
You can define. As soon as we will OK it. Here I have written in category.
Let's say I have ordered food from Zomato. So ordered food from Zomato. As soon as I will press enter.
So here we have error message generated. Because its length is more than 20. But if I just write Zomato here.
Then it will work easily here. So here data validation. We have put on text.
First we have seen on date. Now we have seen on text. Moving ahead.
Now let's talk about amount here. So I will create amount here. In amount again.
We will choose whole column. After choosing whole column. We will go here in data validation.
In data validation. I will choose whole number here. We have many other options here.
That we can use here. If we want to define time. But in this case.
I am going to choose whole number here. I don't want here. But in this case.
I am going to choose whole number here. Minimum value is above 10 rupees. And maximum value can go anywhere.
Let's say here. Up to 50,000. I don't want to add expenses here.
As soon as I click on ok. If I add 20 here. It will work.
But in this case. If I add 70,000. This value doesn't match.
Moving ahead. Lastly we will talk about payment mode. So payment mode.
I will choose payment mode. We can add here in payment mode. A very good thing.
As soon as I go here in data validation. I can see payment mode here. Cash, UPI.
What kind of transactions can be there. I might have given in cash. I might have given in UPI.
I might have given card. I don't think. I have any other transactions.
If I want to set these three payment methods. That I choose from these three. In that case.
We can choose whole number here. Again we will go to data validation. We will choose data validation here.
Next we will go here. On a list. I want to create a list here.
In source. We will give three values here. In comma separate.
This value will be cash, card. And lastly UPI. If you want.
Let's do all caps. And now you will see. If I write something here.
I will press enter. It will not work. If I click on zero.
I will get cash, card, UPI. If I choose UPI. It is working.
I have done this with all cells. You can use drop down here. And validate the data.
You just have to go to list function. You can use drop down here. And use list function.
You can use drop down here. And create list function. And validate the data.
I hope guys. You can validate the data. Also.
If you notice. When I was writing date. If I wrote wrong.
For example. If I want to edit this. And I press zero two.
I will get an error message. If you want. You can customize this error message.
All you need to do is. Select this column. I will go to data validation.
Input message is fine. Let's talk about error alert. Error alert means stop.
You have to give title. What can be the title message here? Invalid date.
In error message. The date should be between. 1st January to 31st January.
I am adding here. The date should be. Between.
01-2021 To. 01-2021 To. As soon as I press ok.
If I change here. Suppose. If I write two and press enter.
I will get an invalid date. In error message. The date should be between.
1st January to 31st January. For others. You can do the same method.
In whole number. In text. The length of the character should be.
More than 2 and less than 20. The amount should be. More than 10 and less than 50,000.
In payment mode. Kindly select the items from the list given. In this way.
We can customize the error message. For the other person. Who will enter the data in our sheet.
Whenever we have a large amount of data. In which we have. 1000 rows or 500 rows.
We have to get the data. In which I have to get the value. Of another column on the basis of any column.
For example, I have an employee ID. And I have to know the job title. Or department or salary.
If I have so much data in excel. It will be very difficult to find. It will be very difficult to find.
For this. Excel has a vlookup function. We will learn about it in today's video.
Hello everyone. And a very warm welcome to WS Cube Tech. My name is Ayushi Jain.
And in this video we will be discussing about vlookup functions. We will learn about its rules.
We will learn about its limitations. And how we can overcome its limitations. With other functions.
We will learn this in today's video. So let's get started guys. As you can see here.
I have a lot of data. And if I tell you the row count. It is around 6.
So. Instead of working on this data directly. We come here.
Where I have taken a small amount of data. From the same table. In which I have employee ID, full name, job title.
And annual. I will mention it here which is I will copy and paste it here and now let's talk about
VLOOKUP function that I want to know the salary of this employee id so all I need to do is write is equals to VLOOKUP in VLOOKUP we will get some parameters first of all
you want to search the value of VLOOKUP so I want to search this value which I have in this cell whatever be the value let's say now if employee id is something else that also
will work here now let's talk about table array my table array starts here with a colon and we have to search till here so let's fix it here with a comma
let's talk about column index number column index number what will happen here column index number means the range you have taken in that which number column is this for
example if it is annual salary then annual salary is above 4 if I would have started with name then in that case column number would have been 3 so column index here is 4
after that next thing comes last parameter that is true and false true and false gives exact value or approximate value so generally when we want to get
directly then we will use false here because we want exact match as soon as I close it and press enter here I have got salary of 4533 4533 is this one and here we will see their
salary that is $1,13,527 ok similarly suppose I change employee id to the first one so I will copy it and paste it here so you will see salary is also changed dynamically
here same goes with the name if I would have to take name here then in that case we would have for name we are looking in the same cell but this time
range starts from here there is a rule of Vlookup that your lookup value should be first column of your range like right now
I am seeing ids here so id is my first column if I see name here that I have to mention name here I will take name here for example
I will paste Emily's name here so in this case when I will have range here it will start from here it will not start from employee id there are many more rules like this which
we will discuss later so in this case I will write here equals to Vlookup we have to take here value of this cell next thing is column index number for
the range we have taken index number is 1,2,3 so 3 is our index number and lastly exact match true or false I will take false here so we need exact match here as soon
as I will close it and press enter I will get Emily's salary suppose I want to see Luke's salary in that case
I will pass Luke here and Luke's salary will be visible here but what if I have one more Luke Martin for example I will copy here
Luke Martin and I will paste same here in place of Theodore so in that case which value is given here first value which tells us that Vlookup function works like this it works on
primary keys it works on unique columns which have unique values for now I will press Z and you will see
Luke Martin's salary is $41,336 now I will talk about one more rule, it is a limitation that you can't put left or right lookup you can't say that I have salary here and on
the basis of salary I will see employee ID employee ID is left column and annual salary is right column so I can go from left to right
I can't take right to left lookup so I will try to write equals to Vlookup in Vlookup we will take value first we have to see salary on the basis of salary I need table
array if I start from employee ID this is my first value and this is my last value after putting comma now we will talk about index index will be 1 and I need value exact
match I will enter and here hash is written this is because we can go from left to right we can't go from right to left
for lookup value but we have to solve this that we have some functions index match and XLOOKUP let's see index match let's take index match for index match without taking
salary I will pick salary first let's see match how match function works
I will make separate video on index match also on XLOOKUP I will make separate video but here we will see how to use it on limitations for match I have equals to match if I
talk about lookup value this is our lookup value lookup array is in annual salary let's take annual salary last is exact match for exact match we will take 0 as soon as I
enter index number of this is 8 if we talk about Luke Martin index number of this is 8 1,2,3,4,5,6,7,8 we got the match but associated with this
I have to go in other column I have index number but I have to go in other column for that I will use index for index I will write equals to
index we will use index we need array of names starting value is this ending value is this next is row number we know from match as soon as I close it
Luke Martin should come to me you can see Luke Martin is here now what we are going to do as this is index plus match I am going to add this for that I will remove this and go
back to formula for next we will add index for index we have array comma which is row number value we got from match is row number at last we will close parenthesis and
enter in VLOOKUP we can go left to right but if you want to see right to left for that you can use index plus match or you can use XLOOKUP
XLOOKUP is another very amazing function you don't have to do much for XLOOKUP copy and paste equals to XLOOKUP in XLOOKUP we will put lookup value lookup array is
salary colon comma and last we have return we need name colon as soon as I close and enter Luke Martin will come to me and little down side
I will paste it control T ok in table case I will take first column first column ok you can take value of first column equals to we will use VLOOKUP in VLOOKUP
for table array we will pass we have to select this table name of this table is table 1 you can rename it we will go to column number 4 exact match as soon as I enter
I get value suppose it is some other value I will paste it but in this case if I would have taken name in lookup value then I would have problem because for
lookup value first column should be lookup column for XLOOKUP I have this table
I need same type of data I need employee ID and salary data is in format of rows in that case
I will write ID and salary 84,913 I need to know employee ID equals to we will use HLOOKUP
HLOOKUP table array we will pass table array starting from this one to our ending value now here instead of column index we will tell row index which row we have data annual
salary of this row and index of this row is 4 instead of using A4 we will use 4 in this range and again we don't need approximate value we need exact value so we will use
false as soon as I will press enter we will get value $7,203 salary, as I have passed, this will also change dynamically here.
Now, as the concept of left to right works in VLOOKUP, similarly, the concept of top to bottom will work here that we cannot remove ID on the basis of salary or we cannot
remove ID on the basis of names or we cannot remove names on the basis of salary. So again, for that, we can also use XLOOKUP here.
So here also, as we had VLOOKUP, as we could not check left to right in it, here we can only check top to bottom, we cannot check bottom to top.
That is, I cannot check IDs on the basis of annual salary or I cannot check full names on the basis of annual salary. And same rules goes over here that whatever lookup value
will be here, that will be your first column. That is, the first column of your range will be the column of your lookup value.
Hello everyone and a very warm welcome to WS Cube Tech. My name is Ayushi Jain and in today's video, we are going to talk about the lookup function.
So guys, already in previous videos, we have covered VLOOKUP and XLOOKUP. Today, we will learn about the lookup function, how it
works, what are its rules and limitations. Let's see how we can use it. Now, for the lookup function, I am going to take an example
here. In the example, I have some names, salaries and here a range is decided that they will get a bonus on the basis of this range.
Suppose someone's salary is more than Rs 50,000, then he will get 5%. If his salary is more than Rs 80,000, then his bonus will
be 10%. If his salary is more than Rs 1 lakh, then his bonus will be 15%.
And if it is more than Rs 1,50,000, in that case, it will be 20%. Now, I have to calculate this bonus here based on these
salaries which are given here. So, here I will not get the exact value, I will get the approximate value that how much percent bonus they will get.
Now, to calculate the percent bonus, I am going to use the lookup function here. Let's see how to use it.
So, first of all, I have to see the lookup value on behalf of the salary. Then there is a lookup vector, i.e. which range I have to
see. I will define this range here. As soon as I close it and press enter, you will see that I have got 15% value here.
That means the salary is more than Rs 1 lakh but less than Rs 1,50,000. So, I have got 15% value here.
But what if I apply these things on all? For example, if I double tap here, I will get hash and A. The reason for this is that its formula is correct here.
But what if I check its formula here? So, you can see that automatically my range has shifted here. If I check here, then my range has shifted from one cell.
So, in this case, we will choose this range in our first formula. Using F4, we will block this range here.
That this range should be fixed for every value. We will press enter here. 15% has come here.
I will double tap. Now you will see that automatically I have got 5%, 10%, 15%, 20%.
If in case you have values in point or decimals, you don't have to do anything. You just have to select the values here.
For now, it is coming in percentage. If it comes in number format, then to shift it in percentage, all you need to do is click on percentage.
To remove decimals, you just have to increase or decrease decimals from here. Then you will get the exact value.
So, basically this is how our lookup works. Now, there is a limitation of lookup here. Your lookup value, lookup range should be sorted in
ascending order. For example, if I choose this. I will right click on it.
I will select largest to smallest. Let's sort it. And you will see that some values have changed for me.
And the values which I am getting as output, I am getting 5% data for them. Which is not true.
So, we have to take care of this thing. If we are using lookup function, then the lookup value from which we are going to extract data.
We have to arrange them in ascending order. Also, suppose if I have some extra column here. We will see the example here.
So, suppose this was the example. If I talk about the table here. I have employee ID in the table.
So, I will copy and paste the employee ID from here. So, here I have employee ID. I want to know the job title.
So, before job title, let's do one thing. Let's take salary first. We have to take salary here.
To take salary, I will use lookup function again. Lookup value is this. We are going to talk here by putting comma.
So, to choose the whole table, I will choose this table here. Let's close it.
Let's press enter. I have got the lookup value here. That is the exact value 95409.
Let's press enter. We have got the value here 95409. Now, why it has come like this?
Because again, it is not sorted in ascending order. So, to sort it, all you need to do is. Sort by.
So, because it is not in numbers. So, let's convert this column into numbers first. So, I have sorted it now.
So, guys, if I want to take salary here. To take salary, I will do one thing quickly. I will take these salaries here.
Because then we will have different format. So, we will not be able to sort the values. But as of now, if I take salary of employee here.
Again, I will write the formula here. Lookup. We have to lookup this value.
We will pass the table here. So, we have to choose this table. And as soon as I press enter.
I have got the salary here. But this is not matching with the employee ID. Why? Because again, the values whose lookup is ours.
This is not sorted with us. So, to sort it here. I choose this column.
Right click. Sort. We need smallest to largest.
Now, let's see the value here. Now, as I take an example of a table here. We have employee IDs in the table.
On the basis of employee IDs, you need a job title here. So, I will copy the employee IDs here. Let's paste it.
And if I talk about the job title here. So, in that case, how much range I have to take here. So, we will use equals to lookup here.
We have to pass the lookup value here. After lookup value, I will take the range for lookup vector here. Because our job title is coming till here.
So, I will come here and close it. If we take in annual salary. So, in that case, lookup will pass the annual salary here.
Instead of job title. So, I will press enter. Actually, I have not passed the lookup value here.
So, by putting a comma. First, we pass the lookup value here. That we need to lookup for this one.
And we are all set. So, we will press enter here. Again, because it is not arranged here.
It is not sorted. Because of this, we have not got the exact value here. If we sort it here.
Then after that, we will get the exact value here. So, I hope the concept here is clear. That your lookup value should be sorted here.
Secondly, in the lookup value. The last column of the lookup vector. Our last column.
We will get the value from it. So, in case if you want annual salary. Then you will have to choose the entire column here.
For job title, only these three values are needed. If I only needed the full name here. Based on employee ID.
So, in that case, I would have used the range of employee ID and full name here. So, guys, here we used the lookup function.
To look up for a manager here. Similarly, if we write xlookup here. If I only talk about the lookup function here.
Then we have to give the range here. B19. From where we are taking this cell.
Then after that, we have to pass our table. In which we have employee ID. And then job title.
So, xlookup will also work here in some way. That is equal to xlookup. I will use it here.
In xlookup, you can give the lookup value here. That this is my lookup value. By putting a comma, we will get the lookup array.
So, this is our lookup array. By putting a comma. What do we need here?
So, basically, we need the job title here. We will choose the job title from here. I will close it here.
As soon as I press enter. We will get the director here. Which is the correct output here.
Because you remember. Last time we had a senior manager here. That's why it was coming.
Because it was not arranged. In the ascending order. So, what is important for lookup.
Your return array should be in the ascending order. But here you will notice. That we do not need anything like this in xlookup.
You can directly remove the values here. Similarly, if I talk about salary here. So, if I change the formula here.
And instead of job title. If I have to remove the salary here. So, let's take the range of salary here.
Let's press enter. We get the salary here. Of 2572.
So, we have the salary of 2572 here. And the salary here is 163,163,099. So, in this way, we can easily get the value through
xlookup. Similarly, as we used hlookup. While using hlookup.
We removed the salary here. Also, we also saw that. If we have anything below in hlookup.
So, we can't remove the things above it. That is, if we have any row below. Based on that.
No value of the upper row can be removed. That was the rule over here. And limitation as well.
So, if we use xlookup here. For example, if I put xlookup here. And after that, we choose here.
From where do we want it? From this cell. Our lookup array is here.
So, this is the lookup array of xlookup. Our salary is basically here. So, you can choose from here.
Towards the end. Similarly, by putting a comma. Return array.
What do we want here? So, let's see. If I want a name here.
So, in that case. We can choose a name here. And by closing it.
As soon as I press enter. So, I will get a name here. Associated with this salary.
So, we had here. Employee ID. We took 2832.
Which is this one. We got the salary here. 84,930.
And we got the name easily from xlookup. That is Penelope Jordan. If I would have done the same thing from xlookup.
Then I wouldn't have been able to do it. Because my lookup array is at the bottom. And my return array is at the top.
But it is possible from xlookup. There is something else about xlookup here. Let's see some examples, for example, we can use XLOOKUP to
apply data validation. To apply data validation, first we have to select the cell, go to data tab, here we will get data validation.
After this, we have to choose a list instead of any value, we have to create a list. For the list, what will be the source here? The source will
start with our employee ID. Because we don't want to include the employee ID here, we will take this source.
And then I will click on OK. So we have created a list drop-down in such a way that you can select anything here.
On the basis of this, suppose you want to remove anything here, for example, you want to remove anything on the basis of this, then what you have to do here is simply equals to
XLOOKUP. We will use XLOOKUP here, this is our lookup value. Which lookup array do we have here? This is our lookup
array. And lastly, return array, what do we have to remove here? Let's say I want to remove salary here, so I will choose
salary here, close it. And as soon as I press enter, I will get a salary here for 1639.
So if we check 1639 here, then we get a salary of 95409, which is correct. So in this way, we can easily work with XLOOKUP here with
data validation. Now it is necessary that we have to see the salary, who knows we have to see the full name, job title, annual
salary. So for that, we also have a very good option here that I remove this formula from here.
Here we take a reference that what will happen here, a drop-down list will be created. Again, we put another data validation here.
So again, I take a list here. Let's take a source for the list. This time we are going to take a horizontal source here
that it can be full name, job title, annual salary. As soon as I press enter here, I will do OK. So we will get an option here, like we need a job title
here. Now I will make a lookup formula here, on whose basis I will make both of them. I can put any employee ID here.
After that, I can select whatever I want here, for example, full name, job title, whatever. Whatever I select, I get that data.
So first of all, let's talk here, is equal to XLOOKUP. We will take XLOOKUP here after XLOOKUP. What is the lookup value for XLOOKUP?
First of all, this. Where will we get this? We will get this in our first array.
After that, what do we have to return? To return, we have to put another lookup function here. So we will put one more XLOOKUP.
For XLOOKUP, we will take full name here. After this, where will we get this full name from? We will get it from these titles.
So these titles will come to us. Lastly, who has the return value? I have a return value in this whole grid.
The return value of all of them is in this grid. Lastly, I will close it and press enter. Okay, we have some opening and closing missing here.
Okay, one more bracket will close here. Now as soon as I press enter here, you will notice that we have a value here.
The value is 1639. We have taken the full name, that is Austin Wohl. Let's see if it takes a senior analyst in the job title or
not. So here I will check the job title through data validation. As soon as we see the job title, we have a senior analyst here. So you will see the formula here.
What is our formula here? First of all, we have to use the XLOOKUP function. After that, we are going to talk about what we have to see
in XLOOKUP. First of all, we have to see the employee ID. So first of all, we have seen the employee ID here.
Where will we get the employee ID? In our first cell range, that is, in this whole range, we will get the employee ID.
So we passed this. After that, what is the return array here? The return array can be our full name, job title, or annual
salary. So for this, again, we will put another XLOOKUP. On whom will we put?
Job title, annual salary, and full name. That's why we have passed the column names from B1 to D1 here.
Lastly, what can be the return value? Return value can be anything from here, depending on full name, job title, and annual salary.
That's why we have given it all. And as soon as you press enter here, you will get the values here.
If you want to check for someone else, for example, I have to check for Savina here. So as soon as I put it here, I will get the value of the
job title here. That is Senior Manager. Similarly, if you see their name here, then for the name
here, we have the name here. So guys, in XLOOKUP, we saw that if we put data validation here and we have to change anything here.
For example, I have to change its full name here. I have to change the job title. So I can get whatever I want here.
Similarly, if I talk about index and match here. First of all, let's understand the index function. What is the work of the index?
Basically, what does it do to us? If we put is equal to index here. First of all, it will tell us which array you want.
For example, in XLOOKUP or VLOOKUP, we have to get the return value. What should be the return value here?
So you can define the return value here. For example, you need a full name, job title, annual salary. As of now, let's say I need an annual salary.
Or we can also take the full name. So let's take the full name here. I will take the full name here.
You can pass the row number here. For example, we have 0591 here. 0591 is in the twelfth row.
You can see that it is in the twelfth row. But you will notice one more thing here. We also have column names here, which are in row number 1.
So 12-1 is in row 11. As soon as I close this, you will get the name of 0591 here. So if you check here, the full name is Samana Ali.
Now let's talk about the index. How did you get the index? You didn't have to do anything for the index.
You just have to use the function index. You have to tell from which range you want it. And what is your value in that range.
Now what is the match function here? Let's understand the match function here. In the match function, we have the lookup value.
Who are we looking at? We are taking the lookup value. Our employee ID.
Where will you get the employee ID? Our lookup array. This is our lookup array.
We will get the employee ID here. After that, you want the exact match. You want less than or greater than.
If you want the exact match, we will pass 0 here. As soon as I close this and press enter, I will get 11 here.
What was 11 in the index? It was the row number. So if we are giving 11 in the index,
If we can get it out of the match, There are different values here. For example, we have E00591 here.
Suppose we have some other number. Let's say I change it here. You will see that our full name is Luna Sanders.
Similarly, our match is 3 here. But the index has not changed yet. Because we did not make it dynamic in the index.
We gave a fixed value here. So where will we get the fixed value? We will get the fixed value from the match.
Now let's see how to use it together. We will take out the index here. We need an array here.
First of all, we need an output. Because we need it from the names. So we will take out the names from here.
Now we will put a comma and get the row number. We will get the row number from the match. So use the function match.
What is the lookup value for the match? The employee ID is the lookup value. Where will we get the employee ID?
In this array. So we selected this array here. And lastly, we need the exact match.
So we will pass 0 here. We will close the second bracket here. As soon as we press enter, we have Luna Sanders here.
Because we had the name of this employee ID. So you will notice here that if we use the index directly, then we have to give a fixed value here.
But if you add the match with the index, then the match is dynamic here. So we can change the match here with our employee ID.
That's why we can use the index and match together to get the values. Like we do in xlookup.
So I hope guys, you understood how the index and match works here. If you want to see one more example, suppose for the index
and match, I don't want the name here. But let's say I want the job title here.
So as of now, let's remove this. And instead of the full name, I will mention here that
I want the job title here. Their job title is director. For director, I will put here is equal to index.
This time I want the job title. So we will take the entire job title array here. With a comma.
Now which row do we need? For that, we need a match. So for the match, we will start the match from here.
That match. What is our lookup value for the match? Again, this is our lookup value.
We are going to get it from the employee ID. Which is the lookup array? The lookup array is our employee ID.
And lastly, we want the exact match. So we will pass zero. As soon as I press enter, we will get the match.
So you will notice here. How can this be done? So first of all, we will open Excel here.
If I talk about conditional formatting in Excel, then here we have the same sheet on which we were maintaining date, category, subcategory, amount, payment, all these things.
We were maintaining expenses. Now if I talk about date, on what basis can we do conditional formatting on date?
That is, we will go to conditional formatting. We have to highlight cells on a date occurring. In date occurring, we have some data like yesterday, today,
tomorrow, in last 7 days, last week, this week, next week, last month, this month, and next month. Suppose I want this month, then I have this month's data
highlighted here. I have added February's date here and it should be highlighted here.
As soon as I click on OK, you will see that a date which was of 17th February which was added by mistake has been highlighted here.
So in this way, we can do formatting on dates. Now this is basically used in sales categories that when you see monthly sales
Suppose you have a date in the month whose targets are written and you want to highlight it. If you want to see all these things of 7 days ago,
yesterday, today, tomorrow then in that case, we can use Conditional Formatting here. If I talk about text here, like I have text here, if I put
Conditional Formatting here like I want to highlight cell rules, text that contain Now the text that comes in it is not a category but if I
open it here and put Grocery I guess I have not chosen the whole cell here. So here I choose it and Conditional Formatting
Highlight Cells, Text that Contains Grocery and you can also give some other options here like you want to see all the text in which we have food or essentials
So the essential part will be highlighted here. And as soon as I fill OK here You can also give red color instead of OK
Whatever color you want to give custom format, you can give that filled with dark green color or if you want to give something else here yellow filled with dark yellow color
I guess red was much better So we will continue on red. Let's click OK
And if you want to clear any formatting here Suppose I don't care about this date So again if I want to clear it here
So all I need to do is select this column And here we have clear rules Clear rules from the selected cell
Not entire sheet or this table but selected cells which I have selected here So you can see here that formatting on 1702 has been cleared
Similarly, if I talk here that I want to give Conditional Formatting in Date I want to give Top-Bottom Rules
I want Bottom 10 and Top 10 If I want Top 10, then my recent 10 dates like 24, 27, 7, 26 And as soon as I click OK
I can get my recent Top 10 dates here Now it is not on Top 10 but if you want to increase values like Top 11, 12, 13, 14, 15, 16
You can see that it is dynamic The way I am adding values here The way I am changing values here
It is automatically adding data here Suppose if I had put Essentials somewhere else that I have started taking tea in Essentials
So if I write Essentials here You can see that it is dynamic As soon as I change the value here
It will automatically highlight Similarly, if I talk about Amount here In Amount, we can give Conditional Formatting
Highlighting Rules whose value is between Let's say I want values from 10,000 to 20,000 So we can use Between here
I will write Between here 10,000 to 20,000 Let's say I get only one value which is on our Rent On House Rent, that is 16,000
So if you can give Between here You can give Greater than or Smaller than Again, if we choose this
We will go to Conditional Formatting We will click on Clear Rules We will click on Clear Selected
Again, I will go to Conditional Formatting Here, I can give Data Bars What are Data Bars here?
You can see different colors here As soon as I choose it I get Data Bars here
How are the Data Bars coming here? Based on our values Bars are being created here
Suppose, I take a range here Let's say 20, 30, 40, 50, 90, 30, 100, 40, 20 This is just for example
I will select this whole range I will apply Conditional Formatting I will use Data Bars here
You can see, we have Data Bars in Gradient If we have Data Bars in Solid Film Colors are of different types
Whatever you want to choose here You can choose here Again, if I select this
Let's use Conditional Formatting You have to set Icons You have to show values increasing or decreasing
You have to show that I guess, you have seen such Icons In Stock Market
If any stock is going up or down Its value is going up or down It is medium here
If I talk about 2 to 100 50 is a number which is coming in medium If I talk about lower numbers
Like 20, 30, 40 These are decreasing numbers Increasing numbers are 100, 90
These are high numbers In this way, things are indicating Suppose, I have set 30 here
Let's say, 130 In that case, you can see Its bar has also changed
Its symbol has also changed Now, its medium value is 90 In this way, we can
Condition these bars Similarly, if I select this cell again After clearing this bar
Selected cells Conditional Formatting again We can use Scale of Colors
Colors are increasing or decreasing Suppose, we have a value Similarly, I can write values
Like 21 If I drag it and move it here We can use Formatting on this
Colors In which we have Colors and Scales In this way, our Scales are going It is dark on lower value
It is dark on lower value It is light on middle value For example, it is 25
On 25, we have white color On lower value, it is red On higher value, it is green
So, these are all Categories of Conditional Formatting In Conditional Formatting, we have
Many things like above average Below average Top 10 items
Bottom 10 items It goes on percentage value We have to highlight cells
On greater than values For example, I want All values greater than 1000
To be highlighted So, we will highlight here Greater than
Let's say, greater than 1000 As soon as I click on OK All values greater than 1000
Like 18, 90, 16,000, 16, 50 1074, 1025 and 1500 All these values Are highlighted here
Guys, to understand macros Let's take a content For example, I have January data
I have January expenses Similarly, February expenses Similarly, March, April, May, June
I have to maintain expenses For all these I have to do same type of formatting
For example, I have to arrange dates In ascending order Let's say, above 1000
Expenditure I have to highlight it I have to create a list Through data validation
I have to do the same process In that case, we can use Macros You will not get macros directly
For macros, all you need to do is Go to File Go to Options
Go to Customize Ribbon As soon as you go down You will find Developer
Let's take add-ins Let's add developer As soon as developer comes
You will see Record macro After record macro
As soon as I click on it Macro will start recording After macro recording starts
You have to do the same task Which you have to record Every month, every week, every year
Which you have to repeat in your data Let's start the record macro Let's write anything here
For example, Data formatting I don't want to give any shortcut
I will just click on OK We have a rule here That we cannot give space here
So, we will use underscore As soon as I click on OK Recording has started
First of all, I have to choose Cell I will right click on it I have to sort
Oldest to newest I have sorted the values And I guess
First column was not chosen So, I will choose it again Once we have sorted the values
After that In this range I will choose this range
I have to do formatting in this range I will go to Home Here is Conditional Formatting
I have to highlight cell rules I have to highlight Greater than value 1000
I have highlighted Greater than 1000 I have to highlight
Data Validation I have to choose Cash, UPI or Payment in Card
I will choose it We will go to Data We will use
Data Validation I will choose List Sources Comma Cash Payment OK Now, we have all the data
We have all the data Once it is done We will go to developer and stop recording
After that, I will press CTRL Z I have removed All the functions
Operations Now, I have to select If you want to make it interesting You can insert a button
I will add a button What will happen If I click on this button
Basically, I will name this button Format Data As soon as I click on it, the data will be formatted and it will be placed here with the help of the
ctrl key. Now as soon as I click on this button, you will see that all my data has been sorted here.
Again, the values highlighted here are here and here we also have a cash UPI card through data validation. Now suppose I have another workbook here and I have some
data in it in the same way that I have a date here. And next I have a category here, so I quickly take 2-3 categories from here.
And for categories, I quickly take some categories here. So I have added some data here, now I have to put a macro on it, so all you can do is go to macros and run it.
So you will see that I have highlighted the value here and I have data validation here. Already these values were sorted here, so they have been
sorted here. So if you have more values here, they will also be automatically sorted here.
In this way, whatever you have recorded through macros, you do not need to repeat the same steps here again and again. First of all, I open the data of January in Excel, on which
we have been working from the beginning. So these are the January expenses, which I have categorized in this way that there is a date here, there is a category,
there is a subcategory, there is an amount and there is a payment mode. Now I have to create a pivot table here, to create a pivot
table, you will go to insert here. You will get the option of a pivot table here. You can also click on the pivot table directly or there is
a very good option here that we will take the range on the recommended pivot table. This is table 1, if you want you can also change its name.
So this is our table 1, I will OK it. As we need sum of amounts, we have a product category in row labels.
In row labels, this time we have card, cash and UPI in this option. In row labels, here we have card, cash and UPI, but on the
right hand side, we have the count of subcategories. How many subcategories are there, how many payments are there in the card, how many are there in the cash, how many
are there in UPI. Similarly, we have subcategorized them here that first there is a category, then there is a subcategory.
First of all, let's start from here, I will OK it. It will take me to a new sheet, I will rename the sheet here.
I will write pivot here and leave it. Let's increase its size a little. OK, this is better.
Now you will see that on the right hand side, a dialog box has appeared here. If we go to the design also, we will get a lot of things
here. First of all, we have these rows here that you have to define a category here or if you want a subcategory here, you can define a subcategory here.
If you want to add more things in the column, you can add more values here. So if I want to add payment mode in the columns here, I can
add payment mode here. Similarly, let's remove this field for now. I am getting the sum of amount here.
And if I don't want the sum of amount here, suppose I want some other value here, all I need to do is click on this. We will go to the value field settings.
You need maximum value here, minimum value, standard deviation, product, count numbers. So there are a lot of options like this.
I will go with sum for now because we will use sum in this. You will see the plus and minus buttons here that we have created subcategories here.
I will remove the subcategories from here. Suppose you don't want subcategories here, then we can remove the subcategories here.
Now if you want their maximum values here, we will go to the maximum value. We will choose the maximum value in every category here.
But here the grand total is 16,000. So I don't need the grand total here. So what I will do here is off for rows and columns.
So the grand total will be removed from here. Similarly, if you want to give some color or design here, you can add whatever color you want to give here.
So let's go with this one. Okay. Let's go back here.
And maybe you want to add something else here this time. So again, let's go to insert here. You can also click on recommendations.
You can take that table from table or range or from some external sources here. So in table 1.
So in table 1. And then again, we can choose here what we want here this time.
Or if you don't want the recommended here. We will go to the pivot table. We want from table range.
In table range, we will choose the table here. We will click on OK. The table will be created here.
If you want this table in another section, it will come to us there too. We will go here.
Let's insert here. Pivot table from table and range. Here you can choose table 1.
It will come to us here. Whatever categories you want to add in it. This time I want payment mode here.
And on the basis of payment mode, I want the amount. So the amount will come to me here. Similarly, if you want, you can also insert slicer here.
Because I have the option of insert slicer here. If I insert slicer according to the payment mode here. If I do OK, a slicer will be generated here.
Let's make it a little short. We are going to study more briefly about slicers in the next session.
But as of now, if I choose a card here, only the card payment will be displayed. If I choose cash, if I choose UPI, only UPI payment will be
displayed. Similarly, if you cross it, you will get all three options again.
In rows, you have to add more things here. Suppose you want to add a category here. You will get according to the categories here.
Clothes and food in card. Essential food and grocery in cash. Clothes, essential food and grocery in UPI.
We will get all the options. As soon as we reduce it, we can get the data directly here. If I open it in cash, we will get subcategories here.
You also need subcategories for these categories. You can add subcategories here. In essentials, we have bed sheet, lunch box, perfume, salt
and sugar. In food, we have this. In grocery, we have this.
We can also show all these things in slicers. I hope the pivot table is clear here. If you choose the pivot table here, we will go to the
design. We have a lot of options in design. If you see in the report, we don't have it in tabular
format. If you want it in tabular format, we can also show it in tabular format.
For that, let's take it a little down here. Or let's take it a little to the side. Let's open the essentials.
We will open it like this. Food will open here like this. Grocery will open here like this.
If you want to disable the totals, we have to turn off grand totals, on, off for rows, off for columns. We have a lot of things like this.
You can also design them according to you. Whatever color you want to add, that color will be added here. So I hope guys, what are pivot tables?
How can we use pivot tables? How amazing are these pivot tables? And how does it create a summary of our big data?
This must have been clear here. Not just this data, but if you have any big data, data inside the bike, where you have to get information about
sales. So again, as an example, I will take our expenses sheet here, where my January expense is.
After taking the expense of January, now we will insert here. To insert, we are going to use slicer here.
So we have to add slicer here. So guys, here I am going to take the example of this sheet again, where our expenses of January are.
So here we select this table first. As soon as we select the table, we have to go to insert here. And we have to add slicer.
To add slicer, we have a lot of... Now majorly, what is the use of slicers in dashboard creation?
Or we can use them with pivot tables. And simply, if you want to attach them with your tables, inside your workbook, you can also do it normally.
So we are going to show here. Let's say, I want here on the basis of payment mode. As soon as I click OK, a slicer will be generated here.
You can define its size here, how small you want it. Now, we have selected three options here. Suppose you have to select the first option, you will
choose card here, you will get the data of the card. If you choose cash here, you will get the data of cash. Similarly, if you choose UPI, all the data of UPI will be
displayed in front of you. Not just this, if you want to remove payment mode from above, payment mode is defined here.
If you want to remove it, you have to right click and you can go to remove payment mode from here. Or we can choose slicer, but we don't have to remove it
from here. And if I talk about slicer designing, we can do slicer designing here.
Whatever color you want to define here, you can define that color here. Similarly, if we right click and go to slicer settings, we
will get a lot of additional options. For example, this is payment mode, so I will write payment mode here and leave it.
We give the name of payment mode. Now, the list that is coming here, you need it in ascending order, you need it in descending order, you can define that
here. Use custom list while sorting. So, we are using custom list here.
Hide items when no data. If we choose this, all the rest will be disabled here. Hide items with no data means we have to hide all the items
here which have no data. So, I will disable it here again. We will click ok.
I guess there is already something with this name. So, we will choose payment mode 1 here. So, like this, we have a slicer here.
In pivot case, we have a... I got it from the payment mode, that's why there is already a name here.
So here we have a slicer. If I cross it, I will get all the data back here. Similarly, if you want to choose a single option, you can
choose like this. If you want to choose multiple options at the same time, in that case, you can choose by dragging here.
I want to choose card and cash. Or I have to remove it and choose only cash and UPI. So that is also possible here.
If I want to add another slicer here, I can add another slicer here. All I need to do is select it.
We have selected table 1 here. Again, we will go to insert here. In insert, we have to add slicer.
This time I have to do slicer on the basis of categories. So we will do category OK. I will also add category here.
If you want, you can resize it here. You can also define the colors here. Again, all you need to do is, you have a slicer called
category here. Its name is already here. You can change it if you want.
If you click right, you will go to slicer settings. You have to show the display header here. If I click OK, the header will be removed from here.
But I prefer that we have a header. So again, I will enable the header here. I have chosen bills and clothes here.
I should also have UPI in bills and clothes. So I have put multiple slicers like this. Suppose you want to see bills and clothes, you just have to
see UPI, then remove it. If you don't want to see UPI, if you want to see all the slicers, you can click on it.
So as you can see, slicers are very useful. They are mainly used for pivot tables and dashboard creation.
Also, if you have sheets with bulk data, and you want to see some data of a particular category, you can use slicers for that too. So I hope guys, after this video, you would
have understood how to create slicers. So first of all, if I have this data here, if you can see this data, we have customer key, prefix, first name, last
name, birth date, marital status, gender, and we have a lot of columns here. So if you want to put a power query on all these columns,
power query is basically, let's talk about the birth date here. In the birth date, you will see that we have different
formats here. Some dates are in hyphens, some are separated with slashes here.
If I choose this entire column here, you will notice that some dates have been converted here, but some dates have not been converted, because of their format.
And normally, I can't change the format here without copying and pasting. So in that case, what we will do here, we will use the
power query. And not just such things, but if you want to do any transformations, you can do that easily.
Where do we want to open the power query? For that, we will first go into the data. So here you will see on the left-hand side, you have get
data from text csv, from web, from table range. So I am going to take text or csv files here. Let's open it.
And let's go to datasets here. I guess this is in my excel x6 format. So I am here instead from file, from excel workbook,
customer data import. Now another amazing function of using the power query is that suppose you have a folder and you have different data
in the folder. For example, you have one year's sales, second year's sales, third year's sales, one year's customer data, second
year's customer data, third year's customer data. Now in the power query, all the transformations you will do, will be done in all the tables.
If you have taken the data from the folder while getting the data here. So by doing this, we have a lot of features here.
So as of now, a pop-up has come in front of us. We don't have to load it here, but we have to transform it. So let's transform it.
As soon as we transform, a new pop-up will open with us, which is customers data power query editor. So this is our power query editor, which we are going to
use. Now you will notice that we have a customer key at the start.
There is a prefix, first name, last name, birth date, marital status, gender. These are all the columns that we had earlier.
There are applied steps on the right-hand side. Those steps come here, which you put in the transformation here.
Once you apply the steps, they are all recorded. Automatically, when new data will be loaded in it, then similar steps will be applied to all of them, which is a
big benefit of power query. On the top, you will see that as soon as we have a ribbon like Excel here, we have a home, transform, add column, and
view in the ribbon. In the home, you will see different properties, such as you have to split any column, you have to group by, use first
row as headers. Already we have headers here. Suppose your first row does not come here like a header,
then you can use it here. Okay, as it is written here, promoted headers, it has automatically detected and added.
But if it is never added, then you can use it here. If you want to merge queries, you have to append, then there is an option here.
Moving ahead, let's talk about transform here. So I will show you the transform practically. Before that, let's talk here, as if we were struggling for
the birth date. Now in the birth date, if I choose this birth date, right click, change type, and date.
So you will see that I am getting errors here. The reason for this error is that their format is not right
here. So I cross the change type once. You can see here that whatever step I have put, you will also cross it.
So whatever step you put, it is also being recorded. Also, if you click on cross, it will also be deleted from there.
Right click, let's go to change type, and using locale. Once we click on it, a new pop-up will come to us. In this pop-up, we have to change, type data, in which we
have to change, in the date. After the date, we do not have to take English India, but we have to take English United States.
Because you are seeing the format here that hyphens are being used in English India, while in English United States, you will notice that slashes are being used here.
Also, here is the format of month, date, and year. So as soon as I click on OK, you will see that everything has been formatted well and here we have change type with
locale. We have done it here. Similarly, if I talk to you about transform and add column,
I have to add a new column here. Assume that I only need the years here.
In that case, I can also do that. To do that,
I will only go to date here. After the date, I only need the date, age, and year.
So if I want the year, I will click on year here. And a new column will come to me which has the year.
Similarly, if I want to add a new column here in which I have to mention the age, it will be on whose basis? Again, it will be on the basis of birth date.
So let's go here on the birth date. We will go here and I want here on the basis of age. As soon as I added age, here I guess it is giving me in the
format of hours. So all I need to do is that I don't have to add column here. Instead, I have to transform this column.
So to transform, what will you do here? To transform, there is a simple method that we will go to transform and the duration is given here.
We will convert this into total years. So after doing total years, we will have round off value. For example, the year from 1966 to date is 56 and 6 months.
56 years and 6 months. Okay. So, if we calculate this age here without removing round
off values, for that only you will get rounding in transform section. In rounding, you can round up or round down.
For example, if I round down, it means 56.6 and we have removed 6 months. We have removed value after decimal and kept value before
decimal. If I would have rounded up, then in that case 50.6 would have output 57.
So, this is how it works here. So, we have got ages here. Similarly, you have to do something else here that you have
to replace values. For example, and we will go to replace values. In replace value, we will write Y here and press yes.
Similarly, you can right click here or you can use replace values here also. We will write N here and for N we will write capital
N here. It doesn't make sense but if you have to do something else here, you can do it here.
You can do conditional formatting here. Total children is written here. So, 2, 3, 0, 5, 0.
So, if you want to create a new column here based on any condition, so add column, conditional column. In conditional column, we will write total children is
equals 0. If it is equal to 0, in that condition, we will write ABC here that not parents.
And if you want to add another condition, you can add clause here. If it is equal to 0, then we will write parents here.
And as soon as I click ok, you will notice that I have parents here.
In not parents category, you will see number of children is 0. Similarly, here also it is 0.
So, you have to extract something in the format of text there are many things that you can do here you have to create an index column, you have to duplicate a column you
can do all these things easily you will get many options in transform we have text column here i.e. text tools then there are number tools, date and time tools
and structured column tools similarly, there are some tools here to replace values to replace, to fill, to create unpivoted columns and once you think that your work is done
here all the steps that you have taken you have to satisfy them transformation is complete you will also notice that on the right-hand side we have so many applied steps
whatever we have done, all those things are here lastly, we just have to go to home we will on close and load in close and load, again close and load
as soon as you close and load a new table will be created here not table but actually worksheet not table but actually worksheet and in this, we have all the columns
which we had extracted here year, age, status we have all these things even the format that we had changed in dates we have all that now you can easily do any work on it even
if you load more data here and refresh it it will bring that data for you for example, if I go here not just this if you load more data here like if you had
extracted a folder like if you had taken a folder in getdata file in case and here also in data sets we would have chosen customer data folder then in that case, all the
new files that I add even those will be transformed here so guys, for power pivot I am taking the same data so if you are following this
series from the beginning you would have seen how we were making tables on monthly expenses and we had made it in January here I have also added February in payment mode, I
have given three categories and in category, we have here grocery, food, essentials, clothes and bills I have categorized it now you will notice that there is no
relationship between them but suppose I want to build relationships between them so in that case, I can use power pivot here but there is nothing like power pivot here even
if we go to data we don't have anything here in insert, we have pivot table but we don't have power pivot we will get power pivot at the top in tools to add it, we will go to
file we will go to options after going to options, we will go to add-ins you will see here we have power pivot on the top it will be at different
places for everyone and you will see here that its type is com-add-in in com-add-in, we will go to manage select com-add-in and ok it again, now I will go to developer
I will go to com-add-ins you will notice here that we have in developer, we will go to com-add-ins and here we have power pivot we will ok it so for this, we will go to
developer we will go to com-add-ins and here you will notice that we have many different things here we have to choose microsoft power pivot for excel and I will click on
ok once you click on ok, on the top you will get a new tool, power pivot then all you need to do is here you are seeing many options measures, kpi, data to add
data model, not add to data model if you want to add this data to model what is model, for that I will click on manage as soon as we click on manage again,
we will go to a new window here we have power pivot for excel expense.xlsx so in this, you directly, while using this you can take tables inside or I will show you another
method so suppose this is power pivot in power pivot, we will go to from other sources I guess we will go here in excel file if your text file is
csv in case of csv, you will go to text file and then here you will see comma separated values so we will pass that path here but in my case, it is in xlsx format so next we
will go to browse and in expense 1 also I have taken same data, if I take expense then I already have open file so it will not work here
I will take expense and show you so in case of expense, I will get error here, next when I click that the file you have chosen is in use please close the file before you
import, so in that case I will take expense 1 one more thing you have to take care tick mark here which is use first row as column header
reason being, if you don't choose it, it will automatically name every column as F1, F2, F3, F4 and then it becomes very difficult to
understand column names so it is important to tick mark here next we will click after clicking next we need all these tables and I will click on finish here
I will take everything here, category, February, January and even if you don't want to take payment mode it is not a problem, we will take all three we
will select all here and then click on finish after clicking on finish success is written here and all these tables are also imported once all are imported after that,
you will notice February, January, payment mode, we have all these if you want to build a relationship we have different tables in
between and if you want to build a relationship, you can go to design and create relationship or you will see diagram view on home page if you click on diagram view, you will
get values like this these are all tables if you want to add category from February means if you want to build a relationship between them, you will see one to many, means
in category we had values like bills, but these are coming many times in February, means in category this is primary key and in February this is
foreign key, similarly we have payment mode similarly we have payment mode in February if you want you can interlink with this and same category we have in January so you can
interlink with this, in all four we have built a relationship one and star means this is coming one time, means this is primary key and star means many one to many
relationship, you can see flow is going towards January, here also flow of category is going towards January flow of category is going to February and flow of
payment mode is going to February if you double click you can see payment mode and payment mode relationship is built, here also we can build a relationship, like drag and
drop, similarly you can go to design and click create relationship, here you have to build a relationship between category and someone which we have already built you can
deactivate this you can keep it active you keep it active and like this we have relationships built, again you can come to home page and come to data view in
data view you can calculate different things like total amount in January I have to calculate that as a measure why I am calculating
that I will show you towards the end of this video so I have to create a measure to create a measure
I will write here January total Jan total
January total is equals to in which table I have January total I will use sum
I have to take sum in January table of amount, double click close it and as soon as I press enter you will notice that I have January total if I increase its size
February total is 30149 now measures can be created not only here but other places if you want to switch from here to excel switch to workbook we will go to switch to
workbook in category I want to create a measure new measure you can name this measure
February total Feb total again we have to put sum sum of what? February's amount close it not in general but in number decimal places
I want 0 you can use a comma separator ok nothing happened here but I will switch again towards power pivot you will see that we have February total similarly you can take out
total by writing total is equals to sum of February's amount or you can take February total is equals to January's total plus February's total press enter we will
get total value 61331 expenses of both months now what is the benefit of this? I will go back to excel that my work is done save it on
excel let's go to excel after going to excel all you need to do is if you want to see visuals in new sheet We will go to the pivot table and if you click on the arrow, we will
get an option from data model. From data model, existing worksheet, we will click on ok. We have the pivot table here.
Now on the right hand side, you will see the options. On the right hand side, we have the category February, January.
If I open the category, we will see the total measures. It is not necessary to take the sum here. You can take the count of anything.
If you want to take the average, you can take the average. There are many such things that you can take here. And not just here, but you can also come to the category
and create them. Whatever measures you want to create here. Let's take the columns here.
In the columns, I will pass the category here. That I have a category here. Or if I don't want a category, I should have a total here.
In my rows, I have a category. So I have row labels. Bills, Clothes, Essentials, Food, Grocery and blank.
I don't know why blank is here. But okay. Let's see what's in it.
After that, we have to add January's total and February's total. Which I add in the columns.
After that, I have to add values here. In which values will go January's total, February's total and lastly total.
So we have created a pivot table here. Based on January total, February total. That is, it has also been categorized here.
Similarly, you can add more things here. You can add filters. On whose basis do you have to give filters here.
If you don't want to give filters, you can insert more things here. For example, I go to Insert.
In Insert, we have charts here. Let's take this chart here. So this is our chart 1.
It has January's total, February's total. And we have the total value. In which you can define categories here.
Okay. So I increase its size a little bit. And if you want, you can also add a slicer here.
That I will write Insert Slicer here. In Insert Slicer, only the category is coming. But if I go to All, I have a lot more things here.
If I want to go to Payment Mode, I will click on OK. I will also add Payment Mode here. I will decrease the size here.
So we have Payment Mode here. Now if I choose a card here, you will see that on the basis of the card, we will get the values here.
Here in the card, we had expenses on clothes. Then how much total expense was in February. And how much was the total on clothes.
Food in February. Food in January. On the basis of cash, we will get the data here.
So you are seeing dynamically how we have interlinked all three here. On the basis of cash, I am getting the total of January,
February and total value here. On the basis of UPI, I will get the total values here. I will tick all three.
If I remove this filter, I will get the values of all three here. So in this way, we have easily created a good visual by
using Power Pivot. Plus we have also built relationships here. Between different tables.
Whenever we see so much data, which has a lot of rows and columns. It becomes very difficult to understand this data by
removing patterns from it. That's why it is very important to visualize data. In today's video, we are going to learn how to visualize
data in Excel. Hello everyone and a very warm welcome to WS Cube Tech. My name is Ayushi Jain.
In today's video, we are going to learn about charts. What are the different types of charts in Excel. And how can we simply create these charts in Excel.
So let's start. First of all, I don't need such a big table to create charts.
I have to create charts on the basis of things. For that, I will go to Insert. And let's take some recommended Pivot tables here.
First of all, let's go here. And we will take the count of anything here. So let's go here.
And I will OK this. So here on the basis of professions, we have created a Pivot table.
On the basis of professions, we have the count of the customer. Most of our customers belong to professional occupation.
And next is our skilled occupation. Then let's sort it, it will be better. So we have created a Pivot table.
And on the right hand side, you will notice that we have rows, columns, values like this. If you want to increase the columns here, all you need to
do is add anything in the column. For example, I need gender pieces here. How many females are there, how many males are there.
And then how many genders are not available with us. And if you want to remove it, we will click on it. I don't know why there are email addresses here.
Let's remove this too. So on the basis of this, if I want to create my chart first, I will go to Insert again.
In Insert, you will notice that we have a lot of options in the chart section. We also have some recommended charts.
So we can start with the bar plot. First of all, our clustered column. Let's OK.
In this too, you saw that we had a lot of options here. If I can click here on the plus, then you can add access titles here.
You can add data labels. We have other categories in data labels. If you want data labels coming out inside, outside, in the
center, while calling out like this. So you can mention all those things. I feel better outside.
So we can call data labels here. We don't need data tables here. We don't need error bars here.
If you want to mention trend lines here, you can add trend lines here. So this way we have a lot of options here, which you can
explore in the charts. So this is our basic chart. In this chart too, as we talked about male and female, we
categorized here. If you want to add a slicer here, you can add a slicer here on the basis of gender.
If I add it here on the basis of gender, just in case, then as soon as I do female, I will get the data of females. As soon as I do males, the data will dynamically change
according to the males. And if I click on not available, then I have that data too. If we cross it, then I will get the data of all three here.
And similarly, if you want to create a different chart here, then again on the basis of this, so we will create charts on recommended pivot.
And maybe this time I will take something else in categories. So for now, let's pick this once, but I want to make some
changes in row labels here. So I don't have a prefix in row labels, but maybe they have an occupation.
So we can add occupation here. And I will remove the prefix from here. So we have it on the basis of occupation.
Now here again we have to insert the chart. Suppose if you want to add something according to yourself, for example, if you want to add a pie chart here.
We have it in 2D, we have it in 3D and donut chart. If you want, then we start from 3D here. Again in 3D, you can add colors here, you can change the
style and colors here. So I guess this one is much better, in which we are getting values here.
So you can choose different styles and colors according to yourself. So I will go with this one.
Similarly, we have enabled everything here. Suppose you want to disable anything here, you can disable it from here.
Similarly, if you want to add a tree map here, you can also add a tree map. And you can select the tree map according to whatever you
want here. Again, if you want to give a similar range here, on the basis of what data you want to create a tree map here, you
can do that too. And as soon as I say ok, the tree map will come here. We also have different options here in the tree map.
On the top, you will also see a lot of things in chart design and format. For example, you have to fill color in the shape, you have
to fill the outline. You have to make changes in the text, you have to insert some shapes.
You have to send something forward or backward. Let's go back to chart design. If you want to add any element, I don't want any chart
title here. And also, I will go here. I have to show data labels.
And if we show data labels once, then we don't need legend here. So I have to make legend none here. So I can make legend none here.
And in this way, we will get data here. Similarly, if you want, you can also add a slicer here. So we will add a slicer here.
Slicer is on the basis of whatever you have here. For example, whatever occupations we have here, whether they are parents or non-parents, we will go to the status
for that. Let's do ok. After coming to parents, you will notice changes in the
data here. So you can view the data on different formats like this. With different visuals.
We have a lot of charts here. There are 2D charts here. And then there is a remap.
Moving ahead, there is a waterfall, there is a funnel. In stock, we have a box plot. And then you will also notice 3D charts here.
Similarly, 2D line, 3D line, 3D, 2D areas, you will notice here. According to your visual, according to your data, whatever
you want to add here, you can do that. Scatter plot is also one of the very famous plots. Whenever you have to see around the data, which side we
have more data. For example, there is more data on the male side. There is more data on the female side.
So guys, to create a dashboard, I have data here. This is basically employee sample data. In which we have employee IDs, names, job title, different
department, business units, gender, ethnicity, age, hire date, annual salary, bonus, country, city and exit date. We have all these things.
Basically, my motive is that I can create such a visualization in which I can display annual salaries. The motive here is to create a dashboard in which I can
display my average salary based on different situations. Let's start. First of all, I have created some pivot tables in different
sections. In this table, I have Ethnicity and Average of Annual Salary.
On the basis of a job title, I have calculated the annual salary. On the basis of a department, I have calculated the annual
salary. On the basis of a business unit, I have calculated the annual salary. Let's remove the full name from here.
You can add different filters here. I have mentioned the exit date here. If you want to see which department people have resigned in
the end, you can easily see that here. For the visuals, I have taken an empty sheet here. First of all, let's go to the first pivot table where we
have the annual salary on the basis of Ethnicity. For this, I will insert a chart here. You can take the chart according to you.
I will go with this one. We will go to the simple chart. In the simple chart, you can see the values here.
If you want to insert the values inside, you can do it. I don't have to give the title of the axis here. I don't even have to give the title of the chart.
Even if I want inside the axis, I have to remove the vertical values here. But I want the data labels to be displayed here.
I want the data labels to be displayed on the outside end. Similarly, if you want to change the color here, you can give different colors and styles according to you.
So, maybe we will go with this one. We can also choose whether we want the grid on the back side or not.
We will get a lot of options here. I will go with the simple one. I guess I had removed the data labels here.
And I guess I had removed the axis here. In the axis, we only have to remove the vertical axis here. And we are all set.
If you want, you can copy the chart from here and add it to the visuals. So, it will be added to the visuals.
Again, whatever changes you want to make here, you can do it here. I will decrease the size a little.
Similarly, let's go to the title first. I have to keep it at the top that on the basis of different titles, the average salary is how much yearly.
So, in that case, I will create a visual here. Again, I will go to insert. We will insert the values here.
We can increase it a little more. If you want, you can also use the line chart here. So, if we want to change the chart design here, let's type
change. We can also add a line chart here if we want. I am going to make some changes here too.
So, I have the chart ready here. I have added some trends here. Lastly, I have named it Average Annual Salary.
And if you want, you can edit it more based on the job title. So, we have enough space.
So, we can easily write here. Again, I will copy it from here. Let's go to the visuals.
I am going to paste it here at the top. You can set it according to yourself. I will reduce the size here a little.
Next, let's go to the department here. If you want to add a different chart here, So, this time I want to add a different chart here.
Like I have created a lot of bar charts, but I have to add here based on. Let's say I want to add a tree map here.
So, for that, I will take the chart title here, Tree Map. And select. We will go inside the data.
Based on this data, I will take the tree map here. Let's click on OK. And we will also edit it a little here.
So, lastly, my chart is also ready. Let's copy it and bring it to the visuals. Lastly, you can do a lot of amazing things here.
When you have the charts built here, So, you will go to the insert. If you want, you can add a timeline here.
Or you can add both timeline and slicer. So, if your visuals are ready, If you have a connection built,
So, in my case, there is no connection built here. But let me show you as an example. Let's take it on the basis of gender.
So, if I create a slicer here on the basis of gender. So, as soon as I click on male, You will see changes in the values here.
If I click on female, changes will come. I will remove the filter. We will still have changes here.
If you want to connect to everyone, In that case, you should have a connection built here. Which you can do by voting on the power.
That you can build a connection between different tables. Lastly, you can visualize the data. And between that, slicers or then let's go to the insert.
And here I add a timeline and show you. So, not on the basis of this. But let's say I will add a timeline on the basis of this.
So, here I take the timeline on the basis of higher date. So, you can see here on the basis of higher date. I have created a timeline.
Its period is in months here. So, if you want, you can break it down in years. Now everything is selected here.
But you have to see here. So, in 2016, what was the average salary? In 2017, what was the average salary?
In 2018, what was the average salary in different departments? What was the average salary in different business units?
And if we remove the filter from here. So, this filter can also be changed. So, you can add a lot of such small things here.
And you can make your dashboard more interactive. So, I hope guys how to create a basic dashboard. That would have been clear here.
I hope you liked this video. And for more such content on Excel, stay tuned guys. Thank you.
You can record macros to automate repetitive tasks like applying conditional formatting, sorting data, or setting dropdown lists. Assign these macros to buttons for one-click execution, reducing manual effort and minimizing errors in frequently performed operations.
You can use Power Query in Excel to import, clean, and transform data from various sources with reusable steps. It allows you to handle different date formats, remove duplicates, filter rows, and add calculated columns, such as age. This streamlines data preparation and ensures consistency before analysis.
VLOOKUP and HLOOKUP are useful for simple vertical or horizontal lookups but have limitations like searching only left-to-right or top-to-bottom. For more flexibility, combine INDEX and MATCH functions to perform dynamic, two-way lookups. XLOOKUP is an advanced function that supports exact matches, two-way lookups, and error handling, making it ideal for complex data retrieval tasks.
Start by summarizing your data with pivot tables, then insert slicers and timelines to add interactive filters. Combine multiple pivot tables and charts on one sheet to form a dashboard. Enhance clarity with descriptive titles, labels, and consistent formatting, allowing users to explore the data dynamically and gain insights efficiently.
Beginners should learn basic arithmetic operations (+, -, *, /), text functions like CONCATENATE, LOWER, UPPER, and MID, as well as logical functions such as IF, AND, and OR. Additionally, understanding autofill and flash fill features helps in efficiently entering and formatting data.
Data validation allows you to restrict inputs, such as limiting dates to a specific range, enforcing numeric limits, or controlling text length. You can create dropdown lists for categorical data and customize error messages to guide users during data entry, ensuring consistency and reducing errors.
Excel offers a variety of chart types including column and bar charts for comparing categories, pie charts for showing proportions, scatter plots for relationships, tree maps for hierarchical data, waterfall charts for sequential data changes, and funnel charts for progressive stages. Use appropriate charts with enhancements like data labels and trendlines to effectively communicate insights.
Heads up!
This summary and transcript were automatically generated using AI with the Free YouTube Transcript Summary Tool by LunaNotes.
Generate a summary for freeRelated summaries

Master Excel for Data Analysis: From Basics to Interactive Dashboards
Learn Microsoft Excel for data analysis starting from the basics to advanced features like formulas, pivot tables, and Power Query. This comprehensive guide covers data cleaning, dynamic filtering, advanced lookup functions, and building interactive dashboards for real-world business insights.

Master Microsoft Excel for Finance: From Basics to Financial Modeling
This comprehensive Learnit course series, led by Elyssa Smith, covers Microsoft Excel essentials tailored for finance and accounting professionals. Learn data entry, formulas, financial functions, advanced lookups, financial modeling, and visualization techniques to build income statements, balance sheets, and cash flow statements.
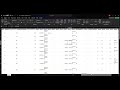
Mastering Basic Navigation and Data Manipulation in Microsoft Excel for Survey Analysis
In this video, we explore essential navigation and manipulation skills in Microsoft Excel, specifically for analyzing survey data. Learn how to identify rows and columns, manage headers, sort data, and handle different types of survey responses effectively.

Master Tableau: Comprehensive Guide to Data Visualization & Dashboards
This extensive Tableau course covers everything from basics to advanced topics, including data modeling, calculations, chart types, dashboards, and real-world project implementation. Learn to create dynamic, interactive visualizations and dashboards with over 60 functions and 63 chart types, optimized for business intelligence and data analysis.
Mastering Descriptive Statistics in Excel: A Step-by-Step Guide
In this tutorial, learn how to analyze single variables in Microsoft Excel using pivot tables. Discover how to count responses, calculate percentages, and compute averages and medians for effective data analysis.
Most viewed summaries

A Comprehensive Guide to Using Stable Diffusion Forge UI
Explore the Stable Diffusion Forge UI, customizable settings, models, and more to enhance your image generation experience.

Kolonyalismo at Imperyalismo: Ang Kasaysayan ng Pagsakop sa Pilipinas
Tuklasin ang kasaysayan ng kolonyalismo at imperyalismo sa Pilipinas sa pamamagitan ni Ferdinand Magellan.

Mastering Inpainting with Stable Diffusion: Fix Mistakes and Enhance Your Images
Learn to fix mistakes and enhance images with Stable Diffusion's inpainting features effectively.

Pamamaraan at Patakarang Kolonyal ng mga Espanyol sa Pilipinas
Tuklasin ang mga pamamaraan at patakaran ng mga Espanyol sa Pilipinas, at ang epekto nito sa mga Pilipino.

How to Install and Configure Forge: A New Stable Diffusion Web UI
Learn to install and configure the new Forge web UI for Stable Diffusion, with tips on models and settings.

If you found this summary useful, consider buying us a coffee. It would help us a lot!