Overview of the New Remedy Effectiveness Analysis
A new medical remedy claims to cure 82% of patients with a particular condition. This analysis uses binomial distribution and hypothesis testing to evaluate the remedy's effectiveness on a sample of 115 patients.
Binomial Distribution Calculations
Parameters
- Number of trials (patients): n = 115
- Probability of success (cure): p = 0.82
1. Probability Exactly 90 Patients Are Cured
- Using the binomial probability formula, the probability P(X = 90) is calculated.
- Result: Approximately 0.535 (53.5%)
2. Probability At Least 95 Patients Are Cured
- Calculated as P(X ≥ 95) using the cumulative distribution function (CDF).
- Result: Approximately 0.491 (49.1%)
3. Probability Between 21 and 49 Patients Are Not Cured
- Probability of not being cured: q = 1 - 0.82 = 0.18
- Define Y as the number of patients not cured, Y ~ Binomial(n=115, p=0.18)
- Calculate P(21 ≤ Y ≤ 49) using CDF.
- Result: Approximately 0.59 (59%)
4. Variance of Number of Patients Cured
- Variance formula: Var(X) = n * p * (1 - p)
- Calculation: 115 * 0.82 * 0.18 = 17.0
5. Finding Least Number n with P(X ≥ n) < 0.30
- Starting from n=95 with P=0.491, increment n until P(X ≥ n) < 0.30
- Found n = 98 with P(X ≥ 98) ≈ 0.222
Two-Sample T-Test Comparing Recovery Times
Context
- The clinic wants to test if the mean recovery time for patients using the new remedy is less than that for patients using the old remedy.
- Data assumed normally distributed with equal population variances.
- Significance level: α = 0.10 (10%)
Hypotheses
- Null hypothesis (H0): Mean recovery time (new remedy) = Mean recovery time (old remedy)
- Alternative hypothesis (H1): Mean recovery time (new remedy) < Mean recovery time (old remedy)
Test Execution
- Data entered into spreadsheet software.
- Two-sample T-test performed assuming equal variances.
- Test statistic: t = 1.64
- Degrees of freedom: 14
- P-value: 0.062
Conclusion
- Since P-value (0.062) < significance level (0.10), reject H0.
- Interpretation: There is sufficient evidence at the 10% significance level to conclude the new remedy reduces mean recovery time compared to the old remedy.
Explanation of P-value and Significance Level
- P-value: Probability of observing the test results assuming H0 is true.
- Significance level: Threshold probability for rejecting H0 when it is actually true (Type I error rate).
Summary
This analysis demonstrates how binomial distribution can quantify probabilities related to patient cure rates and how a two-sample T-test can compare mean recovery times between treatments. The new remedy shows promising effectiveness both in cure rates and reduced recovery time at the specified significance level. For a deeper understanding of the statistical concepts used, you may find the following resources helpful:
it's claimed that a new remedy cures 82% of the patients with the a particular medical problem this remedy is to be
used by 115 patients and it's assumed that the 82% claim is the
true find the probability that exactly 90 of these patients will be cured based on this information 11 15 patients
exactly 90 cured or not cured we know this is a binomial distribution here is a binomial
distribution formula this n is number of Trials this p means probability of success or desired
probability in this question n equals 115 desired probability is the
probability of being cured which is 0.82 X follows binomial distribution with the 115
0.82 we are looking for probability of for x equals 90 let's go to Bome
PDF menual 55 8
115 probability of success is 0.82 x value is
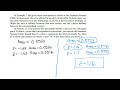
90 enter answer is 0.535 let's go to B find the probability that at least 95 of these patients will
be cured this uh desired probability still 0.82 we looking for probability of X
greater than or equal to 95 the this time we need to go to Bome
CDF menu 55 go to B
115 p is a 0.82 lower Bond 95 upper Bond
115 because totally there are one 15 patients answer is 0.491 let's go to B2 more than 20 and
less than 50 of these patients will not be cured this time the desired probability
P equals the probability of not being cured equals 1 - 0.8 2 equal
0.18 so we will Define another variable y follows binomial distribution with 115
0.8 we are looking for probability of y greater than 20 less than 50 you need to change this into equal sign probability
of y greater than or equal to 21 less than or equal to 49 then we go to
byome CDF menu 55
B 115 0.8 lower Bond
21 upper Bond 14 9 enter enter answer is a 0
59 say find the variance in the possible number of patients that will be cured this P
equals probability of being cured which is 0.82 we got to use use this
formula variance equals 115 *
0.82 * 1 - 0.82 17.0 the probability that at least n
patients will be cured is less than 30% find the least value of n we are looking for probability of
for X greater than or equal to n less than 0.30 let's check back
B1 probability for X greater than equal to 95 is
0.491 we can get started from 95 patience we just need to check 96 97 98 99 until
115 let's get this Bome CDF for for 95 then go up change this
95 into 96 enter change this
96 into 97 almost there change 97 into
98 enter 0.222 less than
0.3 so a = 98 because the probability of X greater than or equal to 98
= 0.222 so n = 98 a clinic is interested to say if the
mean recovery time of their patients who tried the new remedy is less than that their patients who continued with an old
remedy the clinic randomly selects some of their patients and Records their recovery time in days the results are
shown in the table below the data is assumed to follow the normal distribution and a population variance
is the same for the two groups a test is used to compare the means of for two groups at
10% significance level State the appropriate know and alternative
hypothesis for this T Test you need to go back to check what this Clinic wants to know they want to see the mean
recovery time of their patients who try the new remedy is less than that of their patients who continue with the
older remedy keyword here is a less than which means this is H1 ho will be equal to each
other therefore we will write down H1 first H1 the mean recovery time of for all the
patients with the the new remedy is less than that for all the patients with the older
remedy ho the mean recovery time of for all the patients with the new remedy is equal to
that of all the patients with the older remedy F find the value for this uh test let's
put this data into spread sheet so click on one
no four spread sheet PQ typ in the
data after you put the data put the cursor on an empty cell go to
menu four four two sample T Test four data enter list one double click
this right arrow button p q
alternative hypothesis less than P yes because the population
variance is equal to each other enter you need to write down all this uh three information down T equals
1.64 P value 0.0 620 degree of four Freedom equals 14 t equal
1.64 P value equals 0.0 620 DF = 14
State the conclusion for this test give a reason for your answer here is the rule please reject H P value is
0.062 z significance level 0.1 less
than reject ho which means you write down H1 with the significance level the me
recovery time of all the patients with the new remedy is less than that of all the patients with the older remedy at
the 10% significance level H explain what the P value
represents P value is the the probability for obtaining observed results when ho is true explain what the
significance level represent significance level is also the probability of for rejecting ho when ho
is a true you can compare P value and a significance value so that you can remember this two
together both you have a ho is true both are kind of probability
To calculate the probability of exactly 90 patients being cured, the binomial probability formula is applied: P(X = k) = (n choose k) * p^k * (1-p)^(n-k). For this analysis, with n = 115 and p = 0.82, the result is approximately 0.535, indicating a 53.5% chance of exactly 90 patients being cured.
The binomial distribution is a statistical method used to model the number of successes in a fixed number of independent trials, each with the same probability of success. In this analysis, it is used to evaluate the effectiveness of a new medical remedy by calculating the probabilities of different outcomes, such as the number of patients cured out of a sample of 115.
A P-value of 0.062 suggests that there is a 6.2% probability of observing the test results, or more extreme results, assuming the null hypothesis is true. Since this P-value is less than the significance level of 0.10, it indicates sufficient evidence to reject the null hypothesis, suggesting that the new remedy significantly reduces mean recovery time compared to the old remedy.
In the two-sample T-test, the null hypothesis (H0) states that the mean recovery time for patients using the new remedy is equal to that of patients using the old remedy. The alternative hypothesis (H1) posits that the mean recovery time for the new remedy is less than that of the old remedy, indicating a potential improvement in recovery time.
The variance of the number of patients cured is calculated using the formula Var(X) = n * p * (1 - p), where n is the number of trials (patients) and p is the probability of success (cure). For this analysis, with n = 115 and p = 0.82, the variance is calculated to be 17.0, which helps in understanding the variability in the number of patients cured.
A cure rate of 82% means that, based on the analysis, it is expected that 82 out of every 100 patients treated with the new remedy will be cured of their condition. This statistic is derived from the binomial distribution and indicates the effectiveness of the remedy in a clinical setting.
The significance level, often denoted as alpha (α), is crucial in hypothesis testing as it defines the threshold for rejecting the null hypothesis. It represents the probability of making a Type I error, which occurs when the null hypothesis is incorrectly rejected. Understanding this helps researchers determine the strength of their evidence against the null hypothesis.
Heads up!
This summary and transcript were automatically generated using AI with the Free YouTube Transcript Summary Tool by LunaNotes.
Generate a summary for freeRelated Summaries

Estimating Mean and Testing Normality of Family Movie Running Times
This summary explains how to estimate the mean running time of 200 family movies using mid-interval values and frequency data. It also covers how to estimate the interquartile range from a cumulative frequency graph, identify outliers, and perform a chi-square goodness of fit test to assess if the running times follow a normal distribution.

How Big Pharma Replaced Natural Medicine: 20 Historic Remedies from 1926
Explore the fascinating shift from 75% natural remedies to predominantly synthetic drugs since 1926, based on the authoritative 'United States Dispensatory.' Discover 20 natural treatments once mainstream that remain effective today, revealing important insights into modern medicine's evolution and the overlooked power of natural substances.

Revolutionizing Recovery: The Power of Magnetic Field Therapy
Discover how magnetic field therapy aids recovery and enhances healing processes for serious injuries and conditions.
Understanding Z-Scores and their Applications in Statistics
Explore the relationship between z-scores and probabilities, examples, and how to find values based on z-scores.

Normal Distribution Review and Chi-Squared Test Explained
This video reviews key concepts of the normal distribution and demonstrates how to calculate probabilities related to basketball players' weights. It also covers conducting a Chi-Squared test for independence to analyze the relationship between players' performance and weight.
Most Viewed Summaries

A Comprehensive Guide to Using Stable Diffusion Forge UI
Explore the Stable Diffusion Forge UI, customizable settings, models, and more to enhance your image generation experience.

Kolonyalismo at Imperyalismo: Ang Kasaysayan ng Pagsakop sa Pilipinas
Tuklasin ang kasaysayan ng kolonyalismo at imperyalismo sa Pilipinas sa pamamagitan ni Ferdinand Magellan.

Mastering Inpainting with Stable Diffusion: Fix Mistakes and Enhance Your Images
Learn to fix mistakes and enhance images with Stable Diffusion's inpainting features effectively.

Pamamaraan at Patakarang Kolonyal ng mga Espanyol sa Pilipinas
Tuklasin ang mga pamamaraan at patakaran ng mga Espanyol sa Pilipinas, at ang epekto nito sa mga Pilipino.

How to Install and Configure Forge: A New Stable Diffusion Web UI
Learn to install and configure the new Forge web UI for Stable Diffusion, with tips on models and settings.

If you found this summary useful, consider buying us a coffee. It would help us a lot!