Introduction to Spearman's Rank Correlation Coefficient (Rs)
Spearman's rank correlation coefficient, denoted as Rs, measures the degree of a monotonic relationship between two ranked variables. Unlike Pearson's correlation, Rs is less affected by outliers and focuses on the order rather than the exact values.
Key Concepts
- Ranked Variables: Data points are converted into ranks, with the highest value assigned rank 1.
- Monotonic Relationship: Describes how one variable changes as the other increases or decreases. For example, if X increases and Y also increases, they have a positive monotonic relationship.
How to Rank Data
- Assign rank 1 to the highest value.
- For tied values, assign the average of their ranks.
Example Ranking
- Highest value 8.2 is rank 1.
- Three identical values ranked 2, 3, and 4 are averaged to rank 3.
- Two identical values 5.04 ranked 5 and 6 are averaged to 5.5.
Calculating Rs Using a Graphing Calculator
- Enter the original data into lists L1 and L2.
- Sort the lists to assign ranks.
- Clear previous data and input the ranks into L1 and L2.
- Enable diagnostics mode to calculate correlation.
- Use the calculator's statistical functions to compute Rs.
Example Calculation
- Wind speed data ranked from highest (30 mph) to lowest (6 mph) as ranks 1 to 6.
- Corresponding charging times ranked accordingly.
- Calculated Rs = 0.886, indicating a strong positive monotonic relationship.
Interpreting the Results
Since Rs is positive and close to 1, it indicates that as wind speed increases, the time to fully charge the robot also increases. This confirms a strong monotonic relationship between the two variables.
Summary
- Spearman's Rs measures monotonic relationships between ranked variables.
- Ranking involves assigning ranks and averaging ties.
- Graphing calculators can efficiently compute Rs.
- A positive Rs indicates both variables increase together.
This method is useful in experiments where data may not be normally distributed or when outliers are present, providing a robust measure of association.
For a deeper understanding of correlation techniques, check out Understanding Correlation Techniques: Pearson, Spearman, Phi Coefficient, and Point Biserial. Additionally, you may find Understanding Correlation, Sampling, and Experimental Bias in Research helpful for exploring related concepts. If you're interested in statistical applications, consider reading Understanding Z-Scores and their Applications in Statistics for more insights.
today we will introduce spearman's coloration coefficient R sub s which is defined as the person's
coloration coefficient between the ranked variables it indicates the degree of a monotonic
relationship between the variables it is affected by outlier less than Pearson's coloration coefficient
for the experiments the collagen coefficient first of all
the keywords is the rank variables it's about coloration between the ranked variables second keyword is a
monotonical relationship how to describe the monotonical relationship
you will use the following sentence when X increases what about y increases or weight decreases how to
label the rank the highest number will be rank 1. 8.2 is rank 1. then
the second highest one I have three numbers exactly the same but I still label as a two three four
then I have a 5.04 5.04 I will label as a 5 6 even they are the same
then I have a seven eight nine
ten then for the same number you will add this ranking
together divided by three four plus three plus two divided by three
will be three so
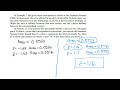
the rank for 7.5 well is a three for 5.4 we've got
rank of five and a six so five plus six divided by two equals 5.5
the rank will be 5.5 for both 5.04 this is a one seven nine
eight ten that's how you
rank the data now let's go to 1G calculate the Spearman coloration coefficient R sub s
between the wind speed and the time to fully charge the robot since we already put
l y and L2 into the graphing calculator we will use calculator to do the rank
for the L3 we will put one two three
four five six
then we go back to stat d enter
we want to sort L what then enter that you need to sort L2 also
second two is L2 enter then then we go back to stat edit you could say
L1 L2 assorted from a heist to the lowest this will be the rancor for each number
for x wind speed 30 is 1 28 is 2 24 is a 3. 16 is a 4. 10 is a five well six is a six
after we put the rank we need to put this record into L1 and L2
this will be L1 this will be L2 so go to the calculator make a cursor
highlighter L1 then press up clear enter
they will clear the data in L1 then highlight L2 press clear enter
it will clear L2 so for L1 that is a 6. 5.
4 three two
one for L2 5 6 4 3 1 2.
then press mode to make us that Diagnostics on then quit
go to stat again calculate then go to 4.
this time we only focus on these are this is a spearman's collusion
coefficient it's about the coloration between rank variables these are equals 0.886
so we get this experiments coloration coefficient R sub s equals 0.886
1K describe monotonic relationship between the wind speed and the time to fully charge the robot since this R is
greater than zero which means when wind speed increases the timer to fully charge the robot
increases so the monotonic relationship between wind speed and the time to fully charge
the robot is that when the wind speed increases
the time to fully charge the robot increases
Spearman's Rank Correlation Coefficient, denoted as Rs, measures the strength and direction of a monotonic relationship between two ranked variables. Unlike Pearson's correlation, which assesses linear relationships and is sensitive to outliers, Rs focuses on the order of values, making it more robust in the presence of non-normal distributions or outliers.
To rank data for Spearman's Rs, assign rank 1 to the highest value and continue assigning ranks in descending order. For tied values, calculate the average of their ranks. For example, if three values are tied for the second position, they would each receive a rank of 3, which is the average of ranks 2, 3, and 4.
To calculate Rs using a graphing calculator, first enter your original data into lists L1 and L2. Then, sort these lists to assign ranks. Clear any previous data, input the ranks into L1 and L2, enable diagnostics mode, and use the calculator's statistical functions to compute Rs.
The value of Spearman's Rs ranges from -1 to 1. A positive Rs close to 1 indicates a strong positive monotonic relationship, meaning as one variable increases, the other does as well. Conversely, a negative Rs close to -1 indicates a strong negative relationship, where one variable increases as the other decreases.
Spearman's Rs is particularly useful in scenarios where data may not be normally distributed or when outliers are present. It provides a robust measure of association between variables, making it ideal for ordinal data or when the relationship between variables is not linear.
Spearman's Rs can be applied in various fields such as psychology, biology, and economics to assess relationships between ranked data. For instance, it can be used to analyze the correlation between test scores and student rankings or the relationship between environmental factors and species rankings.
For a deeper understanding of correlation techniques, you can explore resources like 'Understanding Correlation Techniques: Pearson, Spearman, Phi Coefficient, and Point Biserial' and 'Understanding Correlation, Sampling, and Experimental Bias in Research.' These materials provide insights into various statistical methods and their applications.
Heads up!
This summary and transcript were automatically generated using AI with the Free YouTube Transcript Summary Tool by LunaNotes.
Generate a summary for freeRelated Summaries

Understanding Correlation Techniques: Pearson, Spearman, Phi Coefficient, and Point Biserial
Dive deep into correlation techniques using Excel and SPSS, including Pearson, Spearman, Phi, and Point Biserial coefficients.

Understanding Correlational Research Design in Cognitive Psychology
This lecture by Dr. Arkwarma provides a detailed overview of correlational research designs used in cognitive psychology. It explains how correlations between variables are identified, interpreted, and statistically analyzed, illustrating key concepts such as scatter plots, Pearson's correlation coefficient, and multiple regression analysis.

Understanding Correlational Research: Limitations and Causal Insights
This lecture by Dr. Arakma from IIT Kpur delves into the basics and complexities of correlational research designs in cognitive psychology. It highlights the strengths and limitations of correlation studies, emphasizing why they cannot establish causality and explores concepts such as reverse causation, reciprocal causation, spurious relationships, extraneous variables, and mediating variables. The summary also presents strategies like longitudinal studies and path analysis to better approximate causal understanding within correlational research.
Understanding Z-Scores and their Applications in Statistics
Explore the relationship between z-scores and probabilities, examples, and how to find values based on z-scores.

Understanding Correlation, Sampling, and Experimental Bias in Research
This lecture explores key concepts in research analysis including the difference between correlation and causation, the importance of representative sampling, and how experimental biases like placebo effects and experimenter bias can impact study results. Learn practical examples and strategies such as double-blind procedures to ensure research validity.
Most Viewed Summaries

A Comprehensive Guide to Using Stable Diffusion Forge UI
Explore the Stable Diffusion Forge UI, customizable settings, models, and more to enhance your image generation experience.

Kolonyalismo at Imperyalismo: Ang Kasaysayan ng Pagsakop sa Pilipinas
Tuklasin ang kasaysayan ng kolonyalismo at imperyalismo sa Pilipinas sa pamamagitan ni Ferdinand Magellan.

Mastering Inpainting with Stable Diffusion: Fix Mistakes and Enhance Your Images
Learn to fix mistakes and enhance images with Stable Diffusion's inpainting features effectively.

Pamamaraan at Patakarang Kolonyal ng mga Espanyol sa Pilipinas
Tuklasin ang mga pamamaraan at patakaran ng mga Espanyol sa Pilipinas, at ang epekto nito sa mga Pilipino.

How to Install and Configure Forge: A New Stable Diffusion Web UI
Learn to install and configure the new Forge web UI for Stable Diffusion, with tips on models and settings.

If you found this summary useful, consider buying us a coffee. It would help us a lot!