1. The Intersection of Values, Science, and Economics
Environmental policy is not created in a vacuum. It exists at the intersection of three major forces: societal values, science and technology, and economics. These areas overlap and change over time, with policy emerging from their shared space.
The Primacy of Values
- While science and economics are critical, values are the most important factor in determining environmental policy.
- Values guide our choices about how to allocate finite resources (e.g., government budgets, natural resources).
- Every dollar spent on one policy (e.g., national defense) is a dollar not available for another (e.g., environmental protection). This is the core of opportunity cost.
- Policy is a reflection of what a society chooses to do or not do, based on its underlying values.
The Role of Science & Technology
- Technology provides tools to solve environmental problems (e.g., battery-powered cars, solar power).
- New technologies are initially expensive but become cheaper over time through adoption, economies of scale, and innovation (e.g., the decreasing cost of computers and solar panels).
- Policy can accelerate this process by setting future standards or providing incentives (e.g., a state banning new internal combustion engine cars by 2030). This creates a predictable demand that encourages private investment in R&D and infrastructure.
The Role of Economics
- Economics sits between the objectivity of science and the subjectivity of values.
- It provides tools for analysis, such as cost-benefit analysis, but these tools themselves are influenced by value judgments. Understanding concepts like Marginal Analysis Explained: The Efficient Decision-Making Principle for Economics is fundamental to this process.
2. The Efficient Level of Emissions: Cost-Benefit Analysis
The core economic framework for environmental policy is the trade-off between the cost of cleaning up pollution and the cost of the damage pollution causes.
The Marginal Abatement Cost (MAC) Curve
- Represents the cost of reducing one additional unit of emissions.
- It slopes upward: as emissions are reduced (moving left on the graph), the cost of reducing them even further increases dramatically. Getting to near-zero emissions is extremely expensive.
The Marginal Damage (MD) Curve
- Represents the cost of the damage caused by one additional unit of pollution.
- It slopes upward: as emissions increase (moving right on the graph), the damage they cause becomes greater and greater.
The "Sweet Spot"
- The efficient level of emissions (E*) is found where the MAC curve crosses the MD curve.
- At this point, the cost of reducing one more unit of pollution equals the damage that unit would cause.
- This is the optimal balance, not zero emissions. Going beyond this point would cost more to clean up than the damage it prevents.
A caveat: This is a simplified model. The actual cost and damage functions are difficult to measure perfectly.
3. Measuring and Classifying Damage
Policy is primarily concerned with damage to human welfare and the environment. Damage can be direct, indirect, or non-use. For a broader view of these issues, see Understanding Pollution: Causes, Types, and Global Impact.
Direct Damages
- Harm to human beings directly (e.g., lead poisoning, toxic substance exposure).
- Example: A child eating lead paint chips.
Indirect Damages
- Harm to the environment that degrades its ability to provide services for humans (e.g., a crop-killing toxin in the soil, destruction of wetlands that purify water).
- Example: Polluting a watershed that provides drinking water for New York City would force the city to spend billions on a man-made filtration system. Protecting the watershed is an indirect way of protecting human welfare.
- Example: Greenhouse gas emissions → climate change → more intense storms, sea-level rise.
Non-Use & Environmental Values
- Harm to things that have value but are not directly used by humans (e.g., loss of a unique species like a polar bear, destruction of a wilderness area).
- This area is highly subjective and brings us back to the question of values.
Challenges in Measuring Damage
Measuring even direct damage is difficult. For example, to measure the damage of sulfur dioxide (SO₂) from a coal plant, you must:
- Measure the emissions.
- Model how it disperses in the atmosphere.
- Estimate human exposure.
- Estimate the physical impacts.
- Determine the value of those impacts, this is the hardest part. Is the reference person a healthy adult, a child, or an asthmatic?
The problem is these calculations are always incomplete. A direct cost of medicine for a head cold (e.g., $127) fails to capture the lost day of work, the use of a sick day, or the general misery of being sick.
4. Applying the Framework: Example of SO₂ and Housing Prices
A real-world example demonstrates the trade-offs. Research shows a relationship between ambient sulfur dioxide (SO₂) concentrations and housing prices: as air quality decreases, home values decrease. To understand the specific sources and effects of SO₂, refer to Understanding Air Pollution: Causes, Effects, and Solutions.
The Policy Question
If the cost to reduce SO₂ emissions in an area is less than the resulting increase in home values, would that alone justify the policy?
A Competing View (Opportunity Cost)
The money spent on reducing SO₂ (e.g., for scrubbers or enforcement) could have been spent differently. It could go to:
- Compensating people who suffer higher rates of asthma.
- Funding a completely different program.
The policy decision is not just about total benefit; it is about who benefits and what the opportunity cost is of spending the money in one way vs. another. A deeper dive into the relationship between airborne pollutants and human health can be found in Understanding Air Pollution: CO2, Indoor Pollutants, and Noise Pollution.
5. Additional Costs of Environmental Policy
Environmental policies are not cost-free. In addition to direct abatement costs, consider:
- Environmental Costs of the Solution:
- Reducing airborne sulfur via "scrubbing" creates a highly concentrated, toxic sludge that must be disposed of.
- Promoting battery-powered cars requires mining lithium (a rare element with its own environmental and social costs) and managing disposal of dead batteries.
- Enforcement Costs: Regulations are not self-enforcing. Governments must spend money on agencies (e.g., the EPA), personnel, application processing, monitoring, and compliance. For example, a state rebate for electric cars requires a bureaucracy to manage the applications and funds. These decisions also impact Understanding Aquatic and Terrestrial Pollution: Human Impacts on Ecosystems.
The key takeaway: Every policy choice involves a trade-off between different types of costs, different types of benefits, and different groups of people. The ultimate question is one of values.
So welcome to this overview of environmental policy. This overview is meant to provide you
with one way of looking at environmental policy and environmental problems mainly in the United States but also can be
applied globally. The first thing to say is that there are many different ways to look at the question of environmental
policy and many different perspectives. This is one perspective. It's uh couched in somewhat of an economic analysis but
also includes many other considerations. So if we begin we can start by thinking of
environmental policy as an intersection between our values represented here in the yellow circle.
Science and technology or human progression in many ways which share some space if we think of this as a ven
diagram represented in the red circle with our values our societal values and also um some economic analysis which
again share some space with both of these and they obviously have separate areas and to some degree um they change
over time. Certainly our scientific technology changes, our understanding um and our use of technology uh advances or
you know depending on how you but it changes over time. Um the way in which our economics evolves as well and
certainly our values uh both individually and mainly as a society as a a nation and even global values uh
change over time. But as they change they do share space. And if we think of this intersection where they share space
we can think of that uh you know the value science and economics uh as maybe where environmental policy uh derives
from or where we get our environmental policy. So the um environmental policy being somewhat of a a dependent variable
and dependent on these three um somewhat independent but uh correlated um factors value science, technology and
economics. Many argue that from an environmental policy standpoint, while the science and
technology and economics are incredibly important, the values, our values that we overlay on our science and technology
and our economic uh sort of formulations. Uh our values are the most important factor or variable to consider
and we can think about why this might be. Um and there are many different reasons um
people feel this way or you know those who study environmental policy feel that the values um but uh if we think about
it you know all policy comes down to a question of you know what we do why we do what we do as an individual as
a group as a community as a you know national or global community and um and the consequences of what we choose to
do. And all of that stems from the reality that um we have not an infinite amount of resources or choices to make
um we have a finite uh number of resources. So when government for example uh chooses to spend so much of
its finite resources in one area then by definition it excludes the availability of those resources to be used in some
other area. Every dollar that I as a government spend on national defense, that dollar is no longer available to be
spent on social welfare, environmental protection, technological research for advancement
purposes, or anything else that we might find as a maybe a a competing uh use of that dollar. And the key again here that
we always have to remember is those dollars are not infinite. The resources, the available resources are not
infinite. They are finite by definition. They're limited. And there's more demand for those dollars than there are a
supply of dollars to meet that demand. So when we make choices, those choices often represent our values. So people
might argue that environmental policy values is the most important variable or factor or consideration in environmental
policy simply because those values reflect our choices and those choices then impact
what we do or do or do not do relative to our environment. So with that in mind, we can think for
values. How you perceive the issue of values? Do you think that it's incredibly important that it is the main
driver in environmental policy? Science and technology. We can ask what tools does science and technology
provide us to solve problems, environmental problems for example. Um, are there always technological solutions
to environmental problems? If we want to limit our production or use I should say of carbon, removing it
from the ground for example in oil or coal or natural gas and taking it and reformulating it into gasoline or
burning it to produce um electricity or many other uses. If we want to change that and stop using carbon, then we can
think of some of the technological solutions that are available us to us today that were not available to us 50
years ago, 20 years ago or even a decade. And we can also understand that from an
economic standpoint that what is available today might be if it's a new technology an
expensive right substitution an expensive solution for the problem. In other words, for example,
[sighs and gasps] the use of batteries to propel us, to provide us with the energy necessary to
move us in our automobiles. Those batteries are a new, relatively speaking, new technology over the past
two decades or so. And as a result of that, that new technology is expensive relative to the current
internal combustible engines or the gasoline engines or diesel engines that we currently use. And we can think about
this with whether it's you know it's become much cheaper now but traditionally at least at the commercial
level uh generating electricity from the use of coal certainly and but also natural
gas and to a much lesser degree oil um was less expensive than some newer technologies again at the largecale
commercial level like photovoltaic solar for example or wind hydro has always been somewhat competitive and nuclear
energy generation has always been somewhat competitive. But recently because of its wide adoption over a
period of decades um it's it's larger adoption as it continues to be more uh largely adopted generating electricity
from you know the use of wind or the use of the sun um is like hydro the use of water um and there's also geothermal and
there's title there's many other uh ways in which we can produce electricity um where the sources are relatively
speaking free because they're just naturally occurring. But it's getting much cheaper and in
many cases has become cheaper than coal. The produ the commercial production or use of electricity using coal and
certainly um oil and um to some degree natural gas depends on where you are. But the point is we understand that
there are always costs and those costs are not static. They they're not stable. They're not consistent. We all know that
we pay a lot less today for computers um with a lot of capacity and you know processing power that 10 years ago uh
would have cost us a lot more money or 20 years ago or 30 years ago a similar or even a lesser capable computer would
have cost a lot more. We understand that over time as technology progresses the adoption of that technology allows for
efficiencies in scaling and distribution and creation of those of that new technology such that the drives the
price the cost uh to the consumer down over time. And of course when we're looking at new things those costs at the
beginning are are expensive. They're they're high. Um so adoption is difficult. So that's another question I
guess where it comes to values where as technology provides us with options when do we choose those options do we
choose them when the technology is new do we choose them prior to the technology in other words do we make a
choice for example we by the year 2030 there will be no more automobiles for as a policy that are um allowed to be sold
in state A because the state has outlawed them if they're internal combustion engines. Only um batteries or
maybe hydrogen or some other uh non gasoline or diesel burning petroleum burning uh engines will be allowed in
that state. that is setting today a standard that hopefully will drive an evolution and you know fast forward the
development of battery and other technologies that will then drive down the cost. So that when that transition
occurs, it will be much cheaper than it would be if they said as of today there will no longer be allowed to be internal
combustion engines as an example or natural gas burning power plants or you know coal burning power plants or you
know so on and so forth. You can just sort of run with this. The idea of the lead time is to allow
for, you know, incentives for whether it's private industry, if you're in a capitalist system like here in the
United States, or for governments to um, you know, directly or indirectly help to incentivize the movement of capital, the
movement of current dollars towards these innovations because the promise is that there will be a high demand. And
therefore, if you generate supply today, if you do innovation, and if you create economies of scale, aka driving down the
cost of these things, then it will be um to our advantage collectively in the future because we will achieve the
environmental goal of reducing carbon, but we will do so in a way that is relatively speaking cheap. That will not
be a big sort of sticker shock that we might see today where we could buy an internal combustion vehicle for $20,000
and a similarly price a similar type of battery powered vehicle might cost you know 50% to uh 75% more might cost 30
35,000 even 40,000 even double the price of that similar internal combustion engine. So let's get that cost of those
battery co powered cars to be somewhat similar. And we've seen at least here in the United States that one of the
mitigation measures to try to indirectly stimulate uh battery power besides there being other incentives that maybe most
of us don't know about for the manufacturers credits, tax credits, that kind of thing. uh that makes it cheaper
for them to do the business of like a Tesla or other similar car companies that are gen that are developing um
batterypowered automobiles. In addition, we know us as consumers, many of us might know that we uh can receive
rebates both um in certain states. They'll provide you with a t incentive, a rebate basically to make the
automobile cheaper. And certainly the federal government has been providing rebates up to I think $7,500 to try to
make those automobiles cheaper to the consumer to create adoption to get you to purchase them so that the price
differential isn't as big as it otherwise would be and then therefore to help create that economy of scale for
the manufacturer over time. All of this drives back to our values because if we don't choose to make these decisions and
have these policies, whether they be incentives for the manufacturer, incentives for the consumer in terms of
rebates, as I just said, or even just plans, um, you know, laws put in place that identify policies of by this date,
all of that relating to the reduction of carbon intensity without a doubt that we we don't want to continually take carbon
from a stored place like the under the earth's crust and and move it into the air because of the effects. And if we
look at those effects, those effects aggregate over time and can be substantial aka climate change. So
that's one way of thinking about environmental policy in the context of these three intersecting sort of areas.
If we think of the value side, values are really we can think about how politicians sort of you know live in the
world of values where they help to define or you know redefine or confuse sometimes what are our values but often
you know our elected officials are there to hopefully you know mimic what are the constituents that elected that
individual what their values are you know to help sort of push for those values and they can vary they can vary
between individuals ideological backgrounds, um, geographic areas, um, for a number of reasons. It can be, um,
there's a a litany of different types of variations of how those values can be expressed. And generally, we think of
the science and technology area as being sort of the purview of the sort of more objective, less sort of subjective value
areas that can change, you know, easily between both within an individual and between individuals and groups. Whereas
science you know we have uh standards objective standards of measurement etc. We have you know the scientific method
we have replication we have all of these rules in place so that the science and technology lives in a world that is less
variable based on individual whims or or differences between groups. You know we adopt international units of measurement
etc. so that we can you know have consistency and we know when we say that something works in this way then in that
way is replicable and it will work indeed uh if that sort of recipe with all of those objective relatively
speaking objective standards are followed. So uh something to think about if we were to sort of create a dialect
here that the science of technology lives more on the objective objective side of the scale as that might be
perceived and understood and the values is or the politician lives more in the values or subjective side of the scale
something that is more capable of you know of varying over time and then economics lives somewhere in the middle.
Here's a benefit cost analysis curve and it's specifically from Tatenberg and Lewis um and one of their uh they have
many iterations of their textbooks uh environmental economics and policy and that sort of thing. But um if we want to
think of the efficient level of emissions some of you who have an economics background might know this
many of us might look at this and say what is this? Uh the important thing to see is on the uh left hand side you know
what we see is uh cost we see the dollar sign there that's just indicating that you know cost from zero towards the
bottom to let's call it infinity at the top and the um bottom line moving left to right not bottom to top with the e uh
the different e um is showing the level of emissions uh in tons per here. So you have cost on
the left and you have emissions on the bottom and emissions go from from the left to zero emissions to the right to
let's say lots and lots and lots of emissions infinity, you know. So we have again cost on the left and emissions on
the bottom and they're both driving uh cost goes from zero from the bottom to infinity to the top emissions zero from
the left to infinity to the right. And what you see is you see two curves. you have to say the MAC curve and the MD
curve. The MAC curve is the marginal um abatement cost. And so that's what does it cost you to get to that level of
emissions like and marginal just means you know the individual unit of cost the the next dollar you know for to to get
to that level of emissions. So if we were to sort of break this up into a grid line and we saw grids and you know
sort of lines running up and down we could see each of those as individual units of cost. And then as we moved
along we could see that's what that sort of curve is representing is that as we move the curve shows that the marginal
abatement cost changes. It lowers as the emissions go from zero to infinity. And that makes sense because as we get to
infinity the right hand side of the emissions um if you look at this uh that makes some sense to you because if we're
not if we just don't try to control right emissions at all then there are zero costs involved right and yet if we
try to completely limit emissions and bring emissions to as you can see on the left hand side it's not at the zero
because the suggestion there is it's impossible to have activity without any level of emissions. That would be the
theory here. Now, that's technically not true. If we use it in some sense of some idealized sense of well, if we removed,
if we're talking about carbon, for example, emissions, then we removed all um you know, all oil, gas, and coal from
let's say commercial production of electricity, industrial commercial production, then um we're done. We're
good. we don't have, you know, if we're just using others like re what we would call renewable energies again solar and
wind and you know hydro and maybe nuclear some others but the the point is um but even in the process of creating
those things there is some level of emissions let's say in creating the concrete and that sort of thing but the
point is traditionally speaking you never get to zero you just can't get to zero so that's why you don't see the E
on the left with a little hat on top of it um at the zero point there'll always be some level of emissions so the
marginal abatement cost. Um, what we what we get from this is that it's super high. It's
super super high on the left, really really high up there with the cost. And that makes sense because if you want to
get to very low emissions, you're going to pay a lot of money to get there. And then the MD, the other curve that seems
to run, you know, counter to the uh marginal abatement cost, the MAC, the MD is the marginal damage.
And that makes some sense because you know that if emissions are zero or close to zero the damages are zero and we can
see that on the left hand side. Whereas if emissions goes to infinity then the damages go to infinity cost. The amount
of damage the cost that we end up paying for that damage is super high. So there it is. And then you can see the W. And
the W is you know the E with the little star. And what that's telling you is that that where is that efficient level
of emissions? Well, it's where those two lines cross. This is economics. This is traditional economics when you're
talking about benefit cost analysis. And when you want to find that sort of efficient level, it's that's what you're
looking for. That's that sweet spot where the damages equal the abatement cost where they're about the same
because that means you're at the most efficient relatively speaking level. It's a hypothetical. It doesn't, you
know, there's no exact amount that we can put there that applies for every scenario, but the point is you could
measure this and you could find out effectively where that sort of, you know, that Goldilocks uh scenario there
where it's, you know, where it's just perfectly not too hot, not too cold or there's this perfect amount of uh damage
for the amount of cost relative to that damage. And obviously, it's not at zero. So the notion here would be you never
think of making the damages go to zero because the cost the the cost for abatements are just too high to get
there. And certainly you never want the cost of abatement to go to zero because if you do um then you have unlimited
damages. That's if that makes sense. You have too much damage. So what this tells us though is that as
emissions decrease as we decrease emissions right as we move from lots and lots to very little emissions which
would be on the left hand side almost zero emissions right what happens to the cost to reduce them well it increases
right so anytime that we have an environmental policy for example where we're trying to limit emissions every
time we look to limit an emission our cost to limit that emission marginally is going to increase and we
have to understand that. So that means that we're going to have to find dollars in that limited pool of dollars. We're
going to have to find some dollars that are being used for some other purpose and we're going to have to say we're
going to take those dollars from that other purpose and we need them over here because it's going to cost us to limit
to decrease. And so a simple way of saying that is if we're getting more and more people, maybe it's simple, I don't
know. If we're getting more and more people to purchase batterypowered cars and the only way we're doing or one of
the main ways we're doing that is to provide this, you know, rebate effectively directly to consumers and
mostly at least at the federal level, it's done as a tax rebate. So it's a credit. $7,500. Let's just call it
$7,500 credit in the United States on your federal taxes. Might be more. It might be a little less
depending on a number of factors. Let's just call it $7,500. If you get that credit, that is money
that's being taken away from the federal government. That's money that you otherwise, let's say, would pay or at
least some of it you would pay in taxes and that money would go to the federal government. It would be used for some
purpose. Now, that money is gone. And let's say that other purpose includes, I don't know, shoring up social security
or providing a bigger military budget or you can imagine just a variety of different things that the federal
government does. Now, that money is no longer available at $7,500 per person for those other purposes because it has
gone to you for this purpose. And that purpose is to reduce the amount of emissions, let's call it carbon
emissions. And the way they're doing it is indirectly. They're not doing it directly by controlling power plants and
how they're feeding themselves, you know, what they're using to create electricity, that sort of thing. They're
just getting you in terms of transportation reductions, not at the commercial level, not at the large scale
level, right? But at the sort of individual, you as a residential driver, private citizen driving around in your
private vehicle. They're getting you to decrease your carbon emissions relative to using electricity to power your car
rather than gasoline. and they're giving you $7,500 for it. And therefore, that's taking that $7,500 away from some other
purpose. So, there is the cost that's associated with with that marginal reduction in damage. If we if we say
carbon is the damage on the other side, if you spend no money on reducing emissions, of course, what
is the level of pollution, right? It's a lot. It's a lot. And then I'm sorry there is the sort of
again that goldilocks area where we look for this is traditional economic theory and we think about the damage function.
So what the the question of damage right most environmental policies and this is stepping back and not just thinking
about carbon or anything else but most environmental policies are concerned with damage to the environment and that
that that term damage damage from exposure to bad things for example like toxic substances you know we don't want
people you know young children uh lead paint for example that's something that's in historically we've had lead
and paint and we have a lot of older homes where young kids and you know we have [gasps] rehabil abilitation of
those homes because we don't want kids, you know, getting chipped pieces of paint where they're chewing on that and
there's lead and they have a disproportionate impact on young bodies and it's just a bad thing. But there's
many other examples. We think of uh drinking water, Flint, Michigan, for example. There's many other examples,
but you know, um potable drinking water, water that's capable of being uh drunk, you know, um so anyway, all kinds of
nasty things, but there's also damage to the environment that degrades the level of the environment. So there are these
direct damages and we usually think of them in terms of human beings welfare directly something that will directly
harm a human being. There's no sort of in between phase. This is dangerous. It's a toxic
substance and by definition we mean toxic because if humans are exposed to it, it creates a negative outcome for
humans. That kind of thing. And then there's these sort of indirect damages and that's damage to the environment
that degrades the level of the environment. So that you know harms uh the things that you know it's sort of a
a one or two or three steps away from direct human harm. So you can think of you know toxic substances that are
stored in the soil that if you wanted to use that soil to grow crops the soil is now you know poison for that purpose.
And so crops are important because that's the food we want to eat. So that's really important for human
well-being, having enough food to feed humans. So if we take the soil, the arable soil, the soil that we want to
use to grow things that we then want to eat, and we have a scenario where we're polluting, we have a company that as a
discharge, as a byproduct of making the thing that it wants to sell you, it discharges pollutions either into the
soil or into the water, the watershed that then sort of drains into the soil, but then pollutes that soil in a way
that it makes the soil incapable of being used to grow crops. You see, so there's this sort of indirect, you know,
or the example that stated here, destroying wetlands that re remove water purification functions for humans. A lot
of New York City, most of New York City gets its water from a reservoir. Um, and that reservoir uh is in the Catkills, I
believe. Right. The Catskills, the Yeah, I believe it's in the Catkills. that reservoir naturally um is fed through uh
a huge watershed that naturally purifies the water. And the um if New York City had to send its water, the amount of
water it consumes through a man-made a human-made purification system, a water filtration system, a big large one. um
if it had to do that, the amount of money it would have to spend is in the billions and billions of dollars per
year. And so it saves, you think about the watershed, the natural sort of filtration that happens when that water
up in the mountains there in New York makes its way slowly through its watershed area, through its reservoir,
and then through the pipes to New York City. It is the value of those wetlands to filter and make that water consumable
for humans without having to do something with a technological solution without having to filter it through you
know again a human intervention it's worth a lot of money that's sort of an indirect and certainly here I mean in
Massachusetts where we are it's not necessarily where I am but up in Boston the quadin reservoir is another example
many municipalities benefit large cities benefit and populations from uh the nature's natural processes. So
protecting those watersheds, protecting those environments, right? It ensures that you know humans can consume things
and so they are really important. Uh other examples are reducing greenhouse gas emissions of course resulting in a
warmer climate. So you know preventing ourselves from doing that so that we don't suffer from all of the negative
outcomes of having heat island effect having you know these really really hot uh you know uh summer periods where you
have those you know people will die because we have these terrible uh heat spells or you know all of the effects. I
mean we have sea level rise so coastal communities uh we have the types of storms that you know increased
categorical hurricanes increased uh not only um frequencies of storms but intensity like increased you know going
from a level three hurricane to a level four even a level five the destructive capacity of that. Um same thing with
tornadoes, the frequency and intensity increasing those are all sort of so you know having a less carbon in the
atmosphere um in you know helps to mitigate the effects of those higher frequency and intensity of storms and
the thing that we don't want is the intensity of storm just like we don't want um lead in our paint or just like
we don't want we want our land to be able to be easily you know uh crops to be easily grown in that land without any
you know those plants taking up things that are toxic to humans. So um these are all things that we want but they're
a couple of levels move removed a couple of factors removed um from that. So that's the indirect. So we have direct
damages directly to humans indirect and then we have nonuse or the sort of uh you know damage to environmental values
and now we're back to the values the more subjective side. So for example the loss of wilderness or unique species
think of the endangered species act uh that we cannot replace you know just the loss of it most of us I mean I don't
polar bears as far as I know even for um inuits or um you know others that uh live in the Arctic um and tradition live
traditionally mainly in the Arctic I don't think polar bears have been um much of a prey species for them they're
an apex predator I don't think there's the numbers but also for other reasons they're dangerous and u maybe for meat
purposes. But um aside from my personal ignorance, let's assume polar bears aren't used by many humans for direct
consumption. Um you know, maybe for heat and that sort of thing, the polar bear's skin and its fur, that sort of thing,
but otherwise just for direct human use is very limited. But we think of, you know, or caribou, caribou maybe more so.
But the point is there are species um that we um might care about um but we don't use directly. And so that loss of
the loss of that species um the loss of unique wilderness wild places you know we might not use them but they have
value nonetheless. So it's that sort of non-use uh damages. So when we think of damage function we have to think about
them in terms of our sort of you know are we talking about direct indirect or sort of these non-use um which you know
starts bringing us back into that sort of value side of our equation here for uh environmental policy.
As an example of the damage function, how would you measure the damage of a coal burning power plant emitting sulfur
dioxide? How would you do it? Right? So sulfur dioxide creates acid rain. It's nasty. Usually comes in the coal. Um
there's, you know, different areas of the country tend to have from natural conditions different levels of sulfur.
Western coal tends to have a lot of sulfur. Uh eastern coal, eastern side of the country has less. But let's just
sulfur is a problem. Has been a problem. It's been pretty well controlled through the Clean Air Act. But let's uh let's
just think about this from a sort of academic standpoint and think about how would you measure that damage. So
certainly you can measure the emissions. Let's say say the technology allows you to measure the amount of sulfur that's
coming out of those smoke stacks in coal burning power plants as they're burning the coal to create the to drive the
turbines to heat, you know, the water drive a turbine to create electricity. Um there's this obviously residue and as
that residue is working its way up the big pipe there to be smoke stacks to be uh sent off into the air. There's a
technological advancement there is a meter there that can read the amount of sulfur. So we can measure let's say
those emissions and then determine the resulting level of the ambient air quality. So we can make some
calculations based on how much sulfur is coming out of there and then how does that sulfur disperse in this environment
you know and that changes depends on the area. Do you have a lot of wind? Does it go up high? Do you have you know is it
the summer versus the winter? Are you having you know an inversion you know is it is it hazy hot and humid where you
are? Is it being pushed down? Where does the local population live? So you know you can determine resulting level of
ambient air quality. You can estimate the human exposure. See, wow, if this thing's near or if it's close to an
urban area with a high population, that's worse for humans at least. You know, if that damage function is a
direct damage function, right? We're just thinking about human direct human exposure versus if it's a rural area,
not a lot of humans. You can estimate the physical impacts and you can determine the values associated with
these impacts. The key is to accurately determine the value of the impacts, right? So, that's the hard part, right?
What kind of values are we talking about here? And um you know is it okay is it okay to harm you know what's an
accept acceptable level of harm? Who's the person you're using? Are you using a healthy adult? Are you using a you know
a child um are you know a newborn who hasn't you know developed all of their sort of you know capacities to deal with
negative environmental uh effects? Are you uh using an elderly person who's frail and you know otherwise you know
highly susceptible to any changes in air quality? Are you using a person that has significant asthma or lung rellated
issues? Right? Where is your sort of measure of human impact and you you know what are you using? So are you using the
least common denominator, right? those that are most affected by any changes in good air quality or are you going to
use, you know, sort of the the person, you know, as your reference point, the the per the average superhealthy normal
adult person, that kind of thing. And so some problems with this direct damage approach, the basic problem is
almost always it's seriously incomplete. And the best example, and I think this comes from Teenberg as well, suppose we
estimate the direct damages of you getting a head cold. we can come up with a direct cost of whatever the aspirin,
whatever the remedy, the thing that allows for your head, you know, the discomfort that you're experiencing that
the symptom basically of the head cold, mainly the throbbing head. There's also congestion, that sort of thing. Let's
just say the the thro the headache. We're just reducing the headache and it's a$127. They could be more, it could
be less. Yeah. Is this the true value of the cold? So, when you think about the effects of the cold, right? Is this what
you would be willing to pay to avoid the cold? So if you're saying, you know, is a$127 a a quality representation of the
effects, all of the impacts of having a cold? Now, if you lose a day at work, you can certainly say, well, no, it's
not just the the thing that reduces the discomfort of the cold, the actual direct, right, um, uh, remedy and the
direct uh, sort of harm. But it's also a lot of sort of indirect things. Um, again like the soil for producing the
crops, you know, I I work and I only have a limited amount of sick days. And if I'm not at work and I don't have a
sick day available, then I don't get paid for that day. So, or even so, even if I do get paid, I lose a sick day. So,
that sick day is no longer available for some other sickness, some other purpose, right? That resource of sick days is not
infinite. It's finite. I only get 10 a year. That sort of thing. So, if I use one, I only have nine now. And if I get
sick with some other problem um that causes me 10 days of illness, now I only have nine days of sick leave instead of
10 in order to, you know, deal with that. So, I've reduced my capacity. So, maybe that's an an additional cost we
need to consider. And by the way, being sick is terrible, right? Being sick stinks. Um there's a personal um
well-being, right? A personal sort of quality of life uh question when it comes to being sick. So, you can think
about that. So the basic problem with direct damage approaches when we only look at the direct damages as maybe you
can figure this out from an environmental policy. So thinking again of environmental policy what is it what
is it meant to do and what do we consider when we implement environmental policy if we just look at that direct
damage approach it's probably limited. We're probably not thinking of all of the things that are important to think
about. Here's another example, uh, another sort of curve or relationship of ambient SO2 or
sulfur dioxide, which is the main thing that comes out of those, um, when you're burning coal, those smoke stacks that we
were just talking about. And what we can see here is a relationship that shows the the housing price, the value of the
home goes from zero to infinity, and the particulate content of ambient air. So how much uh sulfur is in the air around
you? So it goes from zero to the left to infinity to the right. So as the housing price increases as we can see on the
what we call the x- axis uh but the going up as the housing price increases um we see that the particulate content
is zero. The most value you can get out of your home is with the cleanest air with the least amount of sulfur in the
air. As the amount of sulfur increases in the ambient air around, the value of the home, what you could sell the home
for, decreases. And that should make sense to most of us because it's like trying to sell farmland
that's full of contaminated soil where you can't grow anything that you can then feed or sell to humans, right? It's
the same thing. It's like if that soil is in perfect condition, completely arable,
no toxicity, no bad things for humans that would then be absorbed into the things, the plants that we're growing to
consume, then it's like having a house with no sulfur around, right? Really good air quality. You could think of
noise quality, right? not a lot of noise, no uh you know the house that's further away from that train that makes
a lot of racket or you know or the construction it just you you understand there's a a number of ways to look at
this but so the house that's um in the cleanest air environment is going to be worth more than the house that's um full
of you know sulfur and acid rain and um you know poor air quality. So as the level of SO2 increases the value of the
home decreases all the other things being equal and this tells us there is a direct value to environmental quality
and so we can see that what if the cost of reducing SO2 concentrations was less than reduction in home value you know
how much your home reduced would that alone justify a policy of reducing uh sulfur dioxide emissions in the area and
if not what else might you want to consider so that's relevant right if we're thinking of environmental policy
like yeah okay if this is true. And again, all other things being equal, you know, maybe the if the home is in
Manhattan or in Midtown Chicago, I'm sorry, downtown Chicago and it's next to the, you know, subway station or the L
train if it's Chicago. But the point is if you might be willing to pay more for that house even though there's a lot of
noise because it's located close to all of a bunch of other things that you highly value. um close to your work
where you make a lot of money because it's in you know middle of the city close to uh all the things all the food
all of the you know social all of the all of the things that you value highly. So that's the all of the things being
equal. Um here we're saying this is the same kind of house in the same kind of location with the same kind of um you
know uh otherwise other demand you know other consistent demands uh and values that people [snorts] would value. So,
you know, if we could reduce the SO2 emissions for less money than the um reduction in housing price, would it be
worth it? And then the question is maybe yes, it sounds like it from a pure academic standpoint, but then again, I
understand that I'm helping to maintain the housing value of some individual or individuals in an area at the expense of
doing some other things. Again, it's the other example I used. If you're spending $7,500 as the federal
government to pay back somebody to give somebody as a reduction in what they in buying a batterypowered car,
then that $7,500 can't be used for a litany of other purposes. It's no longer available for those other purposes. It
goes directly to that individual who purchased the batterypowered car. Nobody else. It's not like that person shares
it with you. They get it for their car and hopefully if there's enough of them collectively, assuming that the
electricity that they're using to then charge up their batteries doesn't come from dirty sources, they are then
reducing the aggregate amount of carbon that is in our atmosphere in an incremental marginal way for themselves
and for everybody else because we all benefit from less carbon in the air. So them not pumping out carbon by burning
gas does help on the margins. All of us, but they are getting the $7,500. They're not sharing that with
anybody else. Now that works great for those people that can afford that car, that can afford upfront to pay for the
higherric batterypowered car. Correct? It doesn't work so well for those that cannot afford it because they cannot get
that credit. That credit is after you purchase the car, not before. Although I should say there are some interesting
financing options where the dealer will take on that. If you sign over the right for the credit, then you get it off at
the time of purchase. So there are al there are ways around um you know having to wait to get the value of it but let's
just assume for the most part that doesn't exist and that you know it's really a benefit for those that can
afford to pay upfront. So if we think of that or if we think about in this case reducing spending federal dollars the
equivalent of that $7,500 to help reduce sulfur emissions in that area. If it's less than the cost is less then with a
reduction in housing price that's great but it helps to maintain and increase the housing price of those individuals
who own those homes. There is a benefit that occurs to all the people in that area for a higher quality air no doubt
and that benefit even is not equally distributed. And what I mean by that is those that are more sensitive will
benefit more than those that are less sensitive to the lower quality air. And that's the truth and we need to consider
that. But the point is um would it justify you know alone just that analysis? Would it justify yes we should
do this? We should reduce the sulfur emission simply because it will maintain the housing price. We have to think
about well does that really make sense? And what does it mean in terms of making sense? Is it okay if the benefits of
this program go to certain individuals and those benefits on the margin are much higher for those individuals? They
benefit more than the distributed benefits of the reduced sulfur for the population at large. Is that an equity
issue? Is that a value issue? We need to consider something to think about in terms of costs, in terms of
opportunity costs. Whenever resources, natural, financial, are committed to one enterprise, they can no longer be used
for some other activity. This loss of potential use for other purposes is considered an opportunity cost. So, as
I've been saying, when that $7,500 is used in order to reimburse somebody for buying a batterypowered car, that
money is no longer available for any other use by the federal government. When the federal government decides to
spend $2 trillion on, geez, that's a lot of money. I don't think it's $2 trillion, but let's say a trillion
dollars on defense out of a $4 trillion budget. that trillion dollars that 25% of the entire budget that is not
available for any other purpose. It is simply going to defense gone for any other purpose or use. So we need to
think of the opportunity cost. Whenever we commit resources in one place then they are no longer available for some
other purpose. And so instead of creating a reduction in sulfur the money could be spent on compensating people
who suffer higher incidents of asthma. There's one example because if you create the reduction in sulfur in our
example from the previous slide, the homeowners certainly benefit if it's maintaining the value of their home. And
there's other benefits because if their home is valued more than the assessment on that home for taxation purposes is
probably higher and therefore the amount of property tax income for the community is probably higher. I mean, there's many
ways and many layers to this onion. Many ways to look at this. Um, it's not an all orno. Never in policy is anything
simply an all or nothing or a binary choice. It's either a one or a zero or a yes or a no. It doesn't really work like
that. But we can see putting aside some of the nuance that yeah if most of the benefits acrew to homeowners and that's
a segment of society maybe it would be better to just allow the pollution and instead of spending that reduction money
the money it would cost to reduce or abate the damage and the pollution and spend it on compensation. Maybe it's
better to compensate those individuals. And then there's environmental costs. So environmental protection programs
also result in environmental costs. And that's maybe funny enough, but reducing airborne sulfur emission power plants by
stack gas scrubbing also leaves a highly concentrated sludge that must be disposed of in some way. So in other
words, if you're going to reduce sulfur emissions, it's not by preventing the sulfur from being on the coal. It's
actually stopping or trapping, scrubbing they call it, but trapping that sulfur before it makes its way up the smoke
stack and out into the atmosphere. It's grabbing it before it leaves the facility. It's still being burned. It's
still there. It's just capturing it like a big filter. And then that filter, you know, that that stuff has to be disposed
of and it's toxic. So, you know, you think about those costs of implementing an environmental policy must also be
considered. um people have talked about for battery powered cars now you know we're getting to the point where we have
what uh I don't know million mile batteries that those batteries that and you know are the lithium ion batteries
that are being produced in you know present day are capable of you know continually being used for the
equivalent of a million miles of driving and most of those cars will break down well before then. So you know those
batteries have other uses and um you know so but aside from that as that technology progresses and as it evolves
um aside from that there is the problem with you know both sourcing of at least lithium ion batteries right the sourcing
of it and all of the attendant costs sourcing with mining lithium lithium is a rare um it's a rare element it's hard
to find it's only in certain places and most of the time you have to do a lot of digging and It occurs in countries where
maybe um a lot of that is happening and maybe not the most sort of um I don't know environmentally uh aware way. Um
but there's more than that. It's just even just the components. Um they are not in and of themselves. They're
they're not something that can be easily disposed of. Uh so end of life uh disposal just like having the sludge
from the sulfur the batteries when they're no longer viable to be used. What do we do with them? How do we use
them? Again, some of this is being um considered and resolved now to some degree, but uh it's still an open
question. And so the point is there's always costs. Even environmental policies when you're meant to reduce
something in one area or protect something or resolve one environmental issue, you end up creating um a maybe
subsidiary but another environmental issue to consider. Enforcement costs. Most environmental
regulations are not self- enforcing. Thus, the enforcement costs, government spending on EPA, environmental
protection agency here in the United States, personnel, etc. must be considered in any environmental policy
program. Makes sense, right? So, it's not you think about the program of the tax rebate, um monitoring that, ensuring
people are properly um identifying that they have that vehicle. At the federal government level, it's a tax credit.
In Massachusetts currently, it is a rebate check that is given to you. So, it is an after the purchase rebate that
is provided to you. So, in Massachusetts at least, for example, if you were to purchase a batterypowered vehicle, you
would be entitled to a $2,500 rebate in Massachusetts. Now, in order to get that rebate, you have to purchase
the car. Then, you have to apply for the rebate. There has to be this government entity and these individuals that are
paid by the government to receive your to develop the application to um receive your application to process your
application to determine whether or not you've actually purchased the batterypowered car that qualifies for
that $2,500 rebate. to receive the funding from the state legislature, to um you know, put that funding in its
proper place, to account for it, to monitor it, to then send and cut the checks, to provide all of all of the
attendant resources and everything, the bureaucracy that is involved with government doing something something
new. If we didn't have this program, those individuals, those resources, all of that attendant cost with the
bureaucracy of developing this government agency in order to ensure that there is a proper, you know,
process and then enforcement of this rebate for buying batterypowered cars in Massachusetts. It wouldn't exist if
there wasn't this environmental policy, if there wasn't this rule, this law that had been put in place. So there are all
of those attendant enforcement costs and they exist everywhere whenever there's an environmental issue.
And then there's the question of efficiency. Remember we are looking at the most efficient policy program, the
one that best balances the relative benefits with the attendant costs of a program. The more comprehensive we can
become at considering all costs and benefits of a program, the better the environmental policy. Generally
speaking, all of that nuance I mentioned just a little bit ago, all of those sort of let's put this aside because there
are nuances, they are really important because if you're going to get to the bottom of whether or not there's an
efficient level, there's a perfect level. If you think of that curve, the two curve, the benefit cost analysis and
where those two lines meet. If there is truly to know where those two lines meet, you truly have to know all of the
attendant benefits and all of the attendant costs and not just the direct ones, not just the obvious ones, but the
not so obvious or the indirect or non-attendant, you know, the sort of trickle down benefits and costs because
they happen. And then often even when you account for them, you can have the alternatives analysis which is okay. So
if we reduce sulfur emissions, good for the homeowners, but maybe it's better to just pay use that money that to reduce
better to just pay individuals who suffer harm. Maybe that's better. Maybe that works out better depending on all
of these sort of like um connected sort of um dominoes, you know, that are from that different analysis of relative
benefits and attendant costs. So, let's measure all of those different things and let's do a sort of comparison of
different ways of doing this. Try to determine all of the benefits and costs and then make an informed decision.
And of course, even in the process of doing that, there's a lot of time and energy and expense that is incurred. So
even government considering doing a policy versus B policy versus C policy requires time, energy and resources.
So how do we internalize costs? Do we for example privatize the resource? Maybe it's just better for example, one
example is hey let's just privatize the air. Let's have the company, the coal company for example, or the electricity
generation company who's using coal, let's have them buy up the air around. Purchase it. Literally purchase. Let's
come up with a number. Let's come up with an amount. We can do that. We can figure out, you know, relative to the
damages that are going to occur, the reduction in home values, etc., etc. Let's just come up with a number. Let's
have them purchase it. Let's have them buy that upfront. And then they have the right to pollute the air because they've
already bought the resource. They can do what they want with the resource. They've paid for the pollution upfront.
And then we can use that money in a variety of ways. It's income. It's direct. We, the government, can use it.
It's a one-time deal because usually when you, you know, privatize a resource, it's not just for a day. But
there's also that you can, we do this in fishing in the United States to some degree. We can do um we can we can
provide individuals with the right to fish a particular area of the public domain. The the oceans are owned by the
public. They're not owned by private individuals. You know, so we think of the United States exclusive economic
zone 200 um nautical miles uh from the shoreline and the state has an interest as well for about three nautical miles.
But if there's a coastal state, which there always is. Uh but then you know the point is government owns that
resource and anything that's in it. So basically when you think of fishing like commercial fishing, it's really giving
individuals a right to go out and capture a public resource and the that right can be given for a period of time,
can be given for a year. And they have that right and that is their right. And sometimes they can even trade that
right. They could sell it to somebody else for the period of time that they have it. Sometimes it can be forever. Uh
sometimes they can be given that right for you know in perpetuity but can be repealed at any time by the government
because it's the government can't just give away public resources. So you know um it can grant a lease. We do this all
the time, right? Oil, offshore oil and gas leases. Think of those uh as another example where we're giving a right for
some private individual to go out into a public resource, the ocean, you know, go drill down into the bedrock, find oil,
public resource in a public area, uh and then capture that public resource. And it's usually the moment of capture where
we transition where that public resource now becomes private. So the oil that is brought up or the fish that are caught
now once they're captured are now the property because that's the incentive. They're paying, these companies are
paying, you know, the fisherman's paying for everything to go out and fish. They're paying for all of the resources
and capital to go do that plus their time and energy. Same thing with the oil and gas companies. They're going out and
spending all of their capital. So, that has to be a benefit for them to do that. And that is once they've captured that
public resource, they now have it in its private and now they're going to help put it into our hands. They're going to
make it a public net benefit. Uh so, but that's can be for a period of time. could be for a year, two years, could be
six months, a season, you know, 10 years, indefinite until, you know, decades, that sort of thing. Leases for
periods of decades, so on and so forth. So, we can do this where we privatize the resource and give that person a
right to give that entity, that private individual a right to the resource. And we can limit it. It could be forever,
but it could also be for less. So here are examples to put all of this into context in terms of trying to
understand environmental policy. So here we're going to do and we're going to do it with automobile policies based on
pollution. So current day we want to reduce the amount of pollution. We can call it carbon for
sure. Um and so internal combustion engines and really you know old cars. Old cars low miles per gallon. They're
dirty. Not only are were they, you know, designed for bigger engines, you know, less fuel efficiency, that's how they
were designed, but certainly because they're old, they just don't operate as well as they used to. So,
here's our first scenario to consider in terms of a policy to deal with polluting cars. The use of certain automobiles are
simply banned based on the emissions, generally older, cheaper automobiles. the individual is left to purchase a
newer vehicle or find other means of transportation. The government offers no aid, no subsidy to those who are
affected. So, we can think about this. This is incredibly efficient from an efficiency standpoint. It's like if you
want to lower automobile emissions or you know the pollution that comes from automobiles, banning um automobiles
based on emissions like those that emit a lot is the simplest way to do it. It's the fastest way. You know, the what is
it? The shortest distance between two points is a straight line. This is the straightest of lines between those two
points. Could not be more direct. And if we're thinking about efficiency of policy, like does the policy meet its
intended goal? I can't think of something that is better than this in terms of getting to that goal quickly.
You simply get rid of those gasg guzzling pollution prone vehicles. Of course, we can think about who does this
affect? Who generally owns older, cheaper automobiles? Rich people or poor people? We can slice
this many different ways, but just, you know, for time purposes because we don't have forever and ever, and this is
already a long introduction to environmental policy, but not too long. Um, but if we just look at it, is it
wealthy people or poor people? And even if a wealthy person has an older, cheaper automobile, what can the wealthy
person do if that automobile is banned? They can easily afford, right, a non-banned automobile because they're
wealthy. So we can say that this is incredibly efficient, but it has probably a disproportionate impact.
Think about that. Let's hold on to that. Scenario two, the government caps the amount of miles allowed to be driven by
any particular vehicle. So instead of banning it says okay um we have a pollution measure. So the
amount of miles is based on this pollution measure of a automobile. If you're an older car you know and you're
more polluting then you can travel less. You know there's less miles to drive. If you're a newer car or more fuel
efficient car generally those correlate then you can drive further. So in this case older automobiles generally can
only travel 5,000 miles per year under the program. So if you have an old automobile, you can still use it but in
a limited way. So this cap is different from the ban. It's easier or less dramatic on the enduser because it still
allows the people who can only afford and have older polluting automobiles. It still allows them to use their
automobile just a lot less. Now many of you might say 5,000 miles per year. Well, you know what? I work from home
now or, you know, I'm in a COVID to postcoid world where, you know, um I don't, you know, that's okay with me.
But for most people, they say 5,000 miles a year is nothing. That I'll be done with that in a couple of months. Um
so that doesn't really help. That's just not great. Now, of course, it's better than the banning legislation, right? You
can still use the car. You just can't use the car a lot. Of course, on the other side, shortest
distance between two points, straight line. This line, this line of a cap in comparison to banning legislation is a
little more squiggly, right? It's a little longer. It's not as straight, right, as the banning legislation. So,
it does not meet the goal as well, but it's a little bit fairer. Scenario three, government places a tax
on emissions of all automobiles. Every automobile there's a tax and it's based on emissions. Now when the factors are
considered are miles driven per year and the emissions of the automobile. Those with a higher emission vehicles pay a
rate a higher rate per mile and those who travel more miles pay a higher tax and everyone is subject to the tax. Now
if you're driving a battery powered car and it has truly zero emissions doesn't matter I guess how many miles you travel
per year right? because it's miles driven per year times the emissions of the auto. If the emissions of the auto
is zero, the amount you're going to pay is probably going to be zero. If you have a hybrid, you know, a car that has
an internal combustion engine, that's super efficient. Obviously, you're going to be able to
drive a lot more miles driven per year if you're making 60 miles per gallon, for example. Um, because the emissions
of the auto is a lot lower. So, the amount you're going to pay is less. Now, if you have a clunker that gets 10 miles
per gallon, you know, and you still drive 15 20,000 miles per year, you're going to pay a lot because it is a rate
per mile. Now, the benefit here of this tax is it is going to cost those who cause the
most emissions a lot more money than those who have no emissions, pay zero, or much less emissions, pay a little
bit. And over time, that should incentivize people. It allows you to travel. If you have the clunker, you're
not limited to 5,000 miles a year. You can go 20,000 miles. You're just going to have to pay for it in addition to all
of the other things you have to pay for. Pay for more gas because you get less miles per gallon, so on and so forth.
But no limits, no 5,000 milei limit, no banning legislation. You can you can go as long as you want, as long as you can
afford it. And certainly if we think about it, if this tax is directly related to emissions, so the money it's
generating is based directly on emissions. Now, if government is doing its job right, call it something like a
PGOian tax. You can look that up. If government's doing it right, then it's going to take
all of this income, all of the money it makes, and it's going to use it directly directly for mitigating and reducing
carbon emissions. So in the case that we've talked about when money is taken from one thing it is no longer available
for that thing because it's being used for something else. Right? We talked about that in a finite world. Well, in
the tax situation, if this tax is being used to raise money to combat carbon, the emissions of carbon in the
atmosphere, then this is money if it's being all earmarked for that purpose that is being
generated through the tax for that purpose. So in this case, we can say money income. we have an income stream
to directly generate funds to to deal with carbon emissions. And there's a variety of ways we can deal with it. We
can then use that money, right, to incentivize the development of batterypowered automobiles to reduce
$7,500 rebate, $10,000 rebate, now $12,000 rebate, $15,000 rebate. Get your, you know, batterypowered car. help
the manufacturers lower the price of those cars by making more and more of them and help the consumers afford the
car by making it cheaper and cheaper, right? Ah, you're paying $10,000 a year because you have a clunker with this tax
just to ride the car because of the carbon tax. 10,000 in carbon tax, man. Wouldn't you rather get a $10,000 rebate
if you just go you you see the point here? So, the tax can be highly efficient if it's used properly. Now
it is not a direct line necessarily right if we think of the shortest distance between two points the banning
legislation seem like a straight line this is I said direct line and a straight line I'm sorry it's squiggly
but depending on how it's used it might not be super squiggly it might be relatively straight it all depends on
how that money is used and the effect of the tax and of course what matters there what is the rate set that how much does
the worst offenders end up paying. Getting the price of carbon right really really matters here really really
matters. So, you know, getting that tax rate right, you know, the amount of money you pay per mile, that sort of
thing depending on your emissions amount, how much you're paying. You don't, you know, it's this is again a
Goldilock scenario. If you charge too much, it ends up being banning legislation, right? And if you charge
too little, well, then it's kind of like a free-for-all. If it's not a lot of money, then people will simply
incorporate it into the cost of doing business and it really won't lead to different outcomes. However, you will
still receive that income stream, less money to be used to mitigate the effects of carbon in our atmosphere in other
ways. So, it still provides government with a new resource that it didn't have otherwise. It's taking money from
consumers and you know increasing its budget for carbon reductions or carbon mitigation in other ways depending on
what environmental policy they choose. Point is you can see the benefit of a tax um in terms of its sort of um its
variability in in approach. And again here in terms of fairness well it's unfair for those that have you know the
dirtiest cars that can't afford to pay the tax. Maybe that ends up resulting like banning legislation, ends up being
like banning legislation for those individuals. But the benefit here is it instead of just the banning legislation,
which applies to certain vehicles, this applies to every vehicle. So everybody's paying for their relative amount of
emissions, which is different than many of the other examples we've used, which is showing that well, if we're going to
reduce sulfur, we're going to increase home prices for some people. If we're going to give $7,500 back for buying a
car that's not coming from this kind of sourcing of funds, right? Uh for buying a battery powered car, it's only those
individuals that are buying battery powered cars that are going to benefit from that, you know, and then the
benefits of lower carbon are, you know, sort of in the population in general here. More people pay more people pay
into the system. Final scenario, government distributes rights to air quality to private
individuals through a bidding process. The private individuals own those air rights including the quality of the air.
The private individuals can sue those who harm air quality without agreement to do so. You know, so the people that
are uh and enforcement is through the courts. So in this case, think of a
situation where we talked about before the you know power generation company, right? They coal burning power
generation company wants to buy the air around it so that it can throw sulfur into the air. That's one way to look at
it. Another way to look at it is the National Environmental Organization buys the air rights around a power generation
company and says, "Yeah, that's my air. I don't want anything coming into that air." And then the power generation
company says, "Oh, geez, I'll pay you xxx, you know, and uh and uh it's up to that company, that entity, the let's say
the environmental um organization whether or not that amount they're willing to pay is high enough." Of
course, to a point, you know, um the power generation company will never pay more than whatever value it can get out
of dirtying that air or putting the sulfur in the air because otherwise it'll engage in some other right choice.
It'll filter it out. It'll pay for the filtration technology if it's cheaper or um if paying for that air to dirty the
air cost them too much money more than they can make uh either break even or make a small profit in generating the
electricity, then they'll simply choose to go out of business. But the point is the private rights is transferring, we
talked a little bit about this before, is transferring that right to some other entity and letting the market figure it
out. And so you care about air quality, then environmental organization raise enough money to purchase the air rights
and then just leave them alone, protect them. Nobody can then dirty that air. If you power generation company care more
about using it and it's cheaper for you to buy the air right than it is to buy the technology to scrub the sulfur out
or to you know stop using coal and figure out another way natural gas or some other non-sulfur producing right or
let's do a wind farm or let's do a solar farm you know if it's about carbon um then you know then buy that air right or
engage in that alternative activity but otherwise government gets out of the process of trying to figure out what's
the best use. It starts the use but like in the fishing example or in the oil and gas lease offshore oil and gas lease the
air is a public good but if government can then you know divest itself of that public good for a period of time give
somebody else the ability give the market effectively the ability to determine what is the right price. So in
this case you can look um so in the tax case we can look at paggo or piggovian taxes for efficiency purposes and in
this case we can look at coast theorem if you want to the notion that if you just privatize everything and I'm
oversimplifying this significantly folks so but the the idea the general idea that if you privatize
um all different kinds of what we normally consider public or common goods if you privatize them then the markets
can figure it out and as long as you have direct access to the core courts in order to enforce your rights. Quick and
easy access transaction costs. Going to court is is timeconuming and expensive. So you want to reduce those transaction
costs. But assuming you can uh and you have direct access and easy access to these um you know to these enforcement
mechanisms, then maybe privatization really is good. So let's just look at these scenarios
quickly uh as a sort of summary um all four of them and think back to their sort of the efficient level of
emissions. Our little friend over here if you remember the efficient level of emissions um
scenario one banning legislation super efficient has equal application but a highly unequal impact. It is truly the
shortest distance between two points. It applies equally but in terms of you know all cars that
meet the requirements. So it's equal in that sense but its impact is highly unequal
meaning that those that can least afford newer cars more efficient cars are the ones that are going to be most impacted.
Scenario two cap and trade. you know, older 5,000 miles a year, more pollution, but less unequal impact.
So, it's a little less unequal, but we get more pollution. We get that squiggly line, you know, instead of a straight
line between those two points. Scenario three, the tax on the miles driven times the amount of pollution. That's even
more pollution, right, than you know the uh second, right? Likely because there's going to be those people in between. but
an unequal impact, but a lot more choice. There certainly is an unequal impact. Those that can't afford that
drive the older cars are going to pay much more. But there's more choice. There's more incentive for alternatives.
And if that tax revenue is being used well, then it can mitigate the effect on those that are least capable of
affording the alternative. You could give more money to those that can afford a newer car to help them afford a newer
car through this sort of tax if it's working correctly. Pgovian scenario four privatization right to air
quality pollution level is sensitive to supply and demand. So depending on, you know,
where the sort of market is, depending on who has access to capital and how much they're willing to pay for the
right to either pollute or protect the air resource that will define the market will sort of define and that we can
think of uh coast theorem, Raml Co and Coast theorem and you know we can think in that
scenario direct versus other damages you know so it's paying for what What are you paying for exactly, right? Are you
paying to pollute? Are you paying to protect? Are you paying for, you know, an opportunity to to just maximize the
income potential of, you know, of the air? That kind of thing. So, thank you very much for listening to this. I I
hope uh you get a a a good introduction or you've received a good introduction to environmental policy from this
perspective, our sort of values, science, and economics. uh and the shared space that they exist at. So what
you should get from this is yes, environmental policy is incredibly complicated. It is um because like any
other policy, it is conditional. It's conditional on factors that are somewhat objective and most importantly, like we
said, values, factors that are highly subjective and subject to change and even subject to change based on what
we're talking about, what we're trying to do. Many of you might agree that protecting
the air is important or good environmental air quality or carbon reductions are important. But how we do
it, those four examples, for example, um some of you might disagree significantly with some of those options. You might
disagree with all of them and some of you might agree with most of them or some of them. And certainly you probably
have preferences one over the other, this one over that one. So the point is even when we agree on the goal, often we
can disagree on how to get to that goal. And that is incredibly important to know when you're trying to understand and
think about environmental policy, especially environmental policy in context, what it applies to. So thank
you again for your time. Uh I hope this was helpful for you.
Environmental policy is created at the intersection of societal values, science and technology, and economics. Values are the most important factor, guiding resource allocation, while science and technology provide solutions that become cheaper over time. Economics offers analytical tools like cost-benefit analysis, which are influenced by value judgments.
New technologies (e.g., solar panels, battery-powered cars) are initially expensive but become cheaper through adoption, economies of scale, and innovation. Policy can accelerate this process by setting future standards or providing incentives, creating predictable demand that encourages private investment in research and development.
The efficient level of emissions (E*) is the point where the cost of reducing one more unit of pollution (marginal abatement cost) equals the damage that unit would cause (marginal damage). Going beyond this point would cost more to clean up than the damage it prevents, making zero emissions economically inefficient.
The three types are: direct damages (e.g., harm to humans from lead poisoning), indirect damages (e.g., environmental harm that degrades services for humans, like water purification), and non-use values (e.g., harm to unique species or wilderness not directly used by people). Measuring damages is challenging and always incomplete.
Every dollar spent on one policy (e.g., reducing SO₂ emissions) is a dollar not available for another purpose (e.g., compensating asthma sufferers or funding different programs). Opportunity cost forces policymakers to consider not just total benefits, but who benefits and what alternatives are foregone.
Beyond direct abatement costs, policies have environmental costs of solutions (e.g., toxic sludge from SO₂ scrubbers, lithium mining for batteries) and enforcement costs (e.g., government agencies, monitoring, compliance processing). Every choice involves trade-offs between different types of costs, benefits, and affected groups.
Values determine how society prioritizes finite resources like government budgets and natural resources. While science and economics provide objective data and tools, it is values that guide which problems to address, which trade-offs to accept, and how to weigh subjective factors like non-use environmental values.
Keep this summary
Save it to LunaNotes and it becomes a real note in your library — editable, searchable, and ready to turn into flashcards or a diagram. Free to start.
Save to LunaNotesOr summarise for another video.


32K+ people have turned 65K+ videos into notes
“Very useful tool. I'm using it for the last couple weeks and I'm loving it so far. Makes learning on YouTube a great experience.”
 Bhai Chrome Web Store review
This summary and transcript were automatically generated using AI with the Free YouTube transcript summary tool by LunaNotes.
Related summaries
Understanding Air Pollution: Causes, Effects, and Solutions
Explore the causes and effects of air pollution and discover practical solutions for a healthier planet.
Understanding Pollution: Causes, Types, and Global Impact
This video explores the various forms of pollution—soil, water, and air—their causes, effects on health and the environment, and global consequences. It emphasizes the importance of collective responsibility in reducing pollution to protect our planet.
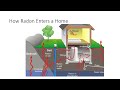
Understanding Air Pollution: CO2, Indoor Pollutants, and Noise Pollution
This comprehensive presentation covers the various aspects of air pollution, focusing on atmospheric CO2, indoor air pollutants, acid deposition, and noise pollution. It highlights the sources, effects, and mitigation strategies for each type of pollution, emphasizing the importance of understanding human impacts on the environment.

Marginal Analysis Explained: The Efficient Decision-Making Principle for Economics
Learn the core concept of marginal analysis in economics, where individuals weigh additional benefits against additional costs. This guide uses the dollar bill game and real-world examples like studying, eating, and crime safety to show how to make efficient decisions. You'll master the rule: keep doing an activity as long as MB > MC, and stop when MB = MC.

The Urgent Call for Climate Action: Our Responsibility to Save Earth
Explore the critical state of our environment and what we can do to combat climate change.
Most viewed summaries

A Comprehensive Guide to Using Stable Diffusion Forge UI
Explore the Stable Diffusion Forge UI, customizable settings, models, and more to enhance your image generation experience.

Kolonyalismo at Imperyalismo: Ang Kasaysayan ng Pagsakop sa Pilipinas
Tuklasin ang kasaysayan ng kolonyalismo at imperyalismo sa Pilipinas sa pamamagitan ni Ferdinand Magellan.

Mastering Inpainting with Stable Diffusion: Fix Mistakes and Enhance Your Images
Learn to fix mistakes and enhance images with Stable Diffusion's inpainting features effectively.

Pamamaraan at Patakarang Kolonyal ng mga Espanyol sa Pilipinas
Tuklasin ang mga pamamaraan at patakaran ng mga Espanyol sa Pilipinas, at ang epekto nito sa mga Pilipino.

How to Install and Configure Forge: A New Stable Diffusion Web UI
Learn to install and configure the new Forge web UI for Stable Diffusion, with tips on models and settings.
Found this summary useful?
Take it with you. One click puts it in your own LunaNotes library.
Save to LunaNotes