Overview of the Experiment
In this mini experiment, we aim to determine the frequency of a tuning fork by analyzing its sound waves. The process involves using software to visualize the sound and measure its vibrations.
Key Steps in the Experiment
- Striking the Tuning Fork: The experiment begins with striking the tuning fork to produce sound.
- Analyzing the Sound: The sound is analyzed using software that displays the sound wave on a graph.
- Understanding the Graph:
- The x-axis of the graph measures time, with each division representing 2 milliseconds.
- The total time displayed on the graph is 20 milliseconds (0.02 seconds).
- Counting Cycles:
- A cycle consists of one crest and one trough of the wave.
- Viewers are instructed to count the number of complete cycles visible on the graph.
- Estimating Fractions:
- The challenge lies in estimating any fractions of cycles that may appear at the edges of the graph.
- Calculating Frequency:
- After counting the cycles, viewers are guided to divide the total time (20 milliseconds) by the number of cycles counted to find the frequency.
Conclusion
The video concludes with a friendly farewell, encouraging viewers to enjoy the learning experience. For those interested in a deeper understanding of sound and its properties, check out our summary on Understanding Sound Absorption Measurement with an Impedance Tube. Additionally, if you're curious about the principles of oscillation that relate to sound waves, you might find our Comprehensive Overview of Oscillation in Edexcel IAL Unit 5 helpful.
good morning today we're going to do a mini experiment and try to determine the frequency at
which this tuning fork vibrates at so in a moment i'm going to strike the tuning fork and we're going
to use this software to analyze the sound of the tuning fork notice on the x-axis it says 2
milliseconds per division that means that the x-axis is measuring time and
every division is 2 milliseconds so all together from one side of the graph to the other
side of the graph that's 20 milliseconds or 0.02 seconds so let's roll the video
of the scope and see what happens so you're going to analyze this image taken from the previous video you just
saw you'll have to count the number of cycles i'll count one with you
a cycle is one crest and one trough now where does this get tricky it gets tricky at this point of the graph
where you'll have to estimate what fraction of a cycle that is once you've counted the number of cycles
we've already mentioned the total time 20 milliseconds as it says here two milliseconds per division divide the
two and let's see what you get for frequency hope you enjoyed this video have a great
day bye
The main goal of the mini experiment is to determine the frequency of a tuning fork by analyzing the sound waves it produces. This is achieved through visualizing the sound using software that measures its vibrations.
The experiment begins by striking the tuning fork to produce sound. This action initiates the process of analyzing the sound waves generated by the fork.
The software is used to analyze the sound produced by the tuning fork. It displays the sound wave on a graph, allowing viewers to visualize the vibrations and measure the frequency based on the cycles observed.
The graph has time represented on the x-axis, with each division indicating 2 milliseconds. The total time displayed on the graph is 20 milliseconds (0.02 seconds), which helps in counting the cycles of the sound wave.
A cycle consists of one complete crest and one trough of the sound wave. Viewers are instructed to count the number of complete cycles visible on the graph to determine the frequency of the tuning fork.
To calculate the frequency, viewers need to divide the total time displayed on the graph (20 milliseconds) by the number of cycles they counted. This gives the frequency in hertz (Hz).
For more information on sound and its properties, you can check out the summary on 'Understanding Sound Absorption Measurement with an Impedance Tube.' Additionally, for principles of oscillation related to sound waves, the 'Comprehensive Overview of Oscillation in Edexcel IAL Unit 5' is a helpful resource.
Heads up!
This summary and transcript were automatically generated using AI with the Free YouTube Transcript Summary Tool by LunaNotes.
Generate a summary for freeRelated Summaries
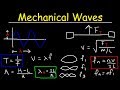
Mechanical Waves Explained: Amplitude, Frequency, Wavelength, and Harmonics
This video tutorial provides step-by-step solutions to fundamental mechanical wave problems, including calculating amplitude, wavelength, frequency, period, and wave speed. It also explains harmonic frequencies on a string, providing formulas and examples to understand wave behavior in physical systems.

Analyzing Sinusoidal Graphs: Amplitude, Period, and Solutions Explained
This video tutorial explains how to determine amplitude, midline, and period from maximum and minimum points on sinusoidal graphs. It also demonstrates solving equations and inequalities involving sine and cosine functions using graphing techniques.
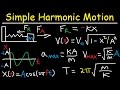
Comprehensive Guide to Periodic Motion and Spring-Mass Oscillations
Explore the fundamentals of periodic motion through detailed explanations of mass-spring systems and simple harmonic motion. Understand restoring forces, energy transformations, motion equations, and effects of damping and resonance, supported by practical problem-solving examples.
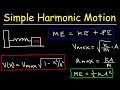
Solving Simple Harmonic Motion: Energy and Spring Calculations Explained
This video tutorial breaks down a simple harmonic motion problem involving a spring-block system. Learn step-by-step how to calculate the spring constant, amplitude, maximum acceleration, mechanical energy, maximum velocity, and velocity at specific displacements with clear formulas and examples.

Comprehensive Overview of Oscillation in Edexcel IAL Unit 5
This lesson provides an in-depth exploration of oscillation, focusing on key concepts such as equilibrium position, time period, frequency, and types of oscillation. It includes practical examples, definitions, and the relationship between oscillation and energy transfer, as well as the effects of damping and resonance.
Most Viewed Summaries

A Comprehensive Guide to Using Stable Diffusion Forge UI
Explore the Stable Diffusion Forge UI, customizable settings, models, and more to enhance your image generation experience.

Kolonyalismo at Imperyalismo: Ang Kasaysayan ng Pagsakop sa Pilipinas
Tuklasin ang kasaysayan ng kolonyalismo at imperyalismo sa Pilipinas sa pamamagitan ni Ferdinand Magellan.

Mastering Inpainting with Stable Diffusion: Fix Mistakes and Enhance Your Images
Learn to fix mistakes and enhance images with Stable Diffusion's inpainting features effectively.

Pamamaraan at Patakarang Kolonyal ng mga Espanyol sa Pilipinas
Tuklasin ang mga pamamaraan at patakaran ng mga Espanyol sa Pilipinas, at ang epekto nito sa mga Pilipino.

How to Install and Configure Forge: A New Stable Diffusion Web UI
Learn to install and configure the new Forge web UI for Stable Diffusion, with tips on models and settings.

If you found this summary useful, consider buying us a coffee. It would help us a lot!