Introduction to Psychophysics in Cognitive Psychology
Psychophysics studies the relationship between physical stimuli and the sensations and perceptions they produce. A foundational discovery was Ernst Weber's finding that difference thresholds increase proportionally with stimulus magnitude, known as Weber's Law. For a deeper understanding of these foundational concepts, see Comprehensive Guide to Sensation and Perception in Psychology.
Weber's Law and Difference Thresholds
- Difference threshold: The smallest detectable change in a stimulus.
- Weber discovered that for a standard weight of 300g, the difference threshold is about 10g; for 600g, about 20g.
- The ratio of difference threshold to stimulus intensity remains constant for a sensory modality.
- This relative constancy is expressed mathematically as ΔI/I = k, where k is a constant.
- Weber's fraction varies by sense; it is larger for brightness detection than for heaviness.
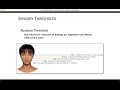
Measuring Sensory Thresholds
Method of Constant Stimuli
- Selects fixed stimulus values encompassing the expected threshold.
- Stimuli are presented in random order multiple times.
- Participants respond whether they detect the stimulus or its intensity difference.
- Responses are tallied to create a psychometric function plotting stimulus intensity against detection probability.
- The absolute threshold is defined at the intensity detected about 50% of the time.
Staircase Method
- An adaptive technique that adjusts stimulus intensity based on participant's responses.
- Stimulus intensity decreases after detection and increases after non-detection, forming a 'staircase'.
- Reversal points are averaged to estimate the threshold efficiently.
For more detailed procedures and threshold concepts, refer to Understanding Psychophysics: Methods and Thresholds in Cognitive Psychology.
Psychometric Functions and Detection Variability
- Detection is not abrupt but gradual, producing sigmoidal psychometric curves.
- Variability arises from internal noise in sensory processing and external environmental factors.
- Threshold definitions are statistical due to these inherent fluctuations.
Signal Detection Theory (SDT)
- Explains how decisions are made under uncertainty in detecting stimuli amidst noise.
- Perception is viewed as an evaluation of evidence combined with decision criteria influenced by costs and benefits.
- Two overlapping evidence distributions:
- Noise alone (lower mean evidence)
- Signal plus noise (higher mean evidence)
- A decision criterion determines the threshold for reporting detection.
Decision Bias and Response Types in SDT
- Hits: Correctly detecting the signal.
- Misses: Failure to detect the signal.
- False alarms: Incorrectly detecting a signal when none is present.
- Decision strategies:
- Liberal (low criterion): More hits and false alarms.
- Conservative (high criterion): Fewer false alarms but also fewer hits.
- Decision bias is influenced by factors such as motivation, expected payoffs, and perceived costs.
Practical Implications
- SDT models perceptual decisions beyond simple threshold detection, accounting for human factors.
- Understanding SDT and psychophysical methods informs experimental design in cognitive psychology. Detailed experimental design principles are available in Fundamentals of Experimental Design in Cognitive Psychology Explained and Foundations of Quantitative Experimental Design in Cognitive Psychology.
- These principles underpin sensory testing and threshold determination in various modalities.
This summary integrates core theories and methods from psychophysics and signal detection to enhance comprehension and application in cognitive psychology research and experimentation.
[music] [music] >> Hello and welcome to the course basics
of experimental design for cognitive psychology. This is the final lecture of week six where I'm going to be talking
about psychophysics. Now, Ernst Weber discovered an important property of the difference threshold. He
found that the difference threshold increases with increase in the magnitude of the standard stimulus. So, say for
example, if the standard stimulus is very heavy, then the difference threshold that will be required will
also be slightly larger as opposed to if the standard stimulus was small. Okay? So, he found that for a standard weight
of 300 g, the difference threshold is 10 g, but while for a standard weight of 600 g, the difference threshold is 20 g.
Okay? This second property was that for a particular sensory modality, suppose it
is light, suppose it is audition, suppose it is just weight, uh the size of the difference threshold
relative to the standard stimulus is constant. So, the ratio of 10 to 300 g is the same as the ratio of 20 to 600 g
as we saw in the previous example or the ratio of 40 to 1200 g. So, the same ratio still keeps maintaining.
Okay? Now, another important aspect in this is the Fechner's. Gustav Fechner basically called this relative constancy
of the difference threshold as Weber's law because this is what Weber had found. So, delta I, the difference, by
divided by is equals to a constant K. This is basically, you can see that whatever the relative stimulus is, the
difference threshold remains almost linearly increasing. Now, Weber's law or Weber's fraction
basically varies in size for different sensory modalities. For example, it is somewhat larger for brightness than it
is for heaviness. So, for you know, when you're testing for brightness, then the difference will
have to be larger for you to be able to detect the differences in brightness, whereas for weight, it will not have to
be that much different. Okay? Weber also discovered that the value of the difference threshold is about 2% of the
magnitude of the standard stimulus intensity, just around the same. So, it's not an exact number, but around 2%
of the magnitude of the standard stimulus intensity. So, you can see here,
this is the stimulus intensity and this is the estimate of the magnitude, and you can see it changes for different
things. So, for electrical shock or heaviness or loudness >> [snorts]
>> or brightness, the difference thresholds are slightly different. Now, how do we determine that? Let's
look at some more methods. Now, there's one method called the method of constant stimuli. Here, what happens is the
experimenter chooses a number of stimulus values, usually between five to nine values, which on the basis of
previous exploration, say for example, from literature, etc., are likely to encompass the threshold value.
So, you know, say let's say that the threshold lies at around, let's say 25 units. Now, what you will
do is you'll take five units below 25, five units above 25, and you'll basically try and vary between that so
that that, you know, due to several with several measurements, you can extrapolate or you can find out that
exact threshold value, which according to, let's say, previous research, lies between these two bands. So, this fixed
set of values is presented in multiple times in a quasi-random sort of fashion, and that basically, you know, ensuring
that, you know, each will occur equally often, and within that, the participant has to discover that, okay, where is the
actual threshold lying? After each stimulus presentation, the observer will report whether or not the
stimulus was detected. This is for absolute thresholds or whether its intensity was weaker or
stronger than that of a standard stimulus that for us to determine the difference threshold.
Now, once each value has been presented at least, let's say, a few number of times, let's say, 20 or 30 or 10 or 15,
the proportion of detected and non-detected responses is calculated for each stimulus level. So, for each level,
say for example, there are discrete steps, there are 10 steps. So, for each step, you calculate the proportion of
detected and non-detected responses. The data are then plotted with the stimulus intensity along the x-axis and
the percentage of perceived stimuli along the y-axis, and the resulting graphs will basically plotted as a
psychometric function. You can look at it here. You can see what is happening here. 50 presentations are happening for
each stimulus intensity. The stimulus intensity, let us say, are at 1 2 3 4 5 6 7.
The frequency of perceived stimuli one at one, they perceived it one time. At seven, they perceived it 50 time. At
four, they perceived it 20 time. Percentage of perceived stimuli, how many stimuli they were perceiving,
2 6 24 and so on, that is varying. What you What you're doing in the psychometric function is your percentage
perceived and stimulus intensity you are plotting, and you can see at the level of above 50%, you figure out that there
is your absolute threshold. Okay? So, this psychometric function is actually showing the relationship between the
percentage of times that a stimulus is perceived and corresponding stimulus intensity. So, at, let's say, 4.2 or 4.3
stimulus intensity, the stimulus is perceived more than 50% of the time, more than the chance level.
So, this becomes your absolute threshold. So, the absolute threshold actually is
this 4.2 or 4.3, whatever that value is. Now, note that if there were a fixed threshold for detection, the
psychometric function should show an abrupt transition from perceived to not perceived. You know, it goes till till
4.2, it goes not detected, not detected, not detected. At 4.2, at that threshold, it
becomes detected detected. So, you can see there is a gradual transition from perceived to non-perceived. So,
psychometric functions, that's why you can see, are generally sigmoidal, which basically reflect the fact that stimulus
intensities are detected occasionally, and higher values are detected more often. Intensities at middle are
detected sometimes and sometimes not because there is obviously various sources of noise in the detection
process. Other reasons why we get an S-shaped curve here would be the continuous
fluctuation fluctuations in the sensitivity of the various biological systems. Internally,
you know, with respect to the neurons in the brain, there is fluctuation in their ability to detect a particular stimulus
as well. So, extremely high will get detected all the time, extremely low will never get detected, but these just
about things, you can sometimes detect them and sometimes not. So, therefore, there is this careful transition that is
happening. These inherent fluctuations basically mean that then
that an observer must detect activity elicited by the external stimulation against a background level of activity.
There is some background noise anyway, some background processing is anyways going on.
So, the threshold that occurs within a certain probability, and its intensity value must be defined statistically. So,
that is why we need to carry out statistical analysis to figure out the exact absolute threshold for detecting a
particular stimulus using a particular sensory modality. By convention, the absolute threshold
with the method of constant stimuli is defined as the intensity value that elicits perceived responses on just
about 50% of the trial. As long as the perceived responses cross the level of chance, cross the level of 50% because
there's a bipolar judgment, cross the level of 50%, that intensity is referred to as absolute threshold.
Now, there is another method that we can use to detect absolute thresholds and difference thresholds, which is the
staircase method. It is a type of an adaptive testing procedure, which is basically used to keep the test stimuli
close to the threshold by adapting the sequence of stimulus presentations according to the observer's response.
So, basically, what you're doing is you're selecting a smaller stimuli to be presented, and these
methods basically, you know, they are more efficient because what happens is you are increasing increasing increasing
till the participant starts, you know, detecting it, and then you keep decreasing, and then when again it is
not detecting, then you keep increasing. So, you basically, you know, increase and decrease, increase and decrease
following a staircase method till you decipher a range within which the participant is almost certainly
detecting this. So, the staircase methods is very similar to the method of limits that we were seeing in the
previous lecture. What will typically happen is then observer may start from an ascending or a descending series of
stimuli. Each time the observer says, "Yes, this intensity changed." So, as soon as the observer says, "Oh, yes,
detected," the intensity can either be increased or by decreased by just one step.
This will continue until the stimulus becomes too weak to be detected. So, you're, let's say, decreasing. At this
point, what you do is you reverse this. As soon as the participant says, "Oh, I'm not able to see this," then you
decrease the change the direction, and you start increasing. At the point, participant will say, "Oh, yes, I am
seeing it." And again, then you start decreasing. So, you keep doing going up and down up and down the staircase,
and you do it a multiple number of times till you sort of figure out, you know, there there will be six or nine such
reversal happening to basically estimate the threshold at which, you know, you take the average of all of these steps,
the threshold at which the participant or the observer is consistently detecting the given stimulus. That will
become your transition, you know, point, and that will basically become the point at which it is detecting. You can see
here, as soon as it was being perceived, you bring down down down down down. As soon as the participant says, "Not
perceived," you increase it. Then when it says, "Perceived," you decrease it. Then he says, "Perceived," you decrease
it again, it takes two steps this time and it takes two steps the other side. So, you can basically you can see that
there is changing a lot of changing and there are these transition points and basically what you'll do is you'll take
take the average of these transition points. Now, so we've talked about how broadly
measurements in psychophysics work. Obviously, you know, you can design experiments using the method of
adjustment, method of limits, the adaptive methods like the staircase methods and so on. And you can use that
to determine the absolute threshold and the difference threshold for you know, a given stimulus across a sensory
modality. Now, there is something also which is important about this business of
detecting signals which is covered under what is called this
signal detection theory. So, let's say if we are not you know,
talking about thresholds. According to theory of signal detection, basically what happens is our perception
in general is controlled by evidence and decision process. We evaluate the amount of evidence that is
there for the presence or absence of a particular stimulus and then we make a decision based on that evidence, based
on the amount of evidence that is available. The process of figuring out this
evidence and making a decision is covered under what is called the signal detection theory and we'll talk very
briefly about that as well which is an because it is also an important aspect of the methodologies that are used in
experimental methods. So, typically what is said is that a signal or a stimulus creates a
distribution of hypothetical evidence that depends on the intensity of the signal
and the ability of the observer to observe it. So, which partly basically determines a yes response. So, there is
evidence in the stimulus and there is the ability of the participant to detect. Both of them will play a part in
determining your decision. There could also be obviously other factors including the willingness of the
observer to say yes. Say for example, when does the observer say yes? Whether he is whether he says yes immediately or
he takes more time to gather more evidence. What is the threshold of evidence when the observer will say yes?
That is broadly what we're trying to figure out. There are also response biases. So, for example,
whether the observer is lenient observer and he says yes at the drop of the hat or whether it's a very critical observer
that he needs a certain amount of threshold certain amount of evidence to accumulate before the participant says
yes. So, there are positive response biases as well as negative response biases.
Also, depending upon you know, how costly is the decision, the payoff for being accurate, the frequency of the
signal, there are several other factors that can play a part here. So, this is a theoretical diagram.
Sensory system, sensory module in the brain, evidence values. Evidence values basically feed into the decision module
and the decision module is affected in turn by payoffs, motivation, how vigilant the participant is, how rare or
how frequent a given stimulus is. And all of these together basically decide how or what kind of responses will be
made. For example, imagine that your friend has set up a blind date for you. The
costs are you know, let's say a wasted evening and they are probably less than the benefits that say for example, you
find an exciting new friend and many more in the future. In such a scenarios where the perceived costs are less than
the perceived benefits, the highest the highly likely response is a yes response. So, you can actually you know,
it will pay to be a liberal observer. It will pay to be a lenient observer. You will say yes more times than you will
say no. The decision therefore would be based on a cost-benefit analysis. Since the information about the stimulus is is
not there, you don't know what to expect on such a date. On the other hand, if the decision has a
high cost, suppose say for example, accepting or offering a marriage proposal. Now, you don't have to just
meet. Meeting goes well, meeting does not go well, it's just a wasted evening. But if
it is let's say a decision to marry or not marry somebody, that is a decision about a lifetime. So, that becomes
extremely costly decision. Those kinds of places people are you know, likely to become much more careful
and much more conservative in saying yes versus no. So, in terms of decision theory, most of us are actually
conservative decision makers when the costs are higher relative to the benefits. All right?
Now, basically what is happening here is that the sensory process will transmit a value to the decision process. It will
basically say, "Okay, I think I'm so much certain." So, let's say I'm certain to some units, 20 units, 40 units,
something like that. The decision system will take the sensory input into account and make a decision whether to say yes
or to say no. If this value is high, if the level of confidence is high, the decision process is more likely to yield
a yes response once the cost and benefits etc. have been considered. If the value is low, if the system is less
confident, the decision process is more likely to yield a no response again once again taking you know, the cost and
benefits into account. Now, what determines the quality of how the signal is coming? Now, signal
detection theory basically assumes that a noise or a disturbance can be confused with this with signal
and it is always present when a human being attempts to detect a signal. So, whenever you're trying to detect a
particular signal, there's always some noise that is that is there in the signal. And [snorts] this noise can be
due to several sources. It can be due to environmental changes, equipment changes, spontaneous neural activity
that's happening in the brain or sometimes just experimental manipulation. So, there is always noise
that is mixed with the signal. Imagine an experiment. Say for example, you're sitting in a sound
boo soundproof booths and you're wearing these headphones. On each of the several hundreds of trials, you must decide
whether you heard or did not hear a faint tone combined with white noise or you only heard the white noise. Now, you
can be going through several trials in your headphones and you have to basically make the decision whether you
heard something or you did not hear something. Again, remember the cost-benefit analysis will be done. If
you are going to be penalized for wrong detection, then you will tend to be more conservative. If you're going not going
to be penalized for wrong detection, you'll basically say, "Okay, I'll say yes more times than I'll say no." And
eventually, I will probably have made more correct responses than incorrect responses.
So, a trial in this case might begin with the presentation let's say of a flashing light to get you ready and
alert. Then you hear a burst of white noise which may or may not contain the signal. You say yes if you think that
the tone signal was present and you say no if you think that it was absent. Signal detection theory assumes that any
stimulus even noise noise will produce a distribution of evidence. The evidence on each trial is only one point and the
distributions are basically built from many trials. So, on a single trial there's some evidence but you are going
through several hundred trials. So, you have a distribution of evidence across signal and you have a distribution of
evidence for the noise as well. Since evidence cannot be directly observed, the distributions of stimulus trials and
noise at this point here are hypothetical. Now, the evidence for the trial for
which only noise occurred will tend to be small so that over many trials the
hypothetical distribution with a small mean will be established. When a signal plus noise is presented, the evidence
will be slightly larger and a greater mean will be formed over large number of trials.
So, basically what you will have is you'll have two distributions, one for only noise and one for signal
plus noise. Since the two distributions will sort of overlap in the middle, some values [snorts] of the evidence will
come in the ambiguous range. You can see here there is this is the signal plus noise distribution which has a slightly
higher mean and you have a signal and just the noise distribution which has slightly lower mean. And there is these
values between the two means which are sort of in the ambiguous range where you are not very sure whether the signal was
present or it was not. A criterion therefore needs to be fixed as to at what point you will say yes and
at what point you will say no. The position for this criterion is set by the decision process. So, for example,
if you want to be a liberal decision maker, you will basically set the criterion such towards the left side so
that most responses will be yes. And if you want to follow a more conservative decision policy, you will set the
criterion towards the right side so that most responses are no and only on few very selected responses when the
evidence is very high, you will basically say no. Okay, so you can you can look at this.
So, if there is this criterion, the yes responses are only towards the right side of the criterion. These are
the no responses. These are the yes responses and to the left side of the criterion, these are all your no
responses or where you are not very clear. So, the decision criterion beta will determine whether a yes or no
response will be made. Strong evidence to the right of the criterion will lead to yes responses and weak evidence to
the left of the criterion will lead to no responses. Correct detection of the signal basically, you know, the yes
responses in this horizontally striped area are called hits. The correct no responses when white noise occurs, this
is called you know, misses. Sorry, correct no responses when white
when noise occurs, the vertically striped portion is basically called misses. Misses occur when a no response
occurs to a weak stimulus weak signal to the left of the criterion, this dotted portion. False alarms are incorrect yes
responses and basically so, you have hits, misses and you know, and you have false alarms. Okay?
Now, either way, whatever is happening here, some errors of judgment will happen. Correctly detecting a signal
will be called a hit. Incorrectly responding yes when only noise is present is called false alarm. With a
liberal strategy, there will be higher number of uh hits and false alarms, but the conservative decision strategy,
there will be a slightly lower number of hits and false alarms. So, this is broadly how signal detection theory
basically works, and it tries to sort of get us uh you know, and signal detection theory
basically is used in the analysis of of a lot of experimental results. It is It is used both in psychophysics as well as
reaction time studies, which we are going to address in the next lecture onwards. Thank you.
Weber's Law states that the difference threshold—the smallest detectable change in a stimulus—increases proportionally with the magnitude of the original stimulus. Mathematically, this is expressed as ΔI/I = k, where ΔI is the difference threshold, I is the stimulus intensity, and k is a constant. For example, distinguishing a 10g change in a 300g weight is as perceptible as a 20g change in a 600g weight. This law helps quantify sensory sensitivity across different modalities.
The Method of Constant Stimuli presents fixed stimulus intensities in random order multiple times, allowing researchers to plot detection probabilities and define thresholds where stimuli are detected about 50% of the time. In contrast, the Staircase Method is adaptive; the stimulus intensity shifts depending on participant responses—decreasing after correct detection and increasing after misses—efficiently homing in on the threshold by averaging reversal points. While the former is thorough but time-consuming, the latter provides faster threshold estimation.
Variability in detection arises from internal noise in sensory processing and external environmental factors, making detection a gradual rather than abrupt event. Psychometric functions represent this by plotting the probability of detecting a stimulus against its intensity, typically forming a sigmoidal curve. Thresholds are thus statistical points (e.g., 50% detection), acknowledging inherent fluctuations rather than fixed sensory limits.
Signal Detection Theory (SDT) models how decisions to detect stimuli are made under uncertainty, considering both the signal plus noise and noise alone as overlapping evidence distributions. A decision criterion is applied to the sensory evidence to determine whether a stimulus is reported as present or absent. SDT accounts for hits, misses, false alarms, and correct rejections, illuminating how perceptual decisions balance sensitivity and response bias influenced by motivation, payoffs, and risks.
Decision bias in SDT reflects the placement of the decision criterion. A liberal bias (low criterion) leads to more hits but also more false alarms, while a conservative bias (high criterion) results in fewer false alarms but also fewer hits. Factors like expected rewards, penalties, and individual motivation shift the bias, influencing how strictly or leniently stimuli are reported, which is crucial for interpreting perceptual accuracy versus strategy in experiments.
Psychophysical methods and SDT provide foundational tools for quantifying sensory thresholds and modeling perceptual decisions under uncertainty. This understanding helps researchers design experiments that accurately measure sensory sensitivity, account for variability, and interpret detection performance beyond mere stimulus intensity. Incorporating these principles enhances experimental rigor and the development of models that reflect real-world perception.
Heads up!
This summary and transcript were automatically generated using AI with the Free YouTube Transcript Summary Tool by LunaNotes.
Generate a summary for freeRelated Summaries
Understanding Psychophysics: Methods and Thresholds in Cognitive Psychology
This lecture by Dr. Arma introduces psychophysics, focusing on how psychological reactions correspond to physical stimuli in cognitive psychology. Key concepts include absolute and difference thresholds, sensory modality variations, and methods like adjustment and limits to measure perception accurately.
Comprehensive Guide to Sensation and Perception in Psychology
Explore the fundamentals of sensation and perception, including sensory processes, visual and auditory systems, and psychological interpretations. This summary highlights key concepts such as sensory receptors, thresholds, Gestalt principles, and the interplay between bottom-up and top-down processing.
Effective Stimulus Selection and Control in Cognitive Psychology Experiments
This lecture by Dr. Arkwarma highlights the crucial role of carefully selecting and controlling stimuli in cognitive psychology experiments. It emphasizes that stimuli must vary only on critical dimensions to accurately test hypotheses, with detailed examples from lexical decision and face recognition studies.

Foundations of Experimental Design in Cognitive Psychology: Scientific Method and Challenges
This comprehensive overview explores the evolution of experimental design in cognitive psychology, emphasizing psychologists' pursuit of scientific legitimacy through the adoption of rigorous methods. It discusses key characteristics of the scientific method, common misconceptions about psychology, and critiques questioning its scientific status, balancing foundational insights with current debates.
Fundamentals of Scientific Method and Experimental Design in Cognitive Psychology
Discover the evolution of scientific knowledge generation from logical positivism, Popper's falsification, to Kuhn's paradigm shifts. This summary explores how theories are tested, modified, and drive progress in cognitive psychology research.
Most Viewed Summaries

A Comprehensive Guide to Using Stable Diffusion Forge UI
Explore the Stable Diffusion Forge UI, customizable settings, models, and more to enhance your image generation experience.

Kolonyalismo at Imperyalismo: Ang Kasaysayan ng Pagsakop sa Pilipinas
Tuklasin ang kasaysayan ng kolonyalismo at imperyalismo sa Pilipinas sa pamamagitan ni Ferdinand Magellan.

Mastering Inpainting with Stable Diffusion: Fix Mistakes and Enhance Your Images
Learn to fix mistakes and enhance images with Stable Diffusion's inpainting features effectively.

Pamamaraan at Patakarang Kolonyal ng mga Espanyol sa Pilipinas
Tuklasin ang mga pamamaraan at patakaran ng mga Espanyol sa Pilipinas, at ang epekto nito sa mga Pilipino.

How to Install and Configure Forge: A New Stable Diffusion Web UI
Learn to install and configure the new Forge web UI for Stable Diffusion, with tips on models and settings.

If you found this summary useful, consider buying us a coffee. It would help us a lot!