Introduction to the Daily Candle Closure Framework
This video outlines a straightforward daily trading framework based on candle closures and wick sizes, designed to help traders anticipate market reversals or continuations effectively. Core to this approach is using previous day highs, lows, and equilibrium (EQ) levels as key reference points.
Key Concepts Explained
Reversals
- Frame reversals off previous day’s high or low.
- Look for the price to open, trade into the previous day’s high/low, and form a reversal candle with a small wick, indicating expansion potential.
- Confirmation comes from a change in the state of delivery on lower timeframes (hourly or 30-min for most sessions, 5-15 minutes for high volatility).
Continuations
- Price opens and first trades lower (for bullish continuation) or higher (for bearish continuation), respecting the equilibrium (EQ) of the prior day’s range.
- Following this, price should break through the previous day’s high (for bullish) or low (for bearish).
- Wick size influences the potential for expansion beyond previous highs/lows; smaller wicks suggest stronger moves.
Practical Examples Using TradingView
Bullish Continuation on YM Daily Chart
- The market is trending higher with new protected swings.
- Price opens, trades lower into the EQ/fair value gap without closing below it on hourly charts.
- Then price moves up and breaks through the previous day’s high, confirming continuation.
Bearish Continuation on USDCAD
- Candle 2 closure signals bearish close.
- Price respects EQ and previous day low, trading lower through these key levels after validating with swing protection and state of delivery changes.
Reversal Example
- Price opens and trades into the previous day low.
- A small wick forms with an SMT (Smart Money Tool) signal and change in state of delivery, validating a reversal back toward the EQ or fair value gap.
Importance of Higher Timeframe Bias
- Use daily or 4-hour charts to establish bias.
- Trade retracements and reversals in line with this bias.
- Example: GBPUSD shows a bullish bias with candle 3 closure and protected swings.
- Lower timeframe entries (hourly, 5-minute) are used to time reversals within the context of the higher timeframe bias.
Fractal Nature of This Framework
- The same principles apply on lower timeframes, e.g., hourly reversals framed by previous candle highs/lows.
- Candle 2 and candle 3 closures signal potential entries.
- Avoid trading below the 4-hour timeframe for cleaner setups.
- This aligns with key concepts covered in Beginner's Guide to Price Action Trading: Trends & Consolidation Explained.
Step-by-Step Approach for Trading This Framework
- Identify bias and key levels: previous day high/low and equilibrium.
- Observe price action at market open; note if price trades into these levels.
- Watch wick size to assess expansion potential.
- Confirm with change in state of delivery on lower timeframe charts.
- Enter trades on candle 2 or candle 3 closures aligned with setup.
- Manage risk with stops above/below key wicks or swing highs/lows.
Final Tips
- Larger wicks warrant waiting for the next candle for better confirmation.
- Combine with indicators like SMT and fair value gaps for enhanced accuracy.
- Be cautious during consolidation periods; wait for clear price structure and swing confirmations.
Conclusion
This daily candle closure strategy leveraging wick size and previous day levels offers a structured way to trade reversals and continuations effectively. By integrating multi-timeframe analysis and state of delivery changes, traders can improve entry timing and manage risk efficiently.
For questions or further clarifications, viewers are encouraged to comment below. Happy trading!
How's it going everyone? In this video, we are going to talk about a simple daily framework. This is going to use
candle closures as well as wick size. But if you haven't already seen my equilibrium video, my candle 2 and
candle 3 closure video, I would watch those first. This is based off the fact that I'm either going to be looking for
a reversal or for a continuation. If I'm looking for a reversal, I'm always going to frame that reversal off of previous
day's high or previous day's low. So, here you can see we have had a bullish day. We close near the high. I'd be
looking for the next day to open, trade into previous day high, have a reversal formed, and then I can look to trade it
back into the range, looking for that EQ or to the previous day's low. Now, if I'm going to be looking for a
continuation, I'll look for price to open, trade lower first, respect the EQ of that previous day's range, and then
trade up and through that previous day's high. Let's take a look at what an example of a reversal would look like.
Here you can see we want to see price open, trade higher first into the previous day's high, which is our
important level, and then have a shallow wick to form a reversal and trade lower. Now, if you don't know why we want a
shallow wick, a shallow wick supports expansion lower. So, we can trade this lower in the reversal day. If we have a
large wick, then we're going to want to wait for candle three or the following candle to trade the continuation. If you
haven't already seen my video on wick size, please check that out. But essentially, over this previous day
high, we're going to want to see a lower time frame change in the state of delivery to confirm the wick of this
daily candle and then trade it back lower. I'm generally going to be looking for this on the hourly or 30-inut
charts. If it's in Asia or London or in New York, I will use the 5 minute or 15 minute time frame. Now, when looking for
a continuation, I want to see price open up, respect the EQ of the previous day's range, and then trade higher. So, we
have an open low and then forming the body before we have a high and close. And similar to a reversal, I will be
using a change in the state of delivery intraday to confirm the wick of that higher time frame candle. So, as we zoom
in here, you can see we have a change in the state of delivery, which confirms this higher time frame wick. And then we
can trade the body of the higher time frame candle. So, let's get into trading view and go over a few examples of this.
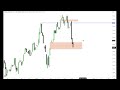
So, here we are in our first example. We are on YM on the daily chart. Now, let's first give a little context here. You
can see we are trending higher and we are creating new protected swings. So, you can see we reach into a fair value
gap. We close over the down close candle into that fair value gap. Now, this low is protected. If we are going to trade
higher, we then reach into this fair value gap here. And what does this previous candle do? It closes over the
down closed candles into that fair value gap. Now this low is protected. So this is an ideal candle to closure. Now
looking at this, if we are expecting a continuation, what do we need to mark out? Well, with all of these days, we're
just going to mark out the EQ as well as our previous day high and previous day low. In this case, since we are bullish,
previous day high. Now, if we are bullish, we're looking for a continuation. We want to see price open,
trade lower first, respect the EQ, and then trade higher through previous day high. Now, my favorite time frame to
watch this on is the hourly. So, let's drop down to the hourly chart. So, here you can see we have marked out our
previous day's EQ as well as our previous day's high. So, what do we want to see out of this day? Well, we'd want
to see price open, trade lower into this fair value gap, respecting the EQ. And when I say respecting the EQ, it's not
ideal to have closures on the hourly chart below that. So if I'm using the daily, the time frame pairing with that,
I don't want to see a closure below that EQ level. Not that it can't reverse and expand, it's just less probable. So as
we let this play out, let's see how it works out. So you can see we respect that EQ and then we start to trade
higher. So where would we want to see this trade to? Well, because it has a larger wick back to the daily open, but
our previous day's high or beyond that. And there you can see we have our open low and then we have our high, right?
And we trade into these previous highs on the left here. So, this is a good example of a continuation. And what you
want to see, you want to see price open, make a low or this lower wick, and then trade higher through its previous day's
high. Now, how far beyond this previous day's high we go is really dependent on the wick size of this reversal. With a
large wick, I'm not expecting much of a range beyond this level. But with a small wick, we can get an expansion.
Let's take a look at another continuation. So, here we are on USD CAD. And what do we have? We have a
candle to closure, a nice bearish close. So, if we're looking for a continuation, what do we want to mark out? We want to
mark out the EQ as well as the previous day's low. Now when I say respect EQ, price can form its high below that
level. It doesn't need to go up and touch it. So what I will look for is points of interest below that EQ. So
marking that out, we have a fair value gap here and a fair value gap here. Instead of trying to guess which one
will have a reaction, I'm going to wait for a swing to form in that area or a new protected swing. So let's see what
happens. You can see we don't respect this fair value gap. So I can simply remove it. Now right here, let's see. Do
we have a candle 2 closure? No. Do we have a candle 2 closure? No. But we have a candle three closure, which is
ideal as we form a new protected swing here. So now I can anticipate that this higher time frame wick has formed,
right? Because this is what I look for at the reversal. Either on the lower time frame, the hourly or the lower time
frame using a candle closure. I can look for price to trade into this previous day low or even lower. And you can see
there we get a move through that previous day low as a first target and that expansion lower. If we want to take
a look at this with my indicator marking it out, you can see we also have that SMT with dollar at the reversal, that
change in the state of delivery. And then we have the T-spot marked up, which in this case is just the equilibrium in
which case we will search for that point of interest and look for it to trade lower. Now let's take a look at a
reversal. Here you can see we have the EQ marked up and our previous day low is right here. So if we're going to be
looking for a continuation, what would we want to see? Price open, trade higher first, respecting this fair value gap
and the EQ to then trade lower into previous day low and beyond. But what occurs?
We open and we trade lower first. That is open low, which is bullish. When price opens and makes a low first, that
is bullish. When price opens and makes a high first that is bearish. So what are we looking for with a reversal? Well, we
want to see price open reach into that previous day's low which is that important level. Then we need what?
Either a change in the state of delivery on the hourly time frame if earlier in the day or if into New York a change in
the state of delivery on the 15minut or 5minut time frame. But let's see what happens
here. So you can see we have an SMT at the previous day low with a change in the state of delivery. But now we have
everything set up with a small wick to see a reversal trade back into the range. Where could we look for this to
trade to? Back towards the EQ or this fair value gap here. So let's see how this plays out.
And there you can see we go well beyond the EQ. And we have a nice move off of that previous day's low which forms a
reversal. Now let's look at this once again. If I'm looking for a continuation, what am I looking for?
Price to open, respect the EQ of the previous day, and then look for above previous day high. Let's see. Do we open
and trade lower first? Yes, we have went into this fair value gap here and closed over. So, let's see if we get a move
into previous day high. We do get a move into previous day high and then we have it forming somewhat of a reversal or a
retracement here. Let's see what happens. And you can see a little bit of a messy
price action here, but we do trade higher. The one thing I do want to talk about, yes, this is a protected swing,
right? But this swing is only protected until it hits liquidity. Once it hits liquidity, this is a pattern I see often
of taking out liquidity, then it will sweep out a protected swing, and then it will have its true move. So, this is
just an example of a reversal, right? So just to review, sweeping out our previous day's low as a lower time frame
change in this state of delivery and then can look back towards that EQ on a bullish day or on this bullish
continuation. I want to see price open, make a low and then trade higher into previous day low or beyond. Now in this
next example, we are on GBPUSD. And I want to clarify the importance of having a higher time frame bias. I'm not
just going to pattern trade this. I want to actually align it with a bias. So here you can see we have an ideal candle
three closure and a new protected swing which is bullish. So ideally I want to frame to the upside here. Let's drop
down to the hourly time frame. So here we are on the hourly time frame and we have our previous day high right here.
And what do we want to see? Well, ideally we want to see price open, trade lower, respect the EQ and then trade
higher. So let's see what happens. You can see price trades into this previous day high first and has a change
in the state of delivery. Now, is this bearish? Yes, this is bearish, but this can be still part of a retracement, not
a full-on reversal. Since I am still bullish, I still want to anticipate this to be a retracement to then trade it
higher. But I'm going to need to wait for what? That lower wick to form and use a change in the state of delivery.
So, let's see what happens. We do get this move lower which is possible to trade. Right? This would be trading the
reversal back in towards the EQ of the range or back into the points of interest around the EQ.
And then what do we want to see right here? You can see we have a little consolidation. We sweep out, respect
this fair value up, sweep out one more time. And then what do we have? We have a change in the state of delivery with
an ideal candle 2 closure. This is where I could take an entry on the open of candle 3 to trade it higher or I could
do what? This is an hourly candle 2 closure. I could look to the 5m minute to trade a 5-minut continuation in
candle 3. But you can see how if you do have a bias, you do want to come in and keep that bias and let the time frames
align with that bias. You can see yes we do get a retracement here off the reversal on previous day high but that
is just a retracement to continue higher within this daily range. Now this is a fractal concept. So we just went over
this on the daily and hourly time frames but you can see here we've had this expansion throughout the day and then
right at 11 what are we having? We're having a reversal form. So if I wanted to trade a reversal on a lower time
frame how would I do that? Well, it's the same, but instead of previous day high, it's going to be a previous
candle's high. So, here you could see if I'm on the hourly chart, I'll be using the 10 a.m. high to frame a reversal.
Now, I want to have a small wick and then I can trade it lower. So, let's drop down to the lower time frames and
check this out. So, here we are on the 5minut time frame, and we have marked out our previous candle's high. Now,
ideally, we want this candle's high to form early into the candle and have a small wick. But what confirms that? Are
we just going to use a closure like this? No, we want to wait for what? The change in the state of delivery. So
let's see what happens here. You can see we get this closure below which forms a change in the state of
delivery which then protects this high and we can see a move lower. So let's see what happens.
You can see it is quite messy as we are counter trend but we do have the SMT at this high as euro and dollar took out
this high while GBP did not. And then we go run out these targets lows. The main thing I wanted to point out is this is a
fractal concept. So generally, although I normally use this on the daily time frame with the hourly and trading that
intraday, you can use it on the lower time frames such as the hourly and the 5minut. However, I don't prefer to go
below the 4hour time frame as it just becomes a bit more difficult. If I'm going to be trading these reversals or
these candle twos, you can check out my previous video on trading candle 2. then I'm going to generally focus on trading
a reversal candle on the daily or 4hour time frame. Once you get a bit lower than the 4hour time frame, it just gets
a bit messy and more difficult. Let's do one final example here and we will show the fractal nature as we are going to do
this on the 4hour time frame. And then with the 4hour, what do we pair it with? The 15-minut time frame. So here you can
see we've had three bearish candles. We do have a sweep here and then a closure forming a change in the state of
delivery. Following these two expansion candles, we have yet to hit this range low. So, we still have an open target.
Here we have a consolidation. So, if we want to trade away from a consolidation, what do we want to see? We want to see
the previous high ran out to then trade it lower. We could anticipate price to sweep out this high and then trade it
lower. If it has a small wick, then we can look to trade the reversal candle. If it has a large wick, then we're not
going to want to trade the reversal candle. We'll wait for the following candle. Let's get on to the 15-minute
time frame to check this out. So, here you can see the consolidation a little bit better. And how can you see this?
Well, we cannot form a continuation here. We can't get the closure to form a protected swing. So, then we make a new
high. And here you can see we also can't go form a new continuation. So, this is just continuing consolidation. So, I
want to see another high ran out. So, putting on the indicator, let's see what happens.
So here you can see we run into this high. Now am I going to trust this yet? No. I need to wait for a closure through
or a change in the state of delivery which then confirms that this wick has been created.
You can see we struggle to close but then right away we close after. So if I'm going to be trading a reversal then
I could look to trade this position here. Put my stop on this high and then look for that range low that we were
talking about. Let's see how this works out. And there you can see this does work out
as we have a nice reversal off the previous candle's high paired with a change in the state of delivery and SMT.
If I'm going to be trading a candle too, I do prefer to have SMT paired with it. Now, let's talk about one more thing
here. If we are looking for a continuation lower here, what do we want to see? We want to see price open, trade
higher first, and then into this low. If we are going to form a reversal off of this previous 4hour low, how is that
going to work out? Well, we're going to open trade lower first into this low and then we'll form a change in the state of
delivery and continue back into the range. So, let's see what happens here. You can see we are getting a
continuation and this has a large wick. So, this is not a candle that I would be interested in trading back into the
range because if it was going to form a reversal, I would rather trade the following candle. So, here we are in our
last example and let's take a look at our previous day. So, we're on the hourly chart. This is the daily chart.
You can see in the previous day, we have wretch up into our previous day's high. We have a nice V-shaped reversal with a
change in the state of delivery alongside an SMT. And then we displace lower throughout the day with a nice
bearish closure. So with a bearish candle 2 closure, we'd be looking for a continuation in candle 3 out of where a
T-spot or the EQ. I want to see price open, trade higher first to then trade lower. Now, if I'm looking for a point
of interest in this T-spot, what am I looking for? A fair value gap or a high to be taken out. Here we have a fair
value gap. So let's see. Do we get a reaction out of this area? Nope. We kind of consolidate, but we do
take out this high here and then we have a change in the state of delivery. Now, since this is during Asia session or
early onto the day, this is when I prefer not to go down to the lower time frames and I like to execute on the
higher time frames. So, here's where I could take an entry short and I could put my stop at the high here and then
look for 2 R or in this case it's 1.83. If I want to adjust it to 2 R, could use the body there as I don't want to see it
traded back up into that. And let's see what happens. And there you can see we hit our 2R. So this is just a good
example of when seeking a continuation. I want to see price open, reach into a point of interest, have a formation that
confirms the wick of this higher time frame candle, and I can look to trade that continuation. In a reversal, I want
to see price open, trade higher into that previous day's high or that previous candle's high, have a change in
the state of delivery, which confirms that wick high, and I can look to trade the reversal if it has a small enough
wick. Now, I hope you enjoyed this video. If you have any questions, leave them in the comment section below. And
with that, I hope you have a great rest of your day, and I'll see you guys next time.
The Daily Candle Closure Trading Framework uses the previous day's highs, lows, and equilibrium levels as key reference points to anticipate market reversals and continuations. By analyzing candle closures and wick sizes around these levels, traders can detect potential expansion or reversal signals, helping to time entries more effectively.
Wick size reflects price rejection and momentum. Small wicks near key levels like previous highs or lows suggest strong market expansion potential, signaling a continuation. Conversely, large wicks often indicate uncertainty, advising traders to wait for subsequent candle confirmations before entering trades to avoid false signals.
Multi-timeframe analysis establishes higher timeframe bias (daily or 4-hour charts) to guide trade direction and validate setups. Lower timeframes (hourly to 5-minute) are used to confirm changes in state of delivery and refine entry timing, ensuring entries align with the broader market trend and reducing the likelihood of false signals.
State of delivery refers to the momentum or order flow characteristics visible on lower timeframe charts. A confirmed change in this state—such as a shift from buying to selling pressure—validates reversal or continuation signals suggested by daily candle patterns. Traders monitor hourly or 5-15 minute charts depending on volatility for this confirmation before entering trades.
First, identify the higher timeframe bias and key daily levels (previous high/low, equilibrium). Next, observe how price behaves at market open against these levels, focusing on wick size. Confirm signals with state of delivery changes on lower timeframe charts. Enter trades on candle 2 or 3 closures aligned with the setup, and manage risk by placing stops beyond swing highs/lows or key wick points.
Yes, the framework's fractal nature allows application on lower timeframes by framing reversals off previous candle highs or lows and using candle 2 and 3 closures for entry signals. However, it's recommended to avoid trading setups below the 4-hour timeframe for cleaner signals and reduced noise, ensuring higher probability trades.
Combining this framework with indicators like Smart Money Tools (SMT) and fair value gaps can improve trade accuracy by providing confirmation of market structure and order flow. Additionally, waiting out consolidation periods until clear price structure and swing confirmations emerge helps reduce false signals and enhances trade quality.
Heads up!
This summary and transcript were automatically generated using AI with the Free YouTube Transcript Summary Tool by LunaNotes.
Generate a summary for freeRelated Summaries

Ultimate Beginner's Day Trading Guide 2025: Mindset to Strategy
Discover the comprehensive day trading tutorial for 2025 designed for beginners. Learn essential concepts such as mindset, risk management, market structure, and strategic tools like liquidity, order blocks, and fair value gaps. Built on years of experience, this guide offers a step-by-step approach to developing profitable trading skills with an emphasis on consistency and discipline.
Beginner's Guide to Price Action Trading: Trends & Consolidation Explained
This free beginner-friendly video course introduces the fundamentals of price action trading, focusing on understanding uptrends, downtrends, and consolidation. Learn how to identify market trends, avoid common pitfalls, and set up essential trading tools for success.

Mastering Equilibrium vs Premium Markets: Advanced Fibonacci Trading Strategies
This tutorial delves into the dynamics of premium markets versus equilibrium, focusing on impulse price swings and Fibonacci retracement levels. Learn how to identify optimal trade entries, manage stops, and take profits using practical examples on daily and hourly charts for consistent, professional trading outcomes.
Mastering Market Maker Models: Forex, Indices & Stock Trading Insights
Discover expert analysis on the dollar index, forex pairs, gold, crude oil, and major indices, emphasizing anticipation over reaction in trading. Learn practical market maker buy and sell models, smart money reversals, and actionable strategies for consistent trading success.
Navigating a Volatile Trading Day: Insights and Strategies
This comprehensive summary captures the challenges and key moments from an intense trading day, highlighting strategies for managing volatility and mindset. Gain valuable insights into trading approaches, risk management, and adapting to unpredictable market conditions.
Most Viewed Summaries

A Comprehensive Guide to Using Stable Diffusion Forge UI
Explore the Stable Diffusion Forge UI, customizable settings, models, and more to enhance your image generation experience.

Kolonyalismo at Imperyalismo: Ang Kasaysayan ng Pagsakop sa Pilipinas
Tuklasin ang kasaysayan ng kolonyalismo at imperyalismo sa Pilipinas sa pamamagitan ni Ferdinand Magellan.

Mastering Inpainting with Stable Diffusion: Fix Mistakes and Enhance Your Images
Learn to fix mistakes and enhance images with Stable Diffusion's inpainting features effectively.

Pamamaraan at Patakarang Kolonyal ng mga Espanyol sa Pilipinas
Tuklasin ang mga pamamaraan at patakaran ng mga Espanyol sa Pilipinas, at ang epekto nito sa mga Pilipino.

How to Install and Configure Forge: A New Stable Diffusion Web UI
Learn to install and configure the new Forge web UI for Stable Diffusion, with tips on models and settings.

If you found this summary useful, consider buying us a coffee. It would help us a lot!