Overview of the Lesson
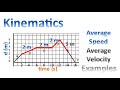
In this video, we focus on converting a velocity time graph into an acceleration time graph. The goal is to understand how to analyze the graph and calculate the acceleration based on the slope of each section.
Key Points
-
Understanding the Graph:
- The velocity time graph is divided into three sections:
- Section A (0 to 4 seconds): Constant velocity at 4 m/s north.
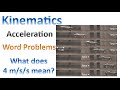
- Section B (4 to 7 seconds): Constant acceleration, where the car is slowing down.
- Section C (7 to 10 seconds): The car is at rest.
- The velocity time graph is divided into three sections:
-
Calculating Acceleration:
- Acceleration is determined by calculating the slope of each section:
- Section A: Slope = 0 (no change in velocity) → Acceleration = 0 m/s2.
- Section B: Slope = rise/run = -4 m/s / 3 s = -1.33 m/s2 (deceleration).
- Section C: Slope = 0 (no change in velocity) → Acceleration = 0 m/s2.
- Acceleration is determined by calculating the slope of each section:
-
Plotting the Acceleration Graph:
- The acceleration values are plotted on the acceleration time graph:
- Section A: Line at 0 m/s2 from 0 to 4 seconds.
- Section B: Line at -1.33 m/s2 from 4 to 7 seconds.
- Section C: Line at 0 m/s2 from 7 to 10 seconds.
- The acceleration values are plotted on the acceleration time graph:
-
Realism of Transitions:
- Instantaneous changes in acceleration at transition points (4 seconds and 7 seconds) are unrealistic in real life; smooth transitions should be considered. For a deeper understanding of motion, refer to our summary on Understanding Motion: A Comprehensive Guide.
-
Practice Task:
- Viewers are encouraged to practice by calculating the slope for a new velocity graph with five sections and creating an acceleration time graph based on their calculations. For more on kinematics, check out Understanding Kinematics: Constant Velocity and Acceleration.
Conclusion
Understanding how to convert between these graphs is crucial for mastering concepts in physics. Practice is essential for developing these skills. To further enhance your understanding, consider reviewing Understanding Acceleration: A Comprehensive Guide and Understanding Kinematics: Position, Displacement, Distance, Velocity, and Speed.
good morning today our goal is to learn about converting a velocity time
graph to an acceleration time graph and so here's a velocity time graph and the previous video i showed you how
to convert this velocity time graph into a position time graph however today we're going to take this
velocity time graph and ultimately convert it into this what we're looking at
is an acceleration time graph so that's our goal today to learn how to take that velocity time graph
and create a graph that looks like this and so for starters we're going to describe this graph
so for the first section from 0 to 4 seconds it's constant velocity the velocity is
not changing 4 meters per second north for section b because a line is drawn this represents
constant acceleration and in fact the car in this case
is slowing down moving north and finally for section c from 7 to 10 seconds the car is taught
so how do we go from a velocity time graph to an acceleration time graph what do we have to do to get there
for starters we need to calculate the acceleration to do that we need to calculate the
slope of each section of the graph we need to calculate the slope
for each line slope is rise over run and looking at the first section there
is no rise the rise is zero the run is four seconds and so
for section a from zero to four seconds the acceleration is exactly zero how do we plot this
on a graph well this is how we plot an acceleration of zero
it's just the line across the x-axis notice that the line ended at four seconds why was that
well it ends at four seconds because section a ends at four seconds in other words the
acceleration changes at the four second point that's why we stop drawing the line at
four seconds all right now that we've plotted the acceleration for the first part of the
graph from 0 to 4 seconds what about the next section of the graph section b
once again to calculate acceleration we need to find slope slope is rise over run
so we've drawn there the rise and the run the rise is negative four meters per
second the velocity is decreasing it's not increasing so that's why it's negative
the run is three seconds how do we know it's three seconds well this line starts at four
and ends at seven seconds the time that's elapsed is three seconds and so we do our math we substitute our
numbers into the equation rise over run negative four over three
and we end up with this answer negative four thirds or negative one point three three meters per second
per second so how do we plot that in an acceleration time graph well we draw a line that line is drawn at
negative 1.333 meters per second per second or negative four thirds
meters per second per second that line starts at four seconds and ends at seven seconds because
section b started at four seconds and ended at seven seconds
what about section c the rise is zero the run is three seconds and we end up with an
acceleration of zero and that's how we plot the last part of the graph it starts at 7
seconds and ends at 10 seconds and so the question is this if we look at the graph and specifically we look at
the four second point the car seems to instantaneously accelerate from a value
of zero to a value of negative four over three meters per second per second
is this even possible is the transition at four seconds realistic similarly at seven seconds
is the transition realistic the answer is no in real life you would never get that instantaneous
change in acceleration it's impossible for a car and so the reality is there would be a
smooth transition and i've shown you that smooth transition at the four second point and at the
seven second point however for simplicity we're going to ignore that there's a smooth transition
all right so here's the task i'd like you to complete here's the velocity of a car for 15
seconds this time we have five different sections of acceleration
i'd like you to calculate the slope for each section and then try to create an acceleration
time graph ultimately if you really want to understand physics
you have to practice these skills here is the answer you should get
once you complete all your work so give it a try i hope you've enjoyed today's lesson
have a great day bye
The video focuses on how to convert a velocity time graph into an acceleration time graph by analyzing the graph and calculating the acceleration based on the slope of each section.
Acceleration is calculated by determining the slope of each section of the velocity time graph. For example, in Section A, the slope is 0, resulting in an acceleration of 0 m/s². In Section B, the slope is -1.33 m/s², indicating deceleration, and in Section C, the slope is again 0, leading to an acceleration of 0 m/s².
The velocity time graph is divided into three sections: Section A (0 to 4 seconds) with constant velocity at 4 m/s north, Section B (4 to 7 seconds) with constant acceleration where the car is slowing down, and Section C (7 to 10 seconds) where the car is at rest.
Viewers should note that instantaneous changes in acceleration at transition points (4 seconds and 7 seconds) are unrealistic in real life. Smooth transitions should be considered for a more accurate representation of motion.
Viewers are encouraged to practice by calculating the slope for a new velocity graph with five sections and then creating an acceleration time graph based on their calculations.
Viewers can enhance their understanding by reviewing related summaries such as 'Understanding Motion: A Comprehensive Guide', 'Understanding Kinematics: Constant Velocity and Acceleration', and 'Understanding Acceleration: A Comprehensive Guide'.
Understanding how to convert between these graphs is crucial for mastering concepts in physics, as it helps in analyzing motion and developing a deeper comprehension of kinematics.
Heads up!
This summary and transcript were automatically generated using AI with the Free YouTube Transcript Summary Tool by LunaNotes.
Generate a summary for freeRelated Summaries
Understanding Position-Time Graphs: A Comprehensive Guide
This video lesson explores the fundamentals of position-time graphs, focusing on how to interpret motion in a straight line. Key concepts include the relationship between slope and velocity, as well as practical examples and simulations to illustrate constant velocity and changes in position.
Understanding Acceleration: A Comprehensive Guide
This video discusses the concept of acceleration, explaining its definition, formula, and practical examples. It covers how acceleration is a vector quantity, the significance of positive and negative acceleration, and provides real-world scenarios to illustrate these concepts.

Understanding Kinematics: Constant Velocity and Acceleration
In this video, we explore the principles of kinematics, focusing on the kinematic equations for constant acceleration. Through practical examples, we demonstrate how to calculate final velocity and acceleration using displacement, time, and initial velocity.

Understanding Linear Motion: Position, Velocity, and Acceleration Explained
This video introduces the fundamentals of linear motion in kinematics, covering key concepts such as position, displacement, velocity, and acceleration. Learn how to calculate and graph these quantities using real-world examples like a car on a straight road.

Understanding Motion: A Comprehensive Guide
Dive deep into the concepts of motion, speed, and velocity, along with practical examples and clear explanations!
Most Viewed Summaries

A Comprehensive Guide to Using Stable Diffusion Forge UI
Explore the Stable Diffusion Forge UI, customizable settings, models, and more to enhance your image generation experience.

Kolonyalismo at Imperyalismo: Ang Kasaysayan ng Pagsakop sa Pilipinas
Tuklasin ang kasaysayan ng kolonyalismo at imperyalismo sa Pilipinas sa pamamagitan ni Ferdinand Magellan.

Mastering Inpainting with Stable Diffusion: Fix Mistakes and Enhance Your Images
Learn to fix mistakes and enhance images with Stable Diffusion's inpainting features effectively.

Pamamaraan at Patakarang Kolonyal ng mga Espanyol sa Pilipinas
Tuklasin ang mga pamamaraan at patakaran ng mga Espanyol sa Pilipinas, at ang epekto nito sa mga Pilipino.

How to Install and Configure Forge: A New Stable Diffusion Web UI
Learn to install and configure the new Forge web UI for Stable Diffusion, with tips on models and settings.

If you found this summary useful, consider buying us a coffee. It would help us a lot!