Understanding Linear Motion: Position, Velocity, and Acceleration Explained
Introduction to Kinematics and Linear Motion
Kinematics is the branch of physics that studies the motion of objects without considering the forces causing the motion. This video focuses on one-dimensional or linear motion, covering the essential concepts of position, displacement, velocity, and acceleration.
Position and Displacement
- Position describes where an object is at a specific point in time, measured relative to a chosen reference point (zero point).
- In physics, position is quantified using numerical values (e.g., meters) rather than vague terms like "up" or "left."
- Displacement is the change in position, calculated as the final position minus the initial position.
- Example: A car moving from 5 meters to 15 meters along a road has a displacement of 10 meters.
Graphing Position Over Time
- Position data can be recorded at different times and plotted on a graph with time on the horizontal axis and position on the vertical axis.
- This visualization helps understand how an object's position changes over time.
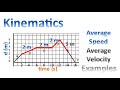
Velocity: Average and Instantaneous
- Velocity is the displacement divided by the time taken, representing how fast and in what direction an object moves.
- The SI unit for velocity is meters per second (m/s).
- Average velocity is calculated as (final position - initial position) / (final time - initial time).
- Instantaneous velocity is the velocity at a specific moment, measurable with tools like a speedometer.
- Example problems demonstrate calculating average velocity for a car traveling 800 meters in 35 seconds and between specific time intervals.
Graphing Velocity Over Time
- Average velocities between time intervals can be graphed to visualize motion.
- Instantaneous velocity graphs show velocity at exact time points, providing a more detailed motion profile.
Acceleration: Change in Velocity Over Time
- Acceleration is the rate of change of velocity over time, with SI units meters per second squared (m/s2).
- Example: A car accelerating from rest to 27 m/s in 4.5 seconds has an acceleration of 6 m/s2.
- Acceleration due to gravity is a constant 9.8 m/s2 downward.
Graphing Acceleration Over Time
- Acceleration can be graphed similarly to velocity, showing how velocity changes over time.
- In this course, acceleration is assumed constant for simplicity.
Summary
- Position and displacement describe where an object is and how far it moves.
- Velocity measures how fast and in what direction the object moves.
- Acceleration quantifies how velocity changes over time.
- Graphs of position, velocity, and acceleration provide visual insights into motion.
This foundational understanding of linear motion sets the stage for exploring more complex motion in two dimensions and dynamics in future lessons.
For a deeper understanding of these concepts, check out our resources on Understanding Kinematics: Position, Displacement, Distance, Velocity, and Speed and Understanding Acceleration: A Comprehensive Guide. Additionally, you may find our guide on Understanding Position-Time Graphs: A Comprehensive Guide helpful for visualizing these concepts.
hey everyone welcome to the first video on linear motion these videos will introduce us to
kinematics by starting with Motion in a straight line or one-dimensional motion then in later videos we'll cover emotion
in two dimensions so in this video we'll talk about position and displacement
velocity and acceleration these are the key elements that we'll need for learning
kinematics so before we begin what is kinematics well it's a part of physics that studies
the motion of objects without considering the forces that cause the motion
so basically kinematics focuses on how objects move or the way they move and the path that they take over time
we'll learn how to describe an object's motion using things like position velocity and acceleration and in
kinematics we can answer questions like where will an object be at a certain point in time what direction is it going
and how fast is it moving on the other hand Dynamics focuses on why objects move or what causes them to
move this includes things like forces energy mass and momentum when learning physics we usually start
with kinematics and learn how to describe the motion of objects first then in later sections we'll learn
Dynamics and what causes that motion so let's get into kinematics first we'll start with position and
displacement so position is pretty simple we're going to describe position as
where an object is at a single point in time for example we might say the position of
this calculator is on the desk but the calculator could be any place on this desk if we want to be more specific
we could say something like the calculator is on the left side of the desk
this is sort of how we're used to describing position in everyday life as another example here's a flag
attached to a flagpole how would we describe the position of the flag well here we might say the flag is up
or here we might say the flag is down again this is how we would normally describe position
but in physics we need to be extremely specific about where things are the laws of physics deal with exact
positions and exact times we can't plug things like up or down or the left side of the desk into our physics equations
so how do we be more specific well we use numbers if we were to hold up a tape measure so
the end is at the bottom of the flagpole we can measure exactly where the flag is by using numbers
and since all objects have some length or width we'll need to pick a point on the object to measure
most of the time we'll pick the middle so let's measure from the middle of this flag
now instead of saying up or down we can more precisely say the flag is four feet from the bottom
or the flag is two feet from the bottom now we're describing the exact position of the flag on this flagpole
also notice how we're measuring the position of the flag relative to the bottom of the flagpole where the
position would be zero we always have to measure position relative to some point
and we don't have to pick the bottom what if we measure the position of the flag from the top
now the top of the flagpole has a position of zero and if the flag was in the same position
as it is on the left now we would say the flag is four feet from the top
in both ways of measuring are fine all we need to do is pick our zero point that we're measuring from
now since the flag can only move up or down this flagpole in a straight line we're measuring position along one
dimension we can describe the position of this flag by using only a single number like four feet
one dimensional motion or linear emotion is what we'll be warning first so as we start to talk about the
position velocity and acceleration of objects I think it'll help if we stick with one real world example that we can
relate everything back to so let's use a car driving along a flat straight Road
just like we held the tape measure up to our flagpole to measure the position of the flag we're going to use this number
line to show the position of the car along the road in physics we represent the horizontal
position of an object using the variable X position could have any unit of length
or distance such as inches feet miles or kilometers but we'll be using the SI unit of
position which is meters or a lowercase M for short as a reference one meter is equal to
about 3.3 feet or about one yard so let's say the car starts at a position of 5 meters but then it drives
to a position of 15 meters this is what we call displacement displacement is the change in position
of an object here's our equation for displacement in this little triangle here is called
Delta it's a letter of the Greek alphabet and it means the change in something
so in this case it means the change in position the way we actually calculate
displacement is the final position minus the initial position let's take a closer look at this
so you'll notice in this equation we have the variable X which means position but we also have these tiny letters f
and I when we have a variable with a small letter or number at the bottom right the
larger wider is our variable and the small letter is called a subscript the variable X means position and the
subscript f means final so together as a whole they mean final position
and x sub I or just x i means initial position so what was the displacement of the car
the initial position or x i is 5 meters and the final position or XF is 15 meters
from our equation we see that the displacement is the final position minus the initial position so in our case that
would be 15 meters minus 5 meters which gives us 10 meters so when the car drove forward its
displacement was 10 meters so now that we have an idea of what position is let's take a look at how we
could graph the position of this car over time as it moves to do that we'll start by listing the
position of the car at different points in time as if someone was standing on the side of the road with a stopwatch
and recording the position of the car at different times so let's say the car is driving forward
like this at the very beginning the position of the car is zero meters
and after one second the car's position is 5 meters after two seconds the car's position is
10 meters and after three seconds the position is 15 meters
now we have a table showing the car's position at different points in time so what would a graph of the car's
position over time look like we'll start with an empty graph where the x-axis or the horizontal axis
represents time and the y-axis or the vertical axis represents the position of the car on
the road now it might seem weird that we're putting the car's horizontal position on
the vertical axis of the graph but the reason is we always put time on the horizontal axis
that will make more sense throughout the course but for now just know that we always put time on the horizontal axis
of a graph so how do we graph the position of this car over time
we start by plotting the points that we have in the table on the left when time equals zero seconds the position of the
car is zero meters so we'll plot that point on the graph where time is zero and position to zero
next when time equals one second the position of the car is 5 meters so we'll plot the point where time equals one and
position equals five we also have points for when time equals two seconds and the position is 10
meters and when time equals three seconds and the position is 15 meters
now that we have some data points on our graph we can connect the points with lines like this
and there we go for this car's motion we've graphed the position versus time and now we have another way to visualize
that motion next let's talk about velocity velocity is similar to speed but we'll
talk about why it's different from speed later on velocity is defined as the displacement
of an object divided by the amount of time it takes that object to travel which is the same thing as the change in
position over time there are some common units we could use to describe velocity or speed such as
miles per hour or kilometers per hour but the unit we use in physics the SI unit of velocity is meters per second
abbreviated as M over s for reference one meter per second is roughly 2.2 miles per hour or 3.6
kilometers per hour so we represent velocity using the variable V and we represent time using
the variable t so here's our equation for the average velocity of an object
we could say the average velocity equals the displacement over time or we could write out each of the
variables separately let's take a closer look at this equation
so V with the subscript AVG stands for average velocity XF is the final position x i is the
initial position TF is the final time and TI is the initial time
altogether this equation says that the average velocity of an object equals the final position minus the initial
position divided by the final time minus the initial time
another way to say it is the average velocity equals the change in position over the change in time
and here are the SI units for the variables in this equation time is in seconds
position is in meters and velocity is in meters per second an important thing when we use physics
equations like this one the math only works out if we plug in numbers using SI units we can only get velocity in meters
per second if we plug in position in meters and time in seconds of course you could use any units you
want like inches and hours but then your velocity will be in inches per hour and things could get a little crazy
especially if you're using multiple equations in a problem so just remember to stick with the SI
units when we're using equations and one more thing I want to note here is that this equation that we just
learned is the same thing as this equation you might see this equation in class or
on an equation sheet these are the exact same equation but the variables have just been rearranged
all right so let's do an example problem to try out this equation a car is driving along a straight highway
it travels 800 meters in 35 seconds what is the car's average velocity first let's draw a picture to see what
this looks like it's pretty simple we just have a car on a straight road and it travels 800
meters next we're going to write down what we know
for this problem we know that the change in the car's position or the displacement of the car is 800 meters
we also know that the change in time is 35 seconds next we'll list out the equations that
we might be able to use since this problem wants us to find average velocity we'll use the equation
that we just learned since we know the displacement and the change in time we can just use the first
part of our equation average velocity equals displacement divided by change in time
we would plug in 800 meters for the displacement in 35 seconds for the change in time
and don't forget that we always need to keep track of our units using our calculator we'll do 800 divided by 35
and we'll find that the average velocity equals 22.86 meters per second and just a side note sometimes we might
write our units using a fraction like this and sometimes we'll write it out all in one line by using a slash
so you might have asked why didn't we use the other part of our equation with the initial and final variables
well we can try that too here we're using the equation average velocity equals the final position minus the
initial position divided by the final time minus the initial time the question is where do we plug in our
800 meters in 35 seconds well since the problem doesn't say what the initial position of the car is or
what the initial time is then we're always going to assume that the initial values are zero if they're not given
in this case our picture might look a little bit different now we can see that the car has values
for its initial position and for its final position at the initial position we assume that
time equals zero seconds and the position is 0 meters at the final position time is 35 seconds
and the position is 800 meters now we can plug in 800 meters for the final position 0 meters for the initial
position 35 seconds for the final time and zero seconds for the initial time and don't forget your units
800 minus 0 is 835 minus 0 is 35. now what we're left with is the same equation as last time and we find that
the average velocity of the car is 22.86 meters per second so we could have done this either way
the thing to remember is that if we're not given an initial value we have to assume the initial value is zero
but what if we are given both the initial and the final values let's use the example from when we made
a table of a car's position at different points in time so here's the new problem
a car is driving along a straight highway while someone records the car's position at different points in time
that's where we get our table from what is the car's average velocity from when time equals 2 seconds to time
equals three seconds first here's a picture of this scenario next we're going to write down what we
know in this case we're given the table of the car's position at different times next we're going to write down the
equations that we could use to solve the problem but this time we're specifically given
an initial point and a final point so we'll have to use the second part of our equation
our initial point is when time equals two seconds and the car's position is 10 meters
and the final point is when time is three seconds and the position is 15 meters
now in our equation we can plug in 15 meters for the final position 10 meters for the initial position 3 seconds for
the final time and two seconds for the initial time 15 minus 10 gives us 5 meters and three
minus 2 gives us 1 second 5 divided by 1 gives us 5 so the average velocity of the car between these two points is 5
meters per second so those are ways we could use the equation for average velocity
so just like we did with position let's see if we can graph a car's average velocity over time
we'll use the same motion of the car moving from when we graph the position and then we can use the same data points
that we had for the times and positions of the car what we're going to do is calculate the
average velocity of the car as it travels between each of these positions using our equation for average velocity
between the first and second positions the average velocity equals 5 meters minus zero meters divided by one second
minus zero seconds which gives us 5 meters per second between the second and third positions
the average velocity equals 10 meters minus 5 meters divided by two seconds minus one second
and that gives us 5 meters per second again and last between the third and fourth
positions the average velocity is 15 meters minus 10 meters divided by three seconds minus two seconds
which again gives us 5 meters per second all right great so now let's graph that again the horizontal axis will represent
time but this time the vertical axis is going to represent the velocity of the car
now notice how each of these average velocities that we found do not correspond to a specific time point
we didn't calculate that the car was traveling 5 meters per second at exactly one second or two seconds
we only found the average velocity of the car as it traveled between two points
so instead of plotting points on our graph let's just draw lines for each of these time intervals
this isn't how you would normally graph things but we'll clear that up in a second
so as the car traveled from zero seconds to one second the average velocity was 5 meters per second
and the same thing is true from one to two seconds and two to three seconds
so here's a nice graph that lets us visualize the average velocities that we found
but what did we graph exactly we were given the car's position at different points in time
then we found the car's average velocity as it drove between each of these points then we plotted that average velocity
across each time interval and it appears that the car is traveling at a constant 5 meters per second the
entire time but do we know that for sure when you're driving your speed might
vary a little bit right is it possible that the car's velocity went up and down like this
but the average for each time interval was 5 meters per second that actually is possible but we don't
know because we didn't graph the car's true velocity at every single instant in time only the averages
so how could we do that instead well every car has a speedometer which tells the driver how fast the car is
moving usually it's in units of miles per hour or kilometers per hour but for this
example let's say the speedometer reads in meters per second what if one of the passengers in the car
watched the speedometer and wrote down the car's velocity at different points in time
at the start of this journey they noticed the speedometer reads 5 meters per second
at exactly one second they notice that it reads 5 meters per second again and at two seconds it reads 5 meters per
second and at three seconds it still reads five meters per second
now what we have is a table showing the car's true velocity at specific points in time
and this is what we call the instantaneous velocity that means the car's velocity at any
specific instant this is different than when we found the car's average velocity between time
points however since the car's velocity actually didn't change over time it turns out that the instantaneous
velocities are the same as the average velocities so now we can graph the instantaneous
velocity and each point in our table corresponds with one point on the graph at zero seconds the velocity is 5 meters
per second at one second it's still 5 meters per second and at 2 seconds and 3 seconds the velocity is still 5 meters
per second now we can connect our data points with a line and we have a graph of the car's
instantaneous velocity over time and if the person in the car had recorded velocity every half second we
could add more points to our graph and so on until we have a graph of the car's true instantaneous velocity at every
single point in time so here's the question what would the car have to do so that
the velocity graph increases over time like this well for that we would need acceleration
acceleration is defined as the change in velocity of an object over time acceleration might seem a little bit
less relatable than velocity but it's still something that most of us are used to
if you've ever heard someone say something like my car can go 0 to 60 in four seconds
well they're talking about acceleration what they're really saying is my car can go from zero miles per hour to 60 miles
per hour in four seconds that means the acceleration of the car is its change in velocity which is 60
miles per hour over the period of time which is 4 seconds
60 divided by 4 is 15. so the acceleration of their car is 15 miles per hour per second
that's the same as saying the car can go 15 miles per hour faster every second when the car is accelerating after every
second that passes the speedometer moves up another 15 miles per hour and this unit might look strange but
that's what acceleration is velocity miles per hour divided by time seconds
written another way the unit of acceleration is a unit of position per unit of time
and that whole thing per unit of time so what would the SI unit of acceleration be
well our SI unit of velocity is meters per second and our SI unit of time is seconds
so this unit would be meters per second per second mathematically that's actually the same
as meters divided by seconds times seconds which is the same as meters divided by a
second squared and that's our SI unit for acceleration meters per second squared abbreviated M
over s squared and we'll be representing acceleration with the variable a
so a car is one example of an object that can accelerate what's another example
well it turns out that if you drop an object like a ball it'll actually accelerate as it's falling
this is what we call the acceleration due to gravity we don't need to understand gravity yet
or why this happens but it's a good time to mention that all objects that are falling with gravity have the exact same
acceleration this acceleration due to Earth's gravity is 9.8 meters per second squared towards the Earth
and we represent this special value using the variable lowercase G we'll leave it at that for now and we'll
come back to it later so how do we calculate acceleration here's our equation acceleration equals
the change in velocity over the change in time you might notice it looks similar to our
equation for average velocity let's take a closer look so a stands for acceleration VF is the
final velocity v i is the initial velocity TF is the final time and TI is the
initial time so this equation says that the acceleration of an object is the final
velocity minus the initial velocity divided by the final time minus the initial time
another way to say it is the acceleration is the change in velocity divided by the change in time
and here are the SI units for the variables in this equation time is in seconds velocity is in meters
per second and acceleration is in meters per second squared also although it's not super important I
do want to mention that just like our equation for average velocity this here is really the equation for average
acceleration but we won't be dealing with changing accelerations in this course so the
acceleration at any time will always be the same as the average acceleration also it seems that most classes and
equation sheets just call this acceleration so that's what we're going to do in this course
and like before you might see this equation written a different way like this
these two are the exact same equation but with the variables rearranged in different ways
so let's try an example problem a car starts from rest when the driver hits the gas and after 4.5 seconds the
car is going 27 meters per second what is the car's acceleration so first we'll draw a quick picture just
to see what it looks like next we need to write down what we know the problem says that the car starts
from rest in physics when we say an object is at rest that means that it's not moving and
therefore its velocity is zero so we'll say that at the initial point when no time has passed that the initial
time is zero seconds and since the car started from rest the initial velocity is zero meters per
second we also know that at the final point the final time is 4.5 seconds and the final
velocity is 27 meters per second after that we write the equations that we might use for this problem and here
we're looking at our equation for acceleration since we have an initial and a final
velocity let's use the right part of this equation so acceleration equals the final
velocity minus the initial velocity divided by the final time minus the initial time
next we'll plug in the variables that we know the final velocity is 27 meters per
second and the initial velocity is 0 meters per second the final time is 4.5 seconds and the
initial time is zero seconds and don't forget to keep track of your units
I usually find it easiest to write it out like this with each number and its unit in parentheses so that I can keep
them together if this looks a little confusing here's just the math that we're doing
27 minus 0 divided by 4.5 minus 0. if we plug that into our calculator we find that the acceleration of the car is
6 meters per second squared we know the units for our answer because we know the SI unit for acceleration is
meters per second squared and we have followed the rule of only plugging the correct s i units into this equation
so you might have asked why did we have to use the right part of the equation for acceleration could we have used the
other part acceleration equals change in velocity over change in time yeah we definitely could have done that
too instead of using initial and final values for velocity and time we could have used change in velocity
and change in time we might have read the problem and thought well it starts at rest and
speeds up to 27 meters per second so the change in velocity must be 27 meters per second
and it takes 4.5 seconds to speed up so the change in time is 4.5 seconds that way works too and for this problem
it seems simpler but sometimes the car isn't starting at rest and the initial velocity isn't zero
and later on we'll learn that if the car is going the other way the velocity is actually negative so we would have to
write out initial and final velocities anyway just to keep track of everything so long story short writing out initial
and final values is a good habit to make sure we don't mess up but for simple problems like this one we don't need to
alright so just like we did with position and velocity let's try to graph the acceleration of a car over time
this is the new motion of the car like before we can imagine there's someone in the car looking at the
speedometer and writing down velocity of the car at different points in time and this is what we get at zero seconds
the velocity is zero and the car isn't moving at one second the velocity is five
meters per second at two seconds the velocity is 10 meters per second
and at three seconds the velocity is 15 meters per second now what we can do is calculate the
average acceleration of the car between each pair of time points using our equation for acceleration
and I'll do the math for us what we'll find is that the acceleration between seconds 0 and 1 is 5 meters per
second squared between seconds one and two it's five meters per second squared
and between seconds two and three it's still 5 meters per second squared so we can see that the velocity is
increasing over time but the acceleration of the car stays the same and that makes sense the car has some
acceleration and acceleration is the change in velocity over time so the car's velocity changes over time
so what would our graph of acceleration look like as always we have time along our
horizontal axis and now we have acceleration along the vertical axis for the period of zero to one seconds we
know the acceleration is 5 meters per second squared from one to two seconds it's five again and from two to three
seconds it's still five and there we go we have a graph of the car's acceleration over time
however like we covered with velocity this is just a graph of the car's average acceleration plotted across each
time period but could we do what we did with velocity instead of just calculating the
average could we measure the car's acceleration at different points in time actually we could there are things
called accelerometers which measure acceleration and interestingly enough you have one in your phone
so like we said this car has an acceleration causing the car to speed up and the car's velocity to increase
but the actual value of acceleration doesn't change over time in this course and in most courses this
is as far as we're going to go we won't deal with accelerations that change over time
but could we have an object with an acceleration that increases over time like this
Yeah we actually could just like velocity is the change in position over time and acceleration is
the change in velocity over time jerk or jolt is the change in acceleration over time
and it turns out that we could keep going I just learned from Googling this that the next steps would be a jounce or
snap a flounce or a crackle and a pounce or pop
this is not a joke jounce flounce and pounce and snap crackle and pop are all real physics terms look it up on
Wikipedia but yeah for this course we're only going to work with position velocity and
acceleration alright lots of stuff in this video let's do a recap
first we learned about position which has the SI unit of meters and displacement which is the change in
position we also learned how we can graph an object's position over time
next we learn about velocity which is the displacement over time or the change in position over time
the SI unit for velocity is meters per second and we were in the equation for average velocity
we also learned that we could measure and graph an object's velocity over time and last we learned about acceleration
which is the change in velocity over time the SI unit for acceleration is meters
per second squared and we learned the equation for calculating acceleration
and finally we learned how we can graph the acceleration of an object over time so thanks for watching I'll see you in
the next video and we'll learn more about linear motion
Position refers to the specific location of an object at a given time, measured from a reference point. Displacement, on the other hand, is the change in position, calculated as the final position minus the initial position, indicating how far and in what direction an object has moved.
Average velocity is calculated by taking the displacement (final position minus initial position) and dividing it by the time taken (final time minus initial time). It provides insight into how fast an object is moving over a specific time interval and is expressed in meters per second (m/s).
Instantaneous velocity is the velocity of an object at a specific moment in time. It can be measured using tools like a speedometer, which provides real-time speed readings, allowing for a precise understanding of an object's motion at any given instant.
Acceleration is defined as the rate of change of velocity over time, indicating how quickly an object is speeding up or slowing down. It is measured in meters per second squared (m/s²) and can be calculated by dividing the change in velocity by the time taken for that change.
You can visualize motion by graphing position, velocity, and acceleration over time. Position-time graphs show how an object's position changes, velocity-time graphs illustrate how velocity varies, and acceleration-time graphs depict changes in acceleration, providing a comprehensive view of the object's motion.
Understanding linear motion is crucial as it lays the foundation for more complex topics in physics, such as two-dimensional motion and dynamics. Mastering concepts like position, velocity, and acceleration enables learners to analyze and predict the behavior of objects in various motion scenarios.
For a deeper understanding of kinematics and linear motion, you can explore resources such as 'Understanding Kinematics: Position, Displacement, Distance, Velocity, and Speed' and 'Understanding Acceleration: A Comprehensive Guide.' Additionally, guides on position-time graphs can enhance your visualization skills.
Keep this summary
Save it to LunaNotes and it becomes a real note in your library — editable, searchable, and ready to turn into flashcards or a diagram. Free to start.
Save to LunaNotesOr summarise for another video.
This summary and transcript were automatically generated using AI with the Free YouTube Transcript Summary Tool by LunaNotes.
Related summaries

Understanding Kinematics: Position, Displacement, Distance, Velocity, and Speed
This video delves into the fundamental concepts of kinematics, focusing on position, displacement, distance, velocity, and speed. It explains the differences between these terms using practical examples, including a detailed analysis of a person's movement and a race scenario.

Understanding Motion: A Comprehensive Guide
Dive deep into the concepts of motion, speed, and velocity, along with practical examples and clear explanations!

Understanding Kinematics: Constant Velocity and Acceleration
In this video, we explore the principles of kinematics, focusing on the kinematic equations for constant acceleration. Through practical examples, we demonstrate how to calculate final velocity and acceleration using displacement, time, and initial velocity.
Understanding Position-Time Graphs: A Comprehensive Guide
This video lesson explores the fundamentals of position-time graphs, focusing on how to interpret motion in a straight line. Key concepts include the relationship between slope and velocity, as well as practical examples and simulations to illustrate constant velocity and changes in position.
Complete Guide to Motion: Distance, Velocity, Acceleration & Projectile Physics
Explore fundamental physics concepts including distance vs. displacement, speed vs. velocity, acceleration, and motion graphs. Learn to solve typical exam questions on free fall and projectile motion with clear explanations and practical examples.
Most viewed summaries

A Comprehensive Guide to Using Stable Diffusion Forge UI
Explore the Stable Diffusion Forge UI, customizable settings, models, and more to enhance your image generation experience.

Kolonyalismo at Imperyalismo: Ang Kasaysayan ng Pagsakop sa Pilipinas
Tuklasin ang kasaysayan ng kolonyalismo at imperyalismo sa Pilipinas sa pamamagitan ni Ferdinand Magellan.

Mastering Inpainting with Stable Diffusion: Fix Mistakes and Enhance Your Images
Learn to fix mistakes and enhance images with Stable Diffusion's inpainting features effectively.

Pamamaraan at Patakarang Kolonyal ng mga Espanyol sa Pilipinas
Tuklasin ang mga pamamaraan at patakaran ng mga Espanyol sa Pilipinas, at ang epekto nito sa mga Pilipino.

How to Install and Configure Forge: A New Stable Diffusion Web UI
Learn to install and configure the new Forge web UI for Stable Diffusion, with tips on models and settings.
Found this summary useful?
Take it with you. One click puts it in your own LunaNotes library.
Save to LunaNotes