Introduction to AI-Driven Trading and Hidden Markov Models
In this video, we explore building trading strategies that mimic quant hedge funds using AI, specifically Hidden Markov Models (HMM). Unlike basic TradingView scripts, we develop a dynamic AI model that identifies market regimes and adapts to changing conditions. For deeper insight on how smart money influences price dynamics, see Understanding Market Efficiency: How Smart Money Drives Price Movements.
What Are Hidden Markov Models?
- HMMs predict market regimes (e.g., bull runs, crashes, choppy markets) instead of exact prices.
- This probabilistic approach allows strategies to be aggressive, defensive, or neutral based on detected market states.
- Popularized by trading legend Jim Simons, HMMs offer nuanced market insight beyond simple indicators.
Building the Regime Terminal Model
- The model classifies market states into seven regimes, such as bull run or choppy noise.
- Key configurable parameters include:
- Leverage (e.g., 2.5x) adjustable using AI fine-tuning
- Entry confirmation levels determining when to open trades
- Exit conditions triggered by regime changes
- Minimum hold time (signal hysteresis) to avoid premature actions
Live Demo and Backtesting
- Using Bitcoin hourly data over two years, the model is trained on 17,000+ data points to detect regimes.
- Trades are logged with momentum, probability, and confirmation details.
- Results show robust performance, outpacing simple buy-and-hold strategies while managing drawdowns. For an example of a full AI-based trading bot implementation, check Building a Stock Trading Bot with AI: My Journey and Results.
Technical Implementation Steps
- Core Logic with Python and ChatGPT: Generate HMM Python scripts for regime detection using features like returns, volume changes, and price range. You may find Introduction to Artificial Intelligence with Python: Search Algorithms helpful as a foundational resource.
- Google Colab Execution: Run and visualize regime assignments directly on historical Bitcoin price charts.
- VS Code Integration with Claude Code: Utilize the AI coding assistant to build a complete regime-based trading app with components:
- Data fetching from Yahoo Finance
- Backtest engine applying HMM regimes with layered strategies
- Risk management including cooldowns and position sizing
- Interactive dashboard displaying signals, charts, and metrics
Strategy Layering and Risk Management
- Entry triggered only when bullish regimes and 7 out of 8 technical criteria (RSI, ADX, MACD, etc.) align.
- Exit triggered immediately upon regime flip to bearish states.
- Configurable leverage and cooldown periods to control risk. For broader context on market maker models and layered strategies, see Mastering Market Maker Models: Forex, Indices & Stock Trading Insights.
Continuous AI-Backed Optimization
- Strategies are not static; AI agents adjust confirmations, leverage, and risk rules based on recent market behavior.
- Fine-tune aggressiveness and reduce drawdowns interactively through AI prompts.
- Avoid overfitting by monitoring performance and updating strategy logic dynamically.
Why Not Use Traditional Trading View Scripts?
- Trading View strategies are linear and rule-based, lacking adaptability for complex market regimes.
- HMMs allow probabilistic reasoning and regime detection that simple scripts cannot handle.
- AI-driven Python algorithms support multi-dimensional math, statistical models, and continuous learning.
Getting Started
- Copy provided Python scripts and prompts available in the author's community.
- Use Google Colab for initial testing.
- Set up VS Code with Claude Code extension for advanced development and deployment.
- Join the community to access detailed guides, codebases, and AI trading discussions.
Conclusion
Leveraging AI and Hidden Markov Models enables retail traders to access institutional-grade regime detection and adaptive trading strategies. By combining probabilistic models with AI-driven code generation and continuous optimization, traders can potentially enhance profitability and better navigate evolving markets.
In today's video, I'm going to show you how you can copy the exact strategies used by quants and hedge funds
completely with AI. Now, this is going to be super exciting because we're not just using simple Trading View
strategies and indicators. We'll be building and training our own AI model to behave just like actual institutions
instead of retail. Now, previously, you needed years of Python experience to be able to build something like this. But
today, I'll be showing you how you can do this from scratch without any prior experience using claw code. This way,
we'll have a complete mathematic model that will constantly change and adapt to the market to help you become a more
complete and profitable trader. So, in this video, I'll first show you what this model is exactly and how it works.
Then, I'll build it from scratch so that you can follow along and have your own version up and running. And like always,
I'm not a financial adviser and this is not financial advice. I'm just simply showing you how you can use the power of
AI to build out some of the most complex and powerful algorithmic models that are currently being used by institutions in
the space today. Now, to start, what we're going to be building here is something called hidden markoff models.
You might not have heard of it, but this was popularized by Jim Simons at RETech, who is essentially one of the most
successful traders in history. Rather than trying to predict price, HMM will try to predict regimes instead, which
basically tells you if the market is in a trending bull run, uh, a crash, or just choppy noise. It's a complex math
probability model at its core, but we just simply use it to tell us whether we should be aggressive, defensive, or sit
on our hands and do nothing, basically. And while this takes pretty advanced coding skills to build, we're going to
let Claude Code basically do all the heavy lifting for us. Now, here's what the model that we're going to build
looks like. It's going to be called a regime terminal. And baked into this model, most importantly, is the hidden
marov models that we were discussing. So, with this, it's essentially going to label all of the current states of the
market across one of seven regimes. So, for example, the first regime could be the best case, which is a full-on bull
run you can buy and then apply the same strategies. And then the worst case being something that's choppy, noise, or
something that you just completely should avoid. So to understand what we're doing here, we first have this
model baked in with seven states. Then we have the strategy which is 2.5x leverage. Now you can fine-tune this
with the AI model back and forth to find out how much leverage you know you're comfortable to put in and how aggressive
you want this model to be. Then we have the entry. So this is something that again you're going to test back and
forth to see how many confirmations you want before you actually enter into a trade. We have the exit which is only
when a regime changes. And then finally the minimum hold which is one of the most important aspects here. This is
typically called a signal hysterosis or regime confirmation lag. What this does is basically have a weighted time set to
your regimes. And at its core, it's just important to know that the money isn't just made on knowing when to enter. So
like even if you were to enter into like a bullcase regime, it's not so much that you buy immediately or if you were to
enter into a choppy regime, it's not that you sell immediately. Sometimes it's best just to wait and determine
what to do and in the patience to not just re-enter another regime. I think that's where a lot of this magic and,
you know, profitability is truly shown inside the regime terminal. And if this is confusing, let me just go ahead and
run it so you understand, you know, everything I'm saying. So, in this section here, we have a ton of different
tickers that I just added in. But for our example here, I'll make this simple and add in Bitcoin because it's always
trading. Then we can add in the date range for a back testing window. So this means that we're going to simulate how
it would have traded every single hour throughout the past two years if we use the same hidden markoff models with
these same exact strategies and presets. So with the minimum holds uh number of confirmations to enter and you know exit
whenever there's a regime change. So if we go ahead and click run analysis, we can see that it's actually training the
hidden markoff models. So if you were to watch the terminal here, this is what's happening in the background. So, it's
literally running 17,000 data points to build its own mathematical map of the market before it makes a single trade.
This way, the AI is basically learning the market from scratch here with all of our HMMs and strategies in place. And
then below, you can see all the actual trades with the momentum percentages, probabilities, and the confirmations
which triggered us to actually take that trade in this instance. Now, the most important part are the results here and
what makes this HMM model truly special. So it'll first tell you what regime you're currently in. So right now it's
detecting that we're inside the bull run trend. Like I mentioned, there's going to be seven different regimes. So it can
be bull run, crash, noise, chop. So it's going to tell you either to enter trades, exit trades, or hold if you are
inside the same regime still. And we can see that it's characterizing seven states based on 11,000 hourly samples.
And there's even a confidence. So this is a key portion so you know how probable it is that we are actually in
the detected regime that it says we're in. And obviously we need to layer this into the strategies which we do have
inside this left-h hand side as well. Then here we can see that the current signal is long holding. So what this
means is that essentially wants us to hold all the long positions that we currently have because we're still
inside the same bull run trend detected regime which is again one of the best regimes to stay in. So, just to repeat
how this works, at its core, we're first figuring out the state or the regime that the market is currently in. So,
right now, it's a bull run, which is very good. And then once we know the regime, then we're going to label on
strategies on top. So, this is where we use the amount of leverage, how long we're going to hold between regimes, uh
the amount of confirmations we need, which can be any sort of, you know, specific strategies or indicators baked
in. But the key portion and what really drives the model is this detected regime here. So by waiting for regimes to align
before we even place our strategies on top, you can kind of think of this as like a two-factor authentication. And
this is the performance. And we can see it's absolutely crushed the markets through a bare run, a bull run, and just
chop as well over the past 2 years. So based on the initial value, we basically 3xed a decently sized portfolio. We can
see the alpha sharp ratio, win rate, and max draw down here as well. And again, this is just one single strategy that we
never tweak throughout the period of the back test. But because this is a living algorithm, we can always have AI adjust
the strategies as needed with the regime detection here always in place and moving. So again, this is always going
to be dynamic with the detected regimes. But all the strategies that we lay on top of it can always be changing to make
sure that we're always optimizing for performance. And again, I'll show you how to do this exactly with AI. So, for
example, if we see that the bot is being too risky or that the draw down is too high, we don't have to study math,
right? We just open up our AI agent. We'll tell them, hey, the draw down is too high. We need to tighten the entry
signal. And now, you might be thinking, why not just build a strategy on Trading View? There's tons of videos on this.
Well, the fact of the matter is that strategies are pretty linear, right? If the strategy is dead, it doesn't work
anymore, and you basically have to move on to a new script. Trading View scripts are basically just calculators at the
end of the day. like you'll determine oh if RSI is above 70 or if something else happens and this happens then sell or
then buy which is very much like a simple calculation but as I'm sure you know the market isn't rigid it's messy
and that's why we need this complex model by using a fully customized algorithm in Python what we have here is
a probabilistic brain it uses Gausian distributions to calculate odds with technical math algorithms that you
literally could not do in Trading View it just simply doesn't have the power to handle complex matrix questions,
operations, or even detect hidden regimes. And the reason why we have this whole complex algorithm setup versus
just a script in Trading View is because markets change pretty drastically. The strategy that worked in 2024, it's not
going to work in 2025. And the strategy that worked last year will not work this year. But with this model, we can
retrain and evolve to new market structures to consistently stay profitable. Now, let's go ahead and
build this from scratch so that you have a working model to test for yourself. And if you want to get more information
on this exact process, as well as join an active community of AI traders and investors, make sure to click the link
in the description for my community as we have full complete guides on how you can actually use AI for trading across
any asset class. And if you're interested in more one-to-one work where we'll personally build you out custom
scripts and AI agents for trading, you can book a call at our website in the description at aipathways.io.
Now to start building this out, we need to first build out the core logic behind the hidden marov models. So again, this
is the math that will basically determine what regime the market is currently in. So you can think of this
as basically confirming that the bare bones HMM models do work at its core before we start layering additional
strategies on top of it. Now, you can skip this step and do it all in cloud code, but just to show you how I would
think about building this out from beginning to end, uh, it's typically easier just to start with making sure
that the core math works before we move on to the full buildout. So, to show you how simple this can be, I just went
ahead and pulled up chat GBT where we can have them essentially come up with the HMM logic for us to use inside our
coding agent. So, inside chat GBT, all you want to do is copy my script. And you can use any other AI model, but what
we're writing here is that we want to write a Python script for Google Collab that performs market regime detection on
Bitcoin with HMMs. And again, Bitcoin can be any other asset that you want to focus on. Now, next we have our
requirements. This is just the core data that we're going to use. So, we have Yahoo Finance, which is going to take
live market data for Bitcoin. Next, we're going to want to download hourly Bitcoin data for the past 730 days, and
then important functions to use. These are just a little bit more nuanced so that the code is working. And then all
we want from the chart data is open, high, low, close, volume figures. And then we have some error handling in case
the columns are multi-index. And then for feature engineering, we just want these three features, returns, range,
and volume change. And for actually training the model, what we're going to be using again is Gausian distributions
across seven different regimes. So that's where we're going to label all the different regimes that the market at
that time was currently in. Then finally, what we want is a summary table of one row per state showing the return
volatility. And this is essentially going to help us train and detect regimes correctly for this asset in the
past 730 candles. And then just to make everything a bit neat, we'll have a scatter plot with the close prices. So
we're able to see like when a certain time in market was labeled this regime versus this regime. So let's go ahead
and run it and wait for the return result. And if that prompt is too long or you just want the code directly, you
can feel free to join the community, get it from there and simply paste it into your computer. So this way you don't
have to like finingle with the AI model back and forth to make sure that you're getting the exact same code each single
time. So here we have our Python script. So just go ahead and click copy code. If you scroll down, you can see all of the
code that is being generated. And this is essentially going to be what makes up the HMM logic. Next, what we're going to
do is head into Google Collab, which again is a free tool that lets you run Python script without needing to really
download anything on your computer. So, go ahead and click new notebook from here and we can paste in the code that
we just got from the previous step. Once everything looks good, we can go ahead and click run to run the code. And
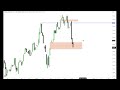
awesome, we have our HMM regime summary. So, it's actually plotted out on the historical Bitcoin chart when each
regime was basically detected. So, we have seven starting from state zero to state 6 on February 8th, 2026. This
would technically be state zero. And then with that state, we'd know whether we should be aggressive in a trade,
stop, or just not do anything at all. Now, this is great for visually understanding what it is we're doing
here, which again is just labeling states, right? The probability of these states, but we need to layer strategies.
Now, on top of it, we also need to know the probabilities of the regimes. So even if it's a detected regime, we need
to know the probability that it is indeed that specific like state six or state two or state three. And we need to
know what to do once we're inside a state or once one state changes to another state. So that's why we're going
to move over to cloud code, add in this core logic here. But now here we can get like a little creative, add strategies
on top and constantly adjust the algo here to make sure that we're making profitable trades. Next, what you want
to do is open up Visual Studio Code, which stands for VS Code. Now, this might seem a little bit daunting, but
don't worry, it'll be super simple to set up. All this is going to do is help us essentially host our entire codebase
as well as work with Claude Code directly. So, we're not going to touch any of the actual code. We're going to
have Claude Code essentially write it all out for us. But, this is where we'll keep everything tidy inside our own
folder. So, the first thing you want to do is just click open right here and just either open up a blank folder that
you have or create a new blank folder. And this is where all of your code is going to reside in. So now we're inside
our folder. I just labeled mine HMM. And next, what we want to do is download Claude Code onto VS Code. So super
simple. What you want to do is go over to extensions here. I already have this downloaded. Just go ahead and click this
and add it to your VS Code. So this is what the extension looks like. All you'll need to do to really work with
this is have your own Claude account. So once we do open up the extension, it's going to prompt you to log in. So this
is basically where you type in your username, password, and then from there, you can begin using Claude inside our
IDE here. So once the extension is downloaded, you should be able to see it in this top right hand corner. So go
ahead and click this. And then again, since this is probably your first time using it, it's just going to ask you to
sign in. Once you do sign in, you're able to begin working with Claude Code. Now, this is the most powerful AI coding
agent that's currently on the market. You can basically have them do anything for you. And in our case, complex math
algos that's going to help us learn the market better and become more profitable in our trades. So from our previous
step, we had our static chart that labeled regimes, but we obviously want more features like live statuses. Um, we
also want to know what to do inside each regime. So this is where we get really creative by using cloud code to add
strategies, time frames, indicators on top of the HMMs to create something truly useful. And then at the end, we
can make it look a little bit prettier since we are going to be working with this model day in and day out. Now you
can go ahead and copy my prompt. Exactly. But what we're doing here is essentially implementing that same core
logic that we guaranteed was working in the first step as well as layering strategies on top. So what we first want
to say is build a professional regime based trading app. Uh the core engine again is from the previous step. We
basically used Gausian distributions with seven components to determine market regimes. So again that was state
zero through state six and those were the seven regimes that we saw on the chart. And once again we have these same
exact instructions here which is train on three features returns range and volume volatility. Then we want to
automatically identify the bull run state. So this is basically going to that chart we just saw in the previous
step and finding out when was the highest positive returns. Those are obviously labeled as bull run regimes
and then when the lowest returns were and those were bare/crash regimes. Now next we have the strategy logic and this
is again where you get kind of creative. You can add in your own strategies you want to layer on top of the regimes. The
strategies are where we actually know what to do once we are in the correct regime. So in my case, I wrote that
we're only entering a trade if the regime is bullish and that seven out of eight of these conditions are met. So
again, you can tailor this to whatever your trading styles are, but I have RSI less than 90, momentum, volatility,
volume, ADX price, and MACD's. Now, this is going to take some finetuning between you and the model. And obviously this is
constantly going to change no matter what market you're in. Right now it's 2026, but these same strategies aren't
going to work in the same time period. This is where I'll show you later how you're going to basically go back and
forth with the AI model to fine-tune your strategy as time goes on, but the regimes do stay the same. Then we have
risk management rules. So this is going to enforce a hard 48 hour cool down after any exit where the bot can't
reenter. The exit rule is to close the position immediately if the regime flips to bear or crash. And leverage, you can
basically simulate how much leverage you want to use based on your own trading style and how aggressive you want to be.
We have some boring aspects, the architecture. So this is how we're going to fetch all of the data running
simulations, uh the dashboard, which is going to show all of our data as well as signals. um the chart where basically
that chart we saw in the previous step it's going to be plotted for us again and metrics for the total return alpha
versus buy and hold win rate and max draw downs. So once this looks good let's go ahead and run this inside cloud
code. So as you can see it's pretty intelligent. It's going to first create to-dos before it even works inside any
of the files and you can see all of the changes that it's making for you. So once you get to the finished product,
you're going to know how this is at least architectured a bit and it's essentially checking its own work.
You're not just getting tons of errors on the um on the output. So here we can see that the data loader file is where
they're going to fetch all of the live market data. The back tester is the core of the engine, the strategy logic and
risk management, which is all those portions of the prompt. Then we have the dashboard with the charts. And great,
after like five minutes or so, we can see that it's finished all the to-dos and it's given you a summary of what was
built so that you understand the architecture as well. Uh, basically there's going to be four main files. The
data loader, which is fetching all of the data via Yahoo Finance. Then we have the back tester which has all the HMM
training data, autolabeling regimes, the eight confirmation strategies, back test engine with the amount of leverage and
cool down time periods we have. And all of this is basically packaged inside the dashboard here. What we have is the core
engine, the hidden markoff models. We have entry and exits. And to enter, you're going to need seven out of eight
of the confirmations from our strategy. To exit, it immediately happens when a regime, a bullish regime, flips to a
bearish regime. Have our cooldowns leverages. And then on the dashboard, we're able to see how our current
strategies and HMM models are performing. Then it's going to go ahead and label the current signals. So, it's
going to take all of the current market data and then tell you what regime you're currently in, whether it's
changed from the last time, so yesterday's candle and what you should do in terms of taking a trade or not.
So, what we first have is the back tester to ensure that the strategy works to a degree. Then, we have the actual
signals on what to do currently, so you know whether you should take a trade, wait, or do nothing at all. And then,
finally, it gives you the command to actually run the dashboard. So, all you want to do is copy and paste this. So
you can open up the terminal from below here. Paste it in just like so. And it's going to go ahead and open up the window
for you. So just off that first initial prompt, we have our complete terminal here. We have what the current signal
is, which is cash. It's neutral. We shouldn't really do anything. See that out of the eight strategies. If we look
at today's candle, only four of them passed at 64,000, which is Bitcoin's price. Basically telling you don't do
anything. Um, and then if we were to run the same exact strategies and HM models historically, we had a 65% total return,
uh, 63% alpha with a 41% draw down. This is our price chart with the regime overlay, basically telling you all the
regimes you're in the equity curve. Um, and then you have all your trade logs and entries if you want to do start
using this inside uh, your actual trading. You can log your trades, be able to see when regimes change almost
immediately. These are the confirmation breakdowns. And then our starting capital and our final equity is if we
just ran the same exact strategy, right, with those eight confirmations and with the HMM with seven regimes. Obviously,
we can tweak the number of confirmations. We can also tweak the number of components inside the HMM as
well. Just going to need a little back and forth. And like I mentioned, core logic is sound. As the market evolves,
you will need to change out the strategies as well. And this is something we can do back and forth with
Claude code. And that's basically the coolest part, right? The first version of the algorithm is never perfect. Maybe
the strategy is too aggressive, too passive. Maybe the draw down is a little bit too scary. So you can literally
prompt back and forth with cloud code to essentially tighten up and make sure that your strategy is a little bit
better and optimized. And then obviously you would want to risk overfitting as well when looking at previous back
tests. But just to give you an example of what a prompt could look like, you can paste this in here where we can say
strategy is working great, but I want to test a high-risk variant. So this is where we're going to modify the back
tester to add an aggressive mode. Uh here we can potentially increase the leverage from 2.5 to 4x. Reduce the
required confirmations from 7 out of 8 to 5 out of eight. Add a trailing stop and then maybe a check box to enable or
disable the aggressive mode. So again, these are just little nuances that you can add. And then obviously you can just
switch up the whole entire strategy completely. But you'll just want to have, you know, a few weeks or months of
trading data from yourself personally. Go back and forth within the model and always tweak out those confirmations,
those strategies. But again, the core HMM's logic is going to really help you out by determining your regime to make
sure that the probability is good enough for you to even take a trade and apply your strategies. So even though the HMMs
stay stable, the strategies always adapt. So for example, a 2020 bull run regime would have required a breakout
strategy for example, whereas in 2024, so about a year ago, the bull run regime would have required something like a
mean reversion strategy instead since the market is much more efficient. So by working with AI constantly on the algo
and having them adjust your strategy on the fly daily, you can make sure that the model is trading the market as it
exists right now instead of just using your back testing window history. So assuming this is months down the line,
you can add a 48 hours cool down or more strict RSI checks, additional strategies, just things on top, the HMM
models. So like I mentioned earlier, you can use my prompts exactly to build out your own system. If you like the way I
set mine up in the beginning of the video, I have all of the full code files and prompts as well as other information
needed inside my community. Now, if you found this video helpful, make sure to leave a like, comment, and subscribe to
the channel if you're not already, as it greatly helps out.
A Hidden Markov Model (HMM) is a probabilistic statistical model that identifies different market regimes—such as bull runs, crashes, or choppy markets—instead of trying to predict exact price movements. By detecting the underlying market state, HMM allows traders to adjust their strategy dynamically, becoming aggressive, defensive, or neutral depending on the regime, which enhances adaptability and performance compared to static, rule-based methods.
Start by using Python to develop HMM scripts that analyze features such as returns, volume changes, and price ranges to detect market regimes. Train your model on historical data (e.g., Bitcoin hourly data) in an environment like Google Colab, then integrate it into a trading application using VS Code with AI assistants like Claude Code. Incorporate components such as data fetching, backtesting engines, risk management, and interactive dashboards to create a complete, adaptive trading system.
Risk management includes configurable leverage (e.g., 2.5x), entry confirmation thresholds, minimum hold times (signal hysteresis) to prevent premature trades, and cooldown periods after trades to manage exposure. The system only enters trades when multiple technical indicators align with bullish regimes and exits immediately upon regime reversal, thereby controlling drawdowns and optimizing position sizing dynamically.
Traditional TradingView scripts are linear and rule-based, lacking the ability to adapt to complex and changing market regimes. HMM combined with AI enables probabilistic reasoning, multi-dimensional statistical analysis, and continuous model learning, which allows the strategy to adjust in real-time to evolving markets, resulting in potentially better profitability and risk control.
Continuous AI optimization adjusts strategy parameters like confirmation levels, leverage, and risk rules based on the latest market behavior. This dynamic fine-tuning reduces overfitting risks, manages drawdowns more effectively, and helps maintain performance by adapting the model to new market conditions rather than relying on static rules.
The regime terminal model allows configuration of leverage ratios (e.g., 2.5x), entry confirmation thresholds for opening trades, exit rules triggered by regime changes, and minimum holding times to avoid false signals. Adjusting these parameters lets traders balance aggression and safety tailored to their risk tolerance and trading goals.
Beginners should start by reviewing provided Python scripts and prompts available in the author's trading community. Running initial tests on platforms like Google Colab helps understand model outputs. Then, progressing to setting up an integrated development environment such as VS Code with AI coding assistants enables building more advanced and deployable trading applications gradually.
Heads up!
This summary and transcript were automatically generated using AI with the Free YouTube Transcript Summary Tool by LunaNotes.
Generate a summary for freeRelated Summaries
Building a Stock Trading Bot with AI: My Journey and Results
I built a stock trading bot using AI and $11,000. Here’s how it fared against traditional investing strategies.

Understanding Market Efficiency: How Smart Money Drives Price Movements
This comprehensive guide unpacks the market efficiency paradigm, revealing how a small group of smart money traders—primarily banks and institutional players—control price movements, not the large retail crowd. Learn to recognize the distinct phases of price delivery, including consolidation, expansion, reversal, and retracement, and apply this knowledge to enhance trading strategies.
Mastering Market Maker Models: Forex, Indices & Stock Trading Insights
Discover expert analysis on the dollar index, forex pairs, gold, crude oil, and major indices, emphasizing anticipation over reaction in trading. Learn practical market maker buy and sell models, smart money reversals, and actionable strategies for consistent trading success.

Complete Trading Mastery: From Basics to Million-Dollar Strategy
Discover a comprehensive 10-hour guide teaching you how to trade markets effectively from scratch. Learn to analyze market structures, identify key trading patterns like head and shoulders, apply confluence strategies, and manage risk to grow from beginner to a profitable trader. This video includes live trade breakdowns and real-time insights from a seasoned trader’s journey from $100 to six figures.

Mastering Smart Money Mindset and Price Action for Market Success
This comprehensive mentorship session reveals the critical mindset shift from uninformed retail trading to a smart money perspective, emphasizing detailed price action analysis and disciplined chart logging. Learn to interpret market liquidity, recognize key price levels, and systematically track price movements across multiple timeframes for informed trading decisions.
Most Viewed Summaries

A Comprehensive Guide to Using Stable Diffusion Forge UI
Explore the Stable Diffusion Forge UI, customizable settings, models, and more to enhance your image generation experience.

Kolonyalismo at Imperyalismo: Ang Kasaysayan ng Pagsakop sa Pilipinas
Tuklasin ang kasaysayan ng kolonyalismo at imperyalismo sa Pilipinas sa pamamagitan ni Ferdinand Magellan.

Mastering Inpainting with Stable Diffusion: Fix Mistakes and Enhance Your Images
Learn to fix mistakes and enhance images with Stable Diffusion's inpainting features effectively.

Pamamaraan at Patakarang Kolonyal ng mga Espanyol sa Pilipinas
Tuklasin ang mga pamamaraan at patakaran ng mga Espanyol sa Pilipinas, at ang epekto nito sa mga Pilipino.

How to Install and Configure Forge: A New Stable Diffusion Web UI
Learn to install and configure the new Forge web UI for Stable Diffusion, with tips on models and settings.

If you found this summary useful, consider buying us a coffee. It would help us a lot!