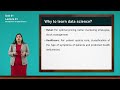
Introduction
In the realm of data science, understanding the weaknesses of the data science framework is crucial for reaching accurate conclusions and making informed decisions. This article explores prominent weaknesses in data science, such as confirmation bias, overconfidence bias, overfitting, and the importance of recognizing outliers. We will also delve into the basics of data visualization, offering insights into how to effectively present data to various audiences.
Weaknesses of the Data Science Framework
Data science is a powerful tool, but it is not without its pitfalls. Recognizing these pitfalls can significantly impact the outcome of your analysis and the decisions that follow.
Confirmation Bias
One of the most common traps in data analysis is the confirmation bias. This occurs when analysts focus on information that supports their existing beliefs and ignore evidence that contradicts them. Here are key points regarding this bias:
- Definition: Confirmation bias leads individuals to search for, interpret, and remember information in a way that confirms their preconceptions.
- Consequences: By ignoring contradicting data, analysts may overlook important trends and patterns, ultimately leading to poor decisions.
- Prevention: To mitigate confirmation bias, analysts should routinely re-evaluate their findings and consider a wider range of data.
Overconfidence Bias
Another critical weakness is the overconfidence bias, where experienced decision-makers may overlook essential steps in the research process due to their past successes and confidence in their abilities. Key aspects include:
- Definition: Overconfidence can result in decision-makers not rigorously questioning their methods or findings.
- Consequences: This bias can lead to missed opportunities for deeper analysis or failure to correct identified issues in the data.
- Prevention: Maintain a discipline of critically analyzing all steps in your research, no matter your experience level.
Overfitting
Overfitting occurs when a model is overly complex, capturing noise instead of the underlying data pattern. Important points about overfitting include:
- Definition: Overfitting happens when a model learns both the signal and the noise from the training data.
- Consequences: An overfitted model performs well on training data but poorly on unseen data. This misleads analysts into thinking they have found a meaningful relationship when they haven’t.
- Prevention: Employ techniques like cross-validation to ensure models generalize well to new data.
Recognizing Outliers
Outliers can significantly skew results if not recognized. An analysis should always account for outlier data points:
- Importance of Outliers: An outlier can distort the mean and other statistics, potentially leading to flawed interpretations.
- Example: In a dataset comprising the ages of employees, an age of 80 among mostly 20-24-year-olds significantly alters the mean age.
- Prevention: Analysts should identify, report, and address outliers when analyzing and presenting data.
Basics of Data Visualization
Effective visualization of data is paramount to communicate findings clearly and concisely. Understanding your audience is the first step in creating effective visualizations.
Knowing Your Audience
Understanding who will view your data visualization impacts how you present your findings significantly:
- Identify Audience Expertise: Are your viewers novice analysts or seasoned experts? This influences the level of detail you should provide.
- Use Appropriate Language: Technical jargon may not be suitable for newcomers but may be expected by experts.
- Tailor Presentations: Create different presentations for different audience categories (masters, scientists, newcomers, enthusiasts) to ensure clarity.
Strategies for Effective Visualization
Here are some principles to follow when preparing data visualizations:
- Define the Objective: Understand whether your purpose is to confirm information, educate, or explore new insights, as this will shape your presentation approach.
- Visual Accuracy: Ensure visualizations accurately reflect the data. Numbers and statistics presented must remain true to the underlying dataset.
- Memorability of Visuals: Strive for memorable visuals. Effective presentations will make data easy to recall for the audience.
Questions to Consider Before Visualization
Before creating visualizations, consider the following:
- What message am I trying to convey?
- Do the visuals accurately represent the data?
- Is the visualization memorable for the audience?
Conclusion
Navigating the intricacies of data science and visualization requires an awareness of common pitfalls like confirmation bias, overconfidence bias, and overfitting. Additionally, understanding your audience and the purpose of your visualizations is crucial for effective communication. By mitigating these weaknesses and adhering to best practices in visualization, data analysts can significantly enhance the credibility and impact of their analyses, leading to better-informed decisions.
[Music] [Music] dear participants in this sesson we will
learn some of the weaknesses of the data science framework and basics of data
visualization if we have to visualize the data so what are the things that we should remember before visualizing the
data how we should visualize so what are the things that we should consider and some of the weakness of the data science
framework so these are the two things that we will discuss in this session right pitfalls of the data science
framework and basics of data visualization so first weakness that is what you can say confirmation trap right
so this is the Trap that most of the people may face during the data analysis right so what happens when we pay more
attention to our belief right and ignore the facts and patterns in in the data then we fall
into the confirmation bias right I hope you understand what I'm trying to make you understand like somebody who is
experienced person right so that person might have come across with so many findings right so because of that that
person's belief got developed right this should happen in this way this is how it should happen right so because of that
sometime we ignore the facts and pattern that is there in the data but we are not able to see or we do not pay much
attention to it so if this is the indication then that person may fall into the confirmation prep right that is
what may happen with the I'm not saying it happens with everyone but it may happen with some of the people right
same similarly that I can tell you the one principle the things in which you believe more you try to see or that is
visible more in front of of you right so that is the belief that you will see right this is the impact of the belief
if you believe in something that is how it happens then you your attention towards that particular things will be
more and because of that you may ignore some of the things right which you should not do right so it may happen so
you have to think before after analyzing the data have you suffered from the confirmation trap or not so that is what
you need to recheck your results you need to reconfirm the results check it again and again so that you confirm you
are not suffering from the confirmation trap that is what may happen with you while analyzing the data so you need to
be very very careful about after the data analysis about the confirmation trap second trap that you may face that
overconfidence trap right so what happens in this case like senior decision maker who have been promoted to
higher positions in the organization based on past success like uh in past whatever decision that they have made
right so they have proved their decision making abilities in their throughout career right so because of that what
happens person gets overconfident right and does not pay much attention to the question
questioning math methods motivation communicating the findings so basically I can say that when somebody gets huge
experience while doing data analysis that person sometime does not give much attention to the research method process
that research process right identifying the problem developing the hypothesis collecting the data so sometime it
happens the uh this researcher may not do not pay more attention to the entire process so because of that because of
that negligence we miss some of these step or we do not go in depth as much as priority we should give we should give
to the each step that we do not give because the overconfidence that a decision maker that is having he may say
that I have done this particular activity so many times I have done this particular activity so many times
because of that I should not recheck it right so the such kind of mist mes that senior decision make uh decision makers
may make I'm not saying that always they make such kind of mistake but sometime it happens they make so whenever you
have analyzed the data and whenever you are conducting This research process so the research process has to be indepth
rigorous so that the impact of overconfidence bias of some of the people is not there on the on the
results right and so if because of this overconfidence about the research process that each steps of the research
process may suffer and because of that you may not reach to the right decision right or more appropriate decision uh
where you would have reached because of that it may be possible so you need to recheck the all entire entire process at
any step have you suffered with the overconfidence biased or not next step that you may be
facing that the overfitting Trap right sometime it may possible you are getting results which you have not
expected right some surprising results that you are getting it right so because of that you are excited and you are
trying to fit that particular result right that is what you are trying to make that result fit so that is also may
happen due during the research process whenever you are making this decision so now what you need to do you need to
think about these all three type of trap whether it is overfitting confirmation or overconfidence of the decision maker
any of the Trap if you are in then you will not be able to reach to the right decision you will not be able to do you
right analysis of your data that whatever data that you have at your hand so while doing this data analysis you
have to be very very cautious about this decision making process and fourth thing that I always say do not let your
analytics hide the truth right so what do you need to do in this case because when you are calculating the specially
mean mean value right so that may be impacted by the outlier so you need need to be very very
careful about the outliers in your data right for example for example average
is of five employees right so for example average is of five employees one employees age is 20 another one is 21
23 and 20 24 and one employees a is 80 right so because of this
at one employees a this entire mean of these five employees may be impacted right so whenever you are doing this
analysis you have to report this outlier one of the employee that is having the eight that employee is 80e old so when
you are highlighting because if you will not highlight then the average age of employee that is there approx 22 that is
the approximate that age is there average is is there so this age may be impacted because of this 80 one outlier
is there and because of that you will not be able to make the right kind of projection about the average age of the
employee so such kind of outlier whether it is related to the work experience whether it is related to the salary
whether it is related to the age whether it is related to number of application right from where they are coming so any
outlier is there in the in term of the source of application any outlier is there that you need to identify you have
to report it so that the truth of the data will not be hided if you will not report the outlier then possibility is
very very high you will not be able to tell the truth which your data is telling so what is my suggestion to the
all manager whenever you are analyzing the data please check your data whether it is having any outlier or not if
outliers are there then you have to be very very cautious about the data I hope it is clear to you right now whenever
you have to make the visualization so basics of the visualization if you understand so first thing that you need
to understand know your audience you should know your audience who is your audience is right so in this case what
you can in this case what you can say see uh X and Y that is what you can see so see the two dimensions are is there
one is X another one is y right on X you can see analytics expertise on X you can see analytics expertise so whoever is
your audience whether that audience is expert of analytics or no right so low to high so you need to so the one
Dimensions that is measuring the analytics expertise second dimension is measuring the knowledge of the specific
analytics project so whatever project that you are presenting so knowledge about that particular project so how
much knowledge that audience is having right so that is what you need to see low to high so in this case so that is
how you can divide your that is how you can divide your all audience into the four C category right
so if knowledge about the knowledge of the specific analytics project is high and analytics expertise also very high
then you can say they are the master so presentation data visualization for these master has to be
different from the newa because newcomer may not understand so many terms and that you have used in your presentation
right although these people are ma some of the people that category that we discuss first category that is the
master so they are the expert of the analytics as well as they are having the knowledge of the specific analytics
project right so you cannot give the same presentation to the all four categories right so you need to
understand so what you can do before making a data visualization presentation in front of anyone what you do you you
make this 2x2 matrix understand in which quadrant that the audience is coming whether it is coming in the master
whether it is coming in the scientist whether they are coming in the category of newcomer or they are the
enus right analytics expertise is low but knowledge about the project is very high right in the same way you can see
low uh expertise is low knowledge also very low so they are the newcomer just they have
started right so presentation for this newcomer has to be different from the Masters Master's presentation has to be
different from the scientist and scientist presentation has to be different from the enthus right so who
is your audience that you need to understand and as per the expertise of that audience you have to develop your
presentation or you have to visualize your data that is what you need to do it right so that is this is the one of the
way that I can suggest you to divide your audience into four categories and as per after dividing the C uh this
audience you can make your presentation so what are the things that you need to consider in a presentation we will
discuss in coming slides right so now what type of things that you can ask like based on these
four quadrant so first you need to understand who is your audience I already said how to do that 2x two
Matrix that scientist newcomer master so in which category your audience comes so answer that question they are the master
they are the scientist they are the newcomer how will it read it and interpret the information so how
newcomer will read it how newcomer will interpret it right so newcomer may not be aware about the each and every terms
so what do you need to do you have to give a detail of each and end terms what is xais what is Byxis how many numbers
are there what is the percentage right so everything has to be in detail for the
newc right opposite to that for a master it is not necessary everything has to be in detail but depth of the information
that has to be more right so depth that you can say cover of that analysis interpretation that has to be more in
the case of the master so that is what you can think of so first question that is what you can think of of before
visualizing it who is your audience and how they read it and they interpret it right second thing that you can do it
can you assume these individuals have a knowledge of the terminology and concept that you will see right so I already
said the moment you have assumed the CATE category and then you have to think whether they have the understanding
about the terminology and Concepts that you are going to use or not next you need to understand or so do they need
any assistance from the presenter from that visualization to understand that visualization if they need any
assistance you provide it so in the case of newcomer and eners they may need little bit more information than the
Masters and scientist right so that is what you need to understand right so that is what the note that I have
written it an audience of the expert will have a more expectation from the Jour audience right so
expectation expert will expect you should be able to drive some meaningful interpretation from the visualization
right so they may be interested in more they may be interested in the quality of information that you are presenting
through the visual Vis ization right so visualization tools next thing that you need to
understand what is the visualization functional role and how can visuals can take action from it right so after
visualizing you need to understand how viewer whoever is viewing that visualization how they can make a
decision about based on that how they can understand how they can use that particular information that you you have
visualized it so that is what you need to think about right so these are the questions that you can think in detail
before visualizing any data through the Excel by using Excel powerbi or
tblo right so next what is the aim of the data visualization that also you need to understand so aim of the data
visualization is to confirm the sum of the inform information right that is the purpose or is to give a Ed to educate
someone right that is the objective or to explore the new insights and new things right so what is the objective so
if objective is confirmation then your way of presentation has to be different if your objective is to educate
something someone then your presentation has to be different if your objective is to explore something some new thing that
you want to explore then your presentation has to be different right so in all three category the
presentation has to differ from one category to another category so before visualizing the data you need to
understand the aim of the visualization so how you can understand by understanding your audience carefully
right so what this your audience is expecting it is expecting to get it confirmed or it is uh expecting to get
it more educated about that particular data or it is uh that audience is having to wants to explore little little bit
more in depth about the problem all right so what is the objective that is what you need to understand the
objective of the data visualization so if you find it right objective you match with the right visualization strategy
your audience will be more happy right or you will be able to make more clear understanding ing about the
data to your audience right so after making the graph after making the graphs what do
you have to do right so but question comes how you should make the graph right first and then what questions that
you should ask so before making the graph I always suggest how you should make the graph in coming session also
you will listen when I will use this powerbi Excel or tableau in that also I will say clearly uh if you have
understood this d uh data science framework so first thing that I had focused on problem right problem HR
issues so the moment you have identify this HR issues
right from these HR issues now you need to identify the variables
right variables so like you have identify age gender work
experience uh expected salary right uh performance rating so
for example these are the variables that you have identified to understand one of the problem so what you can do here now
in the moment you have and you have collected the uh data in uh and then you have transformed it you have make it
appropriate for the analysis right so till here you have reached and that is what you have done it after this what
you have to do you have to think if you will make a
age and gender right these are the two variable so how you want their presentation
age and work experience how you want to present it right so whether you want to make age and genders together you want
to present it along with work average work experience also you want it right so in this case you can make it a
table right if you want to make it only age and gender in this case you can see age is a continuous and gender is a
categorical so in this case you can make a bar graph right an average age of male employees
and average age of female employees right second thing that you can do you can divide this age into the categories
right various categories that you can divide a age and then you can check how many
males are there how many females are there in that particular category so what I'm trying to make you understand
before visualizing this data you understand the nature of variables right nature of variables so gender is a
categorical work experience is a continuous expected salary is a continuous performance rating is a you
can say interval right so these are the categories that you need to understand and how these categories can be
presented well right and when you have to average it when you have to sum it when you have to multiply it right that
nobody is going to teach you right this basic mathematics understanding that you need to have by yourself nobody can make
you understand in this case you have to multiply in this case you have to add it so what you have to do you have to have
a basic understanding of the variable so understand the nature of the variable how it you want to present it and you
have thought this is the graph that you have to make it right now go to that particular tool and make that particular
graph right and before making the graph you understand through this graph what you want to communicate so ask question
what message am I trying to convey through this particular graph ask yourself what message that you want to
give it so if your message and your visualization both things are matched right then you can say that yes it is a
right kind of visualization right second second question that you can ask do my visuals accurately reflect the
number whatever number that you have presented so if you will see in coming sessions I will show some of the graphs
which are there but participants forgot to put the number right so whatever number that you want to put it put it
whether in the form of number absolute number that introduction session that if you remember I had discussed the way of
measuring the variable so how you want to measure it you want to measure it in term of the percentage you want to
measure in term of the percentile you want to measure in term of the percentage right percentile in term of
the number so how you want to measure it so is it reflecting the same number in which you want to measure it right so if
that is what you want to do it so you have to check your visuals accurately third and important question
question that you need to ask to yourself that is the is my data is memorable or not right if through the
visualization if some of the people are able to memorize your the data it means your visualization is very very good
right if people are not able to visualize the data me not able to me memorize the data then you can say your
data is not that good so can you visualize data in such a way so that people are able to remember your data
whatever data that you are going to present in any report or you are going to make a presentation in any PowerPoint
presentation so people are able to memorize your graphs they are able to memorize your tables anything that that
if it if answer is yes then you can say your your data visualization is very good right so I hope you would have
understood the process of understanding the audience and importance of the audience right in the data visualization
that is the one thing few principles related to the data visualization how you can make the better graph what you
should know before using this tool and techniques of the data visualization right so I hope you would have
understood these basic things related to this and weaknesses of the data science framework so thank you for understanding
this lesson [Music]
Heads up!
This summary and transcript were automatically generated using AI with the Free YouTube Transcript Summary Tool by LunaNotes.
Generate a summary for freeRelated Summaries
Understanding Data Science: Concepts, Importance, and Analytics Lifecycle
Explore the fundamentals of data science, its critical role across industries, and the detailed six-phase data analytics lifecycle. Learn how data transforms from raw, unstructured form into meaningful insights using various tools and techniques for effective decision-making.
Unlocking the Power of Statistics: Understanding Our Data-Driven World
Discover how statistics transform data from noise to insight, empowering citizens and reshaping scientific discovery.

Mastering HR Analytics: A Comprehensive Guide to Data Science Frameworks
Unlock the potential of HR analytics with our guide to data science frameworks and methods for effective decision-making.
Understanding the Data Science Framework for HR Analytics
Learn how to use the data science framework to analyze HR data effectively.
An In-Depth Guide to HR Analytics: Applying the Data Science Framework
Learn how to effectively apply HR analytics using a structured data science framework for optimal results.
Most Viewed Summaries

A Comprehensive Guide to Using Stable Diffusion Forge UI
Explore the Stable Diffusion Forge UI, customizable settings, models, and more to enhance your image generation experience.

Kolonyalismo at Imperyalismo: Ang Kasaysayan ng Pagsakop sa Pilipinas
Tuklasin ang kasaysayan ng kolonyalismo at imperyalismo sa Pilipinas sa pamamagitan ni Ferdinand Magellan.

Mastering Inpainting with Stable Diffusion: Fix Mistakes and Enhance Your Images
Learn to fix mistakes and enhance images with Stable Diffusion's inpainting features effectively.

Pamamaraan at Patakarang Kolonyal ng mga Espanyol sa Pilipinas
Tuklasin ang mga pamamaraan at patakaran ng mga Espanyol sa Pilipinas, at ang epekto nito sa mga Pilipino.

How to Install and Configure Forge: A New Stable Diffusion Web UI
Learn to install and configure the new Forge web UI for Stable Diffusion, with tips on models and settings.

If you found this summary useful, consider buying us a coffee. It would help us a lot!