Understanding Data Types: Qualitative and Quantitative Explained
Overview
This video provides a comprehensive overview of data classification, focusing on qualitative and quantitative data. It explains the differences between discrete and continuous data, and how to categorize various examples, including surveys and grouped data.
Key Points
-
Qualitative vs. Quantitative Data:
- Qualitative Data: Categorical information that describes qualities (e.g., color, type of dog).
- Quantitative Data: Numerical values that can be measured (e.g., number of dogs owned).
-
Types of Quantitative Data:
- Discrete Data: Specific values (e.g., shoe size, number of children).
- Continuous Data: Any value within a range (e.g., weight, age).
-
Examples of Data Classification:
- Number of dogs owned: Discrete and quantitative.
- Color of dogs: Qualitative.
- Age of dogs: Context-dependent; can be considered discrete or continuous.
- Weight of dogs: Continuous and quantitative.
-
Grouped Data:
- Data can be grouped into class intervals for conciseness, but this may lead to loss of original values.
- Understanding class intervals, lower and upper boundaries, and how to find midpoints is essential. For more on this topic, see our summary on Introduction to Statistics: Understanding Populations, Samples, and Data Collection.
Conclusion
The video emphasizes the importance of correctly classifying data types for effective analysis and understanding in statistics. To delve deeper into the types of data, you may find our summary on Understanding Physical Quantities: Fundamental and Derived Types helpful.
FAQs
-
What is qualitative data?
Qualitative data refers to non-numerical information that describes characteristics or qualities. -
What is quantitative data?
Quantitative data consists of numerical values that can be measured and analyzed mathematically. -
What is the difference between discrete and continuous data?
Discrete data can only take specific values, while continuous data can take any value within a range. For a more detailed explanation, check out Understanding and Classifying Real Numbers: A Comprehensive Guide. -
Can age be considered discrete or continuous?
Age can be context-dependent; it is often treated as discrete in casual conversation but can be continuous in precise measurements. -
What are class intervals?
Class intervals are ranges used to group data for analysis, which helps in summarizing large datasets. -
How do you find the midpoint of a class interval?
The midpoint is found by adding the lower and upper boundaries of the interval and dividing by two. -
Why is it important to classify data types?
Classifying data types is crucial for accurate analysis, interpretation, and application in statistical methods.
so the next part of collecting data is something that's a recap from gcse it's just to do with different types of
data and you need to know how to be able to classify different kinds of information
that you might be gathering now i've done it as a bit of a flow diagram so you start at the top part of
this diagram the first thing that you need to do you need to decide
is if something is qualitative which means it's categorical or if something is quantitative
qualitative the beginning of this word looks like the word quality and you might say like what was
the quality like of uh how would you describe something what was its quality
and you normally use non-numerical things like that so the quality of something could be its color
you'll notice that this word starts with quantity or quantitative and quantity is how you would measure
how many things there are of something so this would be like a numerical value that's what it would be for quantitative
data then quantitative quantitative data it's very difficult to say with
all the t's in there is numerical values that get split into two different kinds you then have discrete data and discrete
data can only take specific values like your shoe size or the number of children in a family
notice i've said shoe size here and i haven't said the size of your foot because the shoe
size you can go into the shop and you can only buy set shoe sizes whereas the size of your foot
is actually something that is continuous because it can take any decimal value and it's pos any decimal value that's
possible within a specified range so i've said here also know that while discrete variables only allow specific
values the range could still be infinite so it could be like the number of attempts before success on something
um doesn't have to be in a set range you could take an infinite number of times until you achieved success on a
particular game or whatever it would be so i've just got a few things down here that we're going to very briefly think
about what type of data they are because these are little one markers that will come up in your stats exam
it says eddie carries out a survey about the pet dogs his classmates own decide what type of data the following
are so make sure that first of all we decide whether it's one of these two and if it's quantitative you then have
to decide if it's discrete or continuous so how many dogs each person owns is what
discretes okay so it's going to be quantity quantitative quantitative and it's going to be
discrete pretty simple okay b says the color of the dogs which is
qualitative because it's being measured with words the type of dog
qualitative yeah qualitative forgive me for this being incredibly um boring
the name of each dog is okay the name of each dog no because it's not a numerical value
unless you've decided to name your dog 13 or 18 or something it's qualitative
and the age of each dog so this is why i'm not sure okay it's definitely quantitative
so it depends why do you think we are why do you think we might disagree on this
who was that was that proverb were you saying that this is um discrete why were you saying it's discreet
no because because i think it could be discreet it's like if i said to you amina how old are you okay 16 how old
are you how old am i 31 you just say like a discreet age
no one says i'm 16 years 7 months 3 days 5 hours 2.65 seconds so even though our like the time we've
been alive is continuous maybe the age of each dog is discrete i don't know
kind of depends on the context of what's happened here so this could be discrete or it could possibly be continuous
depending on what's actually being measured if we wanted the exact age of something
it's funny because when you talk to people about like babies and they say how old is the baby they don't say zero
or one they will say like oh three weeks old or and then suddenly it gets to a point
where you just say i'm 16. so it depends on the context of what's being asked here but i think the age of
each dog i think probably continuous i don't know i'm not sure the mass of each dog though
i'm pretty sure on this one is going to be quantitative and continuous
because although you would probably round the um the dog's weight it will have
an exact value it will need to be put into a group and i'm i'm kind of settling more
on the age of the dog being continuous rather than discrete i think discrete is probably how as
humans we describe it but in reality the age of the dog is a continuous measure
i think what do you think what would you go for i said i probably i'm gonna go with
continuous but it's up for debate and then the other thing that comes up in exercise one day
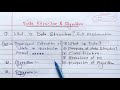
is some stuff to do with grouped data okay this is all stuff you know from gcse so i'm not going to ask us to do
this in class can have a look at our homework but you might have group data that looks
like this in a table and i've said that data can be grouped for conciseness
at the expense of losing the exact original values this means if you put data into groups
you don't have access to what the original values actually were so this one that i've got
down here this this group that i've got it's actually not called a group it's known
as a class interval so you need to be familiar with the term class interval
referring to this particular description that we've got you also need to know that the bottom
number is the lower class boundary the top number is the upper class boundary
and to find the midpoint how do you find the midpoint of two numbers you just add them get the total and
divide it by two so the midpoint of this is going to be 45 and you also need to know that the class
width is how wide that group is again pretty obvious so it's going to be 70 take away 20 so
the gap between them which is 50. so the class width of this is 50. and just kind of break down what
this is actually saying is that the weights of let's think we're talking about the dogs in the previous
example it's saying that the weights of the dogs are between 20 kilograms they could be
equal to 20 kilograms but they have to be less than 70 kilograms and that's just how the class intervals
work so you're going to just do at home you're going to do exercise 1d and think about the different kinds of
things to do with different types of data and grouped data as well
Qualitative data is categorical and describes qualities or characteristics, often using non-numerical values like colors or names. In contrast, quantitative data is numerical and measures quantities, which can be further divided into discrete (specific values like shoe sizes) and continuous (any value within a range, like height).
To determine if data is discrete or continuous, consider whether the values can only take specific, distinct values (discrete) or can take any value within a range (continuous). For example, the number of pets owned is discrete, while a person's height is continuous.
Sure! Examples of qualitative data include the color of a car, the type of dog, or the name of a person. Examples of quantitative data include the number of students in a class (discrete) or the weight of a dog (continuous).
A class interval is a range of values used to group data for analysis. It consists of a lower class boundary and an upper class boundary. For example, if the weights of dogs are grouped into intervals like 20-70 kg, 20 is the lower boundary and 70 is the upper boundary.
To find the midpoint of a class interval, add the lower and upper boundaries together and divide by two. For example, for the interval 20-70 kg, the midpoint would be (20 + 70) / 2 = 45 kg.
Classifying data types is crucial for proper analysis and interpretation. It helps in selecting the right statistical methods and understanding the nature of the data, which can influence the conclusions drawn from it.
Context is essential in determining data types because it influences how data is categorized. For instance, the age of a dog can be considered discrete if rounded to whole years, but continuous if measured in months or days, depending on the situation.
Keep this summary
Save it to LunaNotes and it becomes a real note in your library — editable, searchable, and ready to turn into flashcards or a diagram. Free to start.
Save to LunaNotesOr summarise for another video.
This summary and transcript were automatically generated using AI with the Free YouTube Transcript Summary Tool by LunaNotes.
Related summaries

Understanding Physical Quantities: Fundamental and Derived Types
This video explains the concept of physical quantities, defining what they are and categorizing them into fundamental and derived types. It covers the seven fundamental physical quantities and provides examples of derived quantities, along with their significance in measurements.

Statistical Methods for Economics: Data Classification and Frequency Distribution
This session explores the classification and tabulation of data for effective statistical analysis in economics. Key concepts include types of data classification, rules for classification, construction of frequency distribution tables, and understanding marginal and conditional distributions.

Understanding and Classifying Real Numbers: A Comprehensive Guide
Learn how to classify real numbers into natural, whole, integers, rational, and irrational with clear examples and explanations.
Introduction to Statistics: Understanding Populations, Samples, and Data Collection
This video provides an overview of the first chapter in statistics, focusing on data collection, populations, samples, and the importance of sampling methods. It also introduces key concepts such as census, sampling units, and the advantages and disadvantages of different data collection methods.
Introduction to Data Structures and Algorithms
This video provides a comprehensive introduction to data structures and algorithms, explaining key concepts such as data, data structures, their purpose, classifications, and operations. It also covers algorithms, their properties, and practical implementation examples.
Most viewed summaries

A Comprehensive Guide to Using Stable Diffusion Forge UI
Explore the Stable Diffusion Forge UI, customizable settings, models, and more to enhance your image generation experience.

Kolonyalismo at Imperyalismo: Ang Kasaysayan ng Pagsakop sa Pilipinas
Tuklasin ang kasaysayan ng kolonyalismo at imperyalismo sa Pilipinas sa pamamagitan ni Ferdinand Magellan.

Mastering Inpainting with Stable Diffusion: Fix Mistakes and Enhance Your Images
Learn to fix mistakes and enhance images with Stable Diffusion's inpainting features effectively.

Pamamaraan at Patakarang Kolonyal ng mga Espanyol sa Pilipinas
Tuklasin ang mga pamamaraan at patakaran ng mga Espanyol sa Pilipinas, at ang epekto nito sa mga Pilipino.

How to Install and Configure Forge: A New Stable Diffusion Web UI
Learn to install and configure the new Forge web UI for Stable Diffusion, with tips on models and settings.
Found this summary useful?
Take it with you. One click puts it in your own LunaNotes library.
Save to LunaNotes