Introduction to Chamber Enlargement and Hypertrophy
This session covers the identification of cardiac chamber enlargement and hypertrophy through ECG analysis, focusing on right atrial abnormality, left atrial abnormality, left and right ventricular hypertrophy, and dilatation.
Key Definitions
- Enlargement: Volume overload causing eccentric hypertrophy (chamber dilatation).
- Hypertrophy: Pressure overload causing concentric hypertrophy (increased myocardial wall thickness).
Atrial Abnormalities
Right Atrial Abnormality (RAA)
- ECG Changes:
- P wave axis shifts clockwise > +75°.
- Tall P wave amplitude > 0.25 mV in lead II.
- In lead V1, tall positive deflection > 0.15 mV with unchanged duration (<0.12s).
- Morphology: Tall, peaked P waves in limb and right precordial leads.
Left Atrial Abnormality (LAA)
- ECG Changes:
- P wave axis shifts counterclockwise < +30°.
- Notched (bifid) P wave in lead II with duration > 0.12s and at least one small square between humps (P mitrale).
- In lead V1, deeper and broader negative deflection > 0.1 mV amplitude and > 0.04s duration.
- P terminal force in V1 ≥ 0.04 mV·s (Morris index).
Biatrial Enlargement
- Combination of RAA and LAA features.
- Large biphasic P wave in V1 with initial positive >1.5 mm and terminal negative >1 mm amplitude and >0.04s duration.
- Tall peaked P wave in right precordial leads and wide notched P wave in limb or left precordial leads.
Atrial Enlargement in Atrial Fibrillation
- Presence of coarse fibrillatory waves (>1 mm amplitude) suggests atrial enlargement despite absence of P waves.
Left Ventricular Hypertrophy (LVH) and Dilatation
- ECG Axis: Left axis deviation < -30° due to stronger left ventricular vector.
- Voltage Criteria: Increased QRS voltage due to thicker myocardium.
- Lead V1: Deepened S wave (small r, deep s pattern).
- Lead V6: Tall R wave.
- Additional Indicators:
- Left atrial abnormality often coexists.
- Prolonged ventricular activation time (>0.05s) measured from QRS onset to R wave peak.
- Abnormal repolarization: ST segment depression and T wave inversion in left leads.
Common LVH Diagnostic Criteria
- Sokolow-Lyon Index: R in V5 or V6 + S in V1 ≥ 35 mm.
- Cornell Voltage Criteria: R in aVL + S in V3 > 28 mm (men), > 20 mm (women).
- Cornell Product: Voltage × QRS duration ≥ 2440 mm·ms.
- Romhilt-Estes Score: Points assigned for voltage, axis deviation, ST-T changes, and activation time; ≥5 points diagnostic.
Limitations
- LVH may be present without increased voltage in obesity, lung disease, pericardial effusion.
- Increased voltage without LVH in young, thin, anemic, or post-mastectomy patients.
Right Ventricular Hypertrophy (RVH) and Dilatation
- ECG Axis: Right axis deviation ≥ +90°.
- Lead V1: Tall R wave >7 mm, RS ratio ≥1.
- Lead V6: Deeper S wave.
- **Delayed ventricular activation time in V1 >0.03s.
- Additional Signs: S1S2S3 pattern (deep S waves in leads I, II, III), right atrial abnormality, right bundle branch block.
Types of RVH
- Type A: Typical RVH with rightward QRS vector.
- Type B: RVH with incomplete right bundle branch block.
- Type C: Posterior and rightward QRS displacement, seen in chronic lung disease.
ECG in Chronic Pulmonary Disease
- Vertical heart axis with rightward and inferior shift.
- Lead I shows very small deflection (Lead I sign).
- Poor R wave progression.
Combined Ventricular Hypertrophy
- Features of both LVH and RVH.
- Tall R waves in right and left precordial leads.
- Equifacial RS complex in mid-precordial leads (Cathedral or Cat Bacheler phenomenon).
- Voltage discordance between limb and precordial leads.
Heart Failure ECG Findings
- Combination of atrial and ventricular enlargement signs.
- Arrhythmias: atrial fibrillation, premature ventricular complexes, atrial ectopics.
- Possible bundle branch blocks.
- Echocardiography recommended for confirmation.
Summary
- Right atrial enlargement: Tall P waves in lead II and V1.
- Left atrial enlargement: Notched P waves in lead II, broad negative P terminal force in V1.
- Left ventricular hypertrophy: Increased QRS voltage, left axis deviation, prolonged activation time.
- Right ventricular hypertrophy: Right axis deviation, tall R in V1, delayed activation.
- Combined hypertrophy shows mixed features.
- ECG interpretation must consider clinical context and limitations.
This comprehensive guide aids clinicians in diagnosing chamber enlargement and hypertrophy using ECG, improving early detection and management of cardiac conditions.
For further reading, check out our Comprehensive Guide to Patient Identification and Normal ECG Interpretation for foundational ECG concepts. Additionally, explore the Comprehensive Guide to ECG Lead Systems and Their Clinical Importance to understand the significance of lead placement in ECG interpretation. For a deeper dive into the analysis of heart rhythms, refer to our Comprehensive Guide to Tachyarrhythmias: ECG Analysis and Classification. Understanding the underlying mechanisms can be enhanced by reviewing the Understanding Cardiac Electrophysiology and Arrhythmias: Key ECG Insights which provides essential insights into cardiac function.
Welcome all to the session on Chamber Enlargement. By the end of this session, you will be able to identify right atrial abnormality, left atrial abnormality, left ventricular hypertrophy and dilatation, and right ventricular hypertrophy and dilatation, in the ECG. First,
I would like to tell you the difference between enlargement and hypertrophy. The term enlargement is used when there is volume overload of the ventricle, causing eccentric hypertrophy. That is, there is dilatation of the chamber of the heart. The term hypertrophy is used
when there is pressure overload of the ventricle causing concentric hypertrophy. That is, there is increase in the thickness of the myocardial wall. So, we will be using these terms throughout the session. So, first we will see about right atrial abnormality.
So, we all know that the impulses originate in the SA node. From there, the depolarisation spreads to the right atrium and to the left atrium. The net vector of this is in this direction and the normal P wave axis is between
+30 to +75 degrees. Now, let us see what happens in a right atrial abnormality. In right atrial abnormality, there is a stronger right atrial vector and a normal left atrial vector. This will cause the P wave axis to shift clockwise. And in right atrial abnormality,
the P wave axis will be more than +75 degrees. In left atrial abnormality, there is a stronger left atrial vector. This will cause the P wave axis to shift anticlockwise. And in left atrial abnormality, the P wave access is less than +30 degree. So, that is the first
difference. In right atrial abnormality, the P wave axis will be shifted clockwise, more than +75 degrees. And in left atrial abnormality, the P wave axis will be shifted anticlockwise, that is less than +30 degrees. So, we will see the morphology of P wave. So, if you remember, in lead
2, the P wave is having 2 components, the right atrial component and the left atrial component. The normal amplitude of P wave in lead 2 is 0.25 millivolt, and the duration is less than 0.12 second. In lead 1, the P wave is having a biphasic shape; the positive
component contributed by the right atrium, and the negative component contributed by the left atrium. The amplitude of each of this complex is 0.1 millivolt, and the duration is 0.04 second. So, now, let us see what happens in a right atrial abnormality. So, in lead 2,
the initial component which is contributed by the right atrium will be more, will be increased in amplitude, and the latter component contributed by the left atrium will remain the same. So, what happens? In lead 2, in right atrial abnormality, the amplitude of
the P wave increases; it will be more than 0.25 millivolt; whereas the duration remains the same, less than 0.12 second. Now, let us see in V1. In V1, the right atrium, the positive uh component of the biphasic wave is contributed by the right atrium. So, that will be increased in amplitude.
The negative component will remain the same. So, in V1, in right atrial abnormality, you will see a tall, a positive deflection and a small negative deflection. The duration will remain the same. So, to summarise, in right atrial abnormality,
we will see tall P wave in both limb and right precordial leads. A positive deflection of P wave is seen in lead V1 or V2, more than 0.15 millivolt. There is no increase in the total duration of P wave. And the P wave axis in the frontal plane is more than
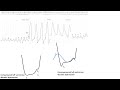
+75 degrees. ECG-1: We will see lead 2 and V1. We see P wave in lead 2 and V1 because P wave axis is in the direction of lead 2 and V1 being the right precordial lead. So, here, if you see the lead 2 and V1, what are we seeing? Here, we have a very
tall P wave of amplitude more than 4 millimetre. And in V1 if you see, there is a biphasic P wave with the positive deflection more than 0.1 millivolt. So, this is an ECG suggestive of right atrial ar abnormality. There are many other changes in this ECG, but right now
we will concentrate on lead 2 and V1. Now, let us move on to left atrial abnormality. Left atrial abnormality, unlike right atrial abnormality, it causes interatrial conduction disturbance, in which the duration of the middle and the terminal component
of the P wave is prolonged, owing to delayed left atrial activation. So, we already discussed about the P wave axis. There is an anticlockwise shift in the P wave axis, and the P wave axis will be less than +30 degrees. Let us see the morphology of P wave in left atrial abnormality.
So, the initial component in lead 2 which is contributed by the right atrium remains the same, whereas the one contributed by the left atrium is now prolonged. So, how do we, how do we see it in the ECG? We see a notched P wave in lead 2 with amplitude remaining the same, but the duration
more than 0.12 second. And in between these 2 humps, there should be at least one small square. In lead V1, the positive deflection contributed by the right atrium remains the same. Whereas, the negative deflection is now deeper and broader; increases in both amplitude and duration.
The amplitude will be more than 0.1 millivolt, and the duration will be more than 0.04 second. In left atrial abnormality, so, the P wave is notched with a duration of 0.12 second or more; this is called as P mitrale; in lead 2, and the 2 humps are separated by at least one small block.
There is a leftward shift in the P wave axis in the frontal plane to +15 degrees or beyond. A P terminal force in v lead V1 equal to or more negative than 0.04 millivolt second. So, what is P terminal force? It is nothing but the product of the amplitude and duration of
the negative component of P wave in V1. So, we already told, this amplitude and duration, both are increased in case of left atrial abnormality. So, this P terminal force will be more than 0.04 millivolt second in left atrial abnormality. This is called as
Morris index. Combined sensitivity of P terminal force in V1, more than 0.04 millivolt second, and P wave duration more than 100 millisecond is much more in diagnosing left atrial abnormality. So, let us see this ECG. Lead 2 and V1, we can see here. So, what do you see here?
What do you see here? In lead 2, the P wave is looking bifid or notched. And if you see carefully between the 2 humps, there is one small square; one small square between 2 humps. And in V1, what are you seeing? There is a positive component and a negative component which is
increased in duration, prolonged more than 40 millisecond. So, if you calculate the P terminal force, it will come more than 0.04 millivolt second; so, satisfying the Morris index. So, this is an ECG suggestive of left atrial abnormality.
So, what happens in a biatrial enlargement? In case of a biatrial enlargement, uh both these findings, both the findings of left atrial abnormality and right atrial abnormality will be present. That is, there will be a large diphasic P wave in
V1, with an initial positive competent more than 1.5 millimetre, and a terminal negative component more than 1 millimetre in amplitude and more than 0.04 second in duration, or both. Or, if there is a tall peaked P wave in right precordial lead and a wide
notched P wave in the limb lead or left recording lead like V5, V6, that is also suggestive of left biatrial enlargement. It is called as P tricuspidale. Or, there will be an increase in both amplitude and duration of P wave in limb leads.
So, a combination of findings of right atrial abnormality and left atrial abnormality are seen in ECG if there is a biatrial enlargement. So, let us see this ECG; let us concentrate on lead V1. So, what do you see there? In lead V1, there is a positive deflection which is well more than
1 millimetre in amplitude and a negative deflection of duration more than 40 milliseconds. So, there are findings of suggestive of both right atrium and left atrial abnormality. So, this ECG is suggestive of biatrial enlargement. So, how will you identify atrial enlargement
in presence of atrial fibrillation? In atrial fibrillation, you will not see a P wave; instead, you will see something called as fibrillatory waves, which are seen as baseline disturbances. So, you will see something called as fibrillatory waves and not P waves. So,
how will you identify atrial enlargement? So, you see the fibrillatory waves. If there are coarse fibrillatory waves, that means, the fibrillatory waves with amplitude more than 1 millimetre, it is suggestive of an atrial enlargement, even in presence of atrial fibrillation.
So, to summarise, in right atrial enlargement, the amplitude of the P wave is more in lead 2, and the positive deflection will be of more amplitude in V1. In left atrial enlargement, there is a notched P wave in with increased duration in la lead 2 and a
normal positive deflection and a broader and deeper negative deflection P wave in V1. A combination of these findings are seen in biatrial enlargement. So, now let us move on to left ventricular hypertrophy and dilatation.
So, we already told, the impulses originate from the sinoatrial node. They spread to the AV node. And from there, right ventricle is depolarised, then left ventricle is depolarised. The net vector of this will be in the direction, this direction
of lead 2, and the normal QRS axis is between -30 degree to +90 degree. So, what happens in left ventricular enlargement? In left ventricular enlargement, there is a stronger left ventricular vector which shifts the P QRS axis anticlockwise or leftward.
And the left axis deviation will be there of more than -30 degrees in left ventricular enlargement. So, the ECG, the sensitivity of ECG to diagnose left ventricular hypertrophy is limited. So, many criteria are being proposed to diagnose left ventricular hypertrophy in ECG. Most of these
criteria rely on increased QRS voltage. That is because, when the left ventricle is hypertrophy, that means, the thickness of the left ventricular myocardium is more. So, the amplitude of the QRS complex will also be more. So, let us see in the frontal plane, I am concentrating 2 leads,
V1 and V6; V1 being the right precordial lead and V6 being the left precordial lead. So, this is the normal uh ECG in a V1, lead V1. So, here we can see a small R wave and a deep S wave. This R is contributed to by the right ventricle, and S is contributed by the
left ventricle. In left ventricular hypertrophy, this S will be deepened. The S which co which is contributed by the left ventricle will be deepened and you get a small R, deep S in V1. This, if there is a small r, deep S like this in V1, it is suggestive of
left ventricular hypertrophy. What happens in V6? Normally, V6 will have a; because it is a left precordial lead, so, the V6 will have a tall R wave contributed by the left ventricle and a small S wave which is
contributed by the right ventricle. So, in left ventricular hypertrophy, there is an increase in the amplitude of this R wave contributed by the left ventricle. So, there are some pointers for a left ventricular hypertrophy uh in the ECG.
One I already told you, increased QRS voltage. The second one is a left atrial abnormality. During diastole, when the mitral valve is open, the left ventricle and left atrium behaves like a common chamber. And any pressure or volume differences in the left ventricle is reflected
to the left atrium also. So, the presence of an associated left atrial abnormality is a pointer for left ventricular hypertrophy. And ventricular activation time is the time taken for the impulse to travel through the myocardium to reach the recording electrode. In case of a left ventricular
hypertrophy, since the thickness of the myocardium is more, this ventricular activation time which is measured from the beginning of the QRS complex to the peak of the R wave, it is prolonged. Usually, it will be less than 0.05 second. Here it will be prolonged to more than 0.05
second. The intrinsicoid deflection is the point from which this uh impulse reaches the recording electrode. And so, because the ventricular activation time is prolonged, the intrinsicoid de deflection is also delayed. It is evidently seen in the
left precordial leads, that is, V5 and V6. If the amplitude of R in V6 is more than or equal to the R in V5, that is also suggestive of left ventricular hypertrophy. Because in left ventricular hypertrophy there is some abnormality in depolarisation, especially in
a concentric hypertrophy, it is associated with abnormalities in repolarisation, abnormalities in ST-T segments. The 2 most commonly used repolarisation criteria for diagnosis of LVH are QRS T angle more than 100 degree and the T wave which is upright in V2 and more negative
than 0.1 millivolt in V6. So, in addition to the findings which we mentioned above, if you see abnormalities in ST segment and T wave, that is also suggestive of left ventricular hypertrophy. The reciprocal changes are also present in the right precordial leads with ST elevation
and a tall T wave. There are a few criteria which are used commonly in clinical practice to diagnose left ventricular hypertrophy in the ECG. The most commonly used one is Sokolow-Lyon index. So, it says that uh ah amplitude of R in V5 or V6 plus the amplitude of S in V1,
if it is more than or equal to 35 millimetre, it is suggestive of left ventricular hypertrophy. If the amplitude of R wave in aVL is more than 11 millimetre, that is also suggestive of left ventricular hypertrophy. Then, another commonly used criteria is Cornell voltage criteria.
So, it says that the sum of the amplitude of R in aVL with S in V3, if it is more than 28 millimetre in men or 20 millimetre in women, it is suggestive of left ventricular hypertrophy. Cornell product is the Cornell voltage multiplied by QRS duration in milliseconds.
And if it is more than or equal to 2440 milliseconds, it is also suggestive of left ventricular hypertrophy. Then we have Romhilt and Estes criteria. They assign points to certain parameters, like 3 points are given if there is evidence of left atrial abnormality
or any increase in the voltage of QRS complex as evidenced by an R or S in limb lead more than or equal to 20 millimetre; S in V1 or V2 more than or equal to 30 millimetre, R in V5 or V6 more than or equal to 30 millimetre; or any ST-T abnormalities without digoxin.
Two points are given if there is a left axis deviation of more than -30 degrees, and 1 point is given if there is a slight widening of QRS complex more than 0.09 seconds. An intrinsicoid deflection in V5, V6 more than or equal to 0.05 second, and ST segment or T abnormalities with digoxin. So,
intrinsicoid deflection, I hope you understood. It is calculated from the beginning of the QRS complex to the peak of the R wave, the duration of that. If it is more than 0.05 second, we say that there is a prolonged ventricular activation time or delay in intrinsicoid deflection.
So, if the total score is more than or equal to 5 points, then it is diagnostic of LVH in the ECG. A score of 4 points is suggestive of probable LVH. Other ECG changes which are seen in LVH are a total QRS voltage, that is, the sum of the amplitude of all the QRS voltage in
the ECG more than 175 millimetre; presence of an incomplete left bundle branch block; attenuation of a small initial q in the left oriented leads; abnormal large Q in the inferior leads; a small equiphasic rs complex in aVF;
or a U wave amplitude which is increased in right leads or inverted in left leads. These are also pointers to left ventricular hypertrophy. So, we have seen like, all the criterias we have discussed so far uses the amplitude or the QRS voltage to diagnose
LVH. But there are some condition in which there will be left ventricular hypertrophy without increased voltage in the QRS complex, like obesity, peripheral oedema, anasarca, lung diseases like emphysema, patients with large breasts, biventricular hypertrophy,
pericardial effusion, pleural effusion, etcetera. So, in all these condition, you will get a ECG without increased voltage, but the patient will be having left ventricular hypertrophy. There are some conditions in which there is increased QRS
voltage not resulting from LVH, like adolescent boys, patients with anemia, patients who underwent left mastectomy, or thin individuals. So, these conditions have to be kept in mind whenever you are reading the ECG of any patient. So, this is ECG number 4. So, what are we seeing here?
Let us concentrate on the V1 to V6 chest leads. So, let us apply Sokolow-Lyon index here. So, we will calculate the amplitude of S in V1; it is coming around 20 millimetre. And we are calculating the amplitude of R in V6; it is coming 25. So, the sum of these two is more than
35 millimetre; so, satisfying the Sokolow-Lyon index. Let us see the aVL. The amplitude of R in aVL, it is more than 11 millimetre. So, that is also suggestive of left ventricular hypertrophy. If you apply the Cornell voltage criteria, we can see that R in aVL plus S in V3.
So, R itself here is 15; S is coming around 25; 15+25, it is well more than 28 millimetre. So, according to Cornell voltage criteria also, this is suggestive of left ventricular hypertrophy. If you apply the Romhilt and Estes criteria,
there is evidence of left at left ventricular hypertrophy as evidenced by increase QRS voltage; yes, well beyond 30 millimetre in the leads. So, yes, that is giving 3 points. And there are ST-T abnormalities; that is also giving 3 points. So, the score is well beyond 5.
So, according to Romhilt and Estes criteria also, this ECG is having left ventricular hypertrophy. Now, let us see right ventricular hypertrophy and dilatation. So, in right ventricular hypertrophy, there is a stronger right ventricular vector which shifts the net QRS axis
rightward or clockwise, and there is a right axis deviation of more than or equal to 90 degree. But here you have to understand that normally itself, left ventricular muscle mass is much more than the right ventricle; so, unless the right
ventricle is severely hypertrophied, this kind of axis deviation will not be there in the ECG. So, in the frontal plane, in right ventricular hypertrophy, there will be a tall R wave and a small S wave, because I already told you, the initial R is contributed by the right ventricle.
So, in comparison, I have given the left ventricular hypertrophy ECG also. So, in right ventricular hypertrophy, you get a tall R, small S. Whereas, in left ventricular hypertrophy, you get a small R, deep S, in lead V1. In lead V6,
in right ventricular hypertrophy, you are getting an R wave which is contributed by the left ventricle and a deeper S wave which is contributed by the right ventricle. Whereas, in left ventricular hypertrophy, you are getting a tall R wave in V6. So, the pointers for
right ventricular hypertrophy in the ECG are, right axis deviation of more than or equal to 90 degree; qR complex, a small q, tall R in V1, or an R wave of amplitude more than 7 millimetre in V1, or an R S ratio of more than or equal to 1, in V1. Similar to left ventricular hypertrophy,
in right ventricular hypertrophy also, because the right ventricular muscle mass is increased, there is a delayed onset of intrinsicoid deflection in V1 more than 0.03 second. We will see a small r deep S complex in the left oriented leads and an equiphasic RS complex in the
mid precordial leads. In adults, sometimes we see an S1, S2, S3 pattern. That is, a deep S is seen in lead 1, 2, 3, which is also suggestive of right ventricular hypertrophy. Presence of the right atrial abnormality or right bundle branch block may also be
seen. Similar to left ventricular hypertrophy, we can see ST segment and T wave changes in the form ST depression and T inversion in right precordial leads like V1 and V2. 3 types of right ventricular hypertrophy are identified. Type A:
It is the typical RVH pattern with anterior and rightward displacement of the main QRS vector. Type B is the one in which we will see an incomplete bundle branch block. And type C, there is posterior and rightward displacement of the main QRS axis. It is seen predominantly
in patients with chronic lung disease like emphysema. In that, the lead V1 may look normal, but we will see a deep S wave in the left precordial leads with right axis deviation. So, I like to mention about the uh ECG in chronic pulmonary disease. In chronic
pulmonary disease like emphysema, there is over inflation of the lung, which will push diaphragm downward. So, the heart is now aligned vertically. P, QRS, T wave axis, everything is shifted rightward and inferiorly towards lead aVF. Since lead
1 is perpendicular to lead aVF, lead 1 will show very small deflection. This is called as lead 1 sign in COPD. In addition, there will be poor R wave progression in the ECG also. So, this is ECG number 5. So, what are we seeing here? So, in V1, we are seeing a tall R and small
S. The R is definitely more than 7 millimetre in amplitude. The R S ratio is definitely more than 1. And there are, we can see the ST-T changes also. Can you see the ST-T changes in V1, V2, V3? So, that is also suggestive of a right ventricular hypertrophy. This looks like
a type A right ventricular hypertrophy pattern. So, let us see this ECG. In this, in V1, we are seeing a QR pattern; a small Q, tall R, and there is, in V2 and V3 we can see a right bundle branch block pattern also. So, this may be type B
right ventricular hypertrophy. Here, if you see, here we have a uh ECG suggestive of a right atrial abnormality also. In combined ventricular hypertrophy, a combination of these findings are seen; combination of left ventricular and right ventricular hypertrophy findings will be seen.
There is increased voltage of QRS complex, especially over the transition zones. That is, lead V3 and V4, we will see a tall R, deep S. Or, there will be left ventricular hypertrophy with right axis deviation or right atrial
abnormality. Or a left atrial enlargement with an R S ratio in V5, V6 less than or equal to 1, or S in V5, V6 more than or equal to 7 millimetre, or a right axis deviation of more than plus 90 degrees. Or if there is a voltage discordance between limb and precordial leads. If you see tall R
in ri left precordial leads, tall R in left precordial right precordial leads and large equiphasic QRS in the mid precordial leads, then this is called as Katz-Wachtel phenomenon. That is also suggestive of combined ventricular hypertrophy. So, I will show you an ECG. Here,
we are seeing tall R in right precordial, that is V1; tall R is seen in left precordial lead, that is V6; and in the mid precordial lead, we have kind of a equiphasic RS complex. So, this is called as Katz-Wachtel phenomenon, and this is indicative of combined ventricular
hypertrophy. In heart failure, you will see a combination of these findings. There may be findings suggestive of left ventricular enlargement, right ventricular enlargement, left atrial abnormality, right atrial abnormality; any combination is possible.
In addition, we will see arrhythmias, like atrial fibrillation, premature ventricular complex, atrial ectopics. So, those kind of arrhythmias may be present. In addition, the patient may have complete left bundle branch block or right bundle branch block
in the ECG. When these findings are present, we suspect heart failure. We have to do an echo to confirm systolic or diastolic dysfunction of the heart. These are my references. Thank you.
Chamber enlargement refers to volume overload leading to eccentric hypertrophy, characterized by chamber dilatation. In contrast, hypertrophy is a response to pressure overload, resulting in concentric hypertrophy, which increases the myocardial wall thickness. Understanding these definitions is crucial for accurate ECG interpretation.
Right atrial abnormality can be identified by observing a clockwise shift in the P wave axis greater than +75°, tall P wave amplitude exceeding 0.25 mV in lead II, and a tall positive deflection in lead V1 greater than 0.15 mV. The morphology typically shows tall, peaked P waves in limb and right precordial leads.
Key indicators of left ventricular hypertrophy include left axis deviation of less than -30°, increased QRS voltage due to thicker myocardium, and specific voltage criteria such as the Sokolow-Lyon Index, which requires R in V5 or V6 plus S in V1 to be ≥ 35 mm. Additionally, abnormal repolarization patterns like ST segment depression may also be present.
A tall R wave greater than 7 mm in lead V1, along with a right axis deviation of ≥ +90°, is indicative of right ventricular hypertrophy. This finding, combined with a deeper S wave in lead V6 and delayed ventricular activation time, helps confirm the diagnosis of RVH.
Left atrial abnormality is characterized by a counterclockwise shift in the P wave axis of less than +30°, with notched P waves in lead II and a broad negative deflection in lead V1. In contrast, biatrial enlargement displays features of both RAA and LAA, such as a large biphasic P wave in V1 and tall peaked P waves in right precordial leads.
Diagnosing LVH via ECG can be limited in cases of obesity, lung disease, or pericardial effusion, where LVH may be present without increased voltage. Conversely, increased voltage can occur without LVH in young, thin, anemic, or post-mastectomy patients, highlighting the need for clinical correlation.
Echocardiography is recommended for confirming heart failure findings because ECG can show a combination of atrial and ventricular enlargement signs, arrhythmias, and possible bundle branch blocks, which may not provide a definitive diagnosis. Echocardiography offers a more direct assessment of cardiac structure and function.
Heads up!
This summary and transcript were automatically generated using AI with the Free YouTube Transcript Summary Tool by LunaNotes.
Generate a summary for freeRelated Summaries
Comprehensive Insights into Cardiac Hemodynamic Tracings and Heart Failure
Explore detailed analysis of atrial, ventricular, and arterial pressure tracings within the cardiac cycle. Learn to distinguish waveform morphologies, understand pathologic patterns in conditions like constrictive pericarditis and tricuspid regurgitation, and grasp the implications for heart failure diagnosis and management.

Understanding Cardiac Electrophysiology and Arrhythmias: Key ECG Insights
Dr. Sanjay Andrew provides a comprehensive overview of cardiac electrophysiology, focusing on the heart's core electrical properties, ECG interpretation, and common arrhythmias. This session covers sinus rhythms, conduction disorders, and the classification of arrhythmias with practical ECG examples and clinical relevance.

Comprehensive Guide to Tachyarrhythmias: ECG Analysis and Classification
This session by Dr. Mailanandi provides an in-depth overview of tachyarrhythmias, focusing on ECG interpretation, classification, and clinical implications. Learn to differentiate narrow and broad complex tachyarrhythmias, understand common causes like AVNRT, AVRT, atrial flutter, and ventricular tachycardia, and apply diagnostic criteria such as Brugada's algorithm for effective diagnosis and management.

Comprehensive Guide to Patient Identification and Normal ECG Interpretation
This session by Dr. Vino covers essential steps in patient identification, ECG preparation, electrode placement, and interpretation of a normal ECG. Learn how to avoid common artifacts and understand special lead placements for accurate cardiac assessment.

Comprehensive Guide to ECG Waveforms, Intervals, and Heart Rate Calculation
Dr. Meena explains the fundamentals of ECG waveforms, intervals, and segments, detailing their durations, amplitudes, and clinical significance. Learn how to interpret P waves, QRS complexes, T waves, and calculate heart rate accurately using ECG readings.
Most Viewed Summaries

A Comprehensive Guide to Using Stable Diffusion Forge UI
Explore the Stable Diffusion Forge UI, customizable settings, models, and more to enhance your image generation experience.

Kolonyalismo at Imperyalismo: Ang Kasaysayan ng Pagsakop sa Pilipinas
Tuklasin ang kasaysayan ng kolonyalismo at imperyalismo sa Pilipinas sa pamamagitan ni Ferdinand Magellan.

Mastering Inpainting with Stable Diffusion: Fix Mistakes and Enhance Your Images
Learn to fix mistakes and enhance images with Stable Diffusion's inpainting features effectively.

Pamamaraan at Patakarang Kolonyal ng mga Espanyol sa Pilipinas
Tuklasin ang mga pamamaraan at patakaran ng mga Espanyol sa Pilipinas, at ang epekto nito sa mga Pilipino.

How to Install and Configure Forge: A New Stable Diffusion Web UI
Learn to install and configure the new Forge web UI for Stable Diffusion, with tips on models and settings.

If you found this summary useful, consider buying us a coffee. It would help us a lot!