Introduction
The Michaelis-Menten equation is fundamental in understanding enzyme kinetics, as it establishes a critical relationship between the rate at which an enzyme operates on a substrate and the concentration of that substrate. This equation gives us insight into the behavior of enzymes in biochemical reactions, differentiating between various types of enzyme inhibition. In this article, we will explore the components of the Michaelis-Menten equation, the significance of Vmax and Km values, and how the double reciprocal plot (Lineweaver-Burke plot) aids in determining these quantities.
The Michaelis-Menten Equation
The primary equation, expressed mathematically, helps plot a curve that describes enzyme behavior.
Understanding the Curve
When we plot the Michaelis-Menten equation on an XY axis, we observe a red curve that initially increases sharply and then starts to level off, approaching a maximum value called Vmax.
- The curve's behavior demonstrates that as substrate concentration increases, the rate of reaction approaches Vmax but never actually reaches it.
- This behavior leads us to the concept of asymptotic behavior where increases in substrate concentration yield diminishing returns in reaction rate.
Vmax and Km
Understanding Vmax and Km is crucial:
- Vmax: Maximum reaction rate achieved when all active sites of the enzyme are saturated with substrate.
- Km (Michaelis constant): Substrate concentration at which the reaction rate is half of Vmax.
To determine Km, one can draw a horizontal line from Vmax divided by two until it intersects the curve, followed by a vertical drop to the X-axis for the Km value.
Calculating Vmax and Km
Calculating Vmax and Km was historically challenging without computational tools. By transforming the original equation to a double reciprocal plot, or Lineweaver-Burke plot, the problem becomes computationally manageable:
- Take the reciprocal of both sides of the Michaelis-Menten equation.
- Rearranging yields a linear equation of the form Y = mx + b.
- Y-axis: Represents 1/Vmax.
- X-axis: Represents 1/[S] (reciprocal substrate concentration).
- Slope (m): Km/Vmax.
- From the plot, finding the y-intercept gives us 1/Vmax, enabling easy calculation of Vmax.
Importance of the Double Reciprocal Plot
Differentiating Enzyme Inhibition Types
The double reciprocal plot also plays a significant role in differentiating between three main types of reversible inhibitors:
- Competitive Inhibition
- In the presence of a competitive inhibitor, the slope of the curve increases, but the y-intercept remains unchanged.
- Km increases while Vmax stays the same because the inhibitor competes for the same active site as the substrate.
- Uncompetitive Inhibition
- Both Km and Vmax decrease, resulting in parallel lines on the graph. The y-intercept rises while the x-intercept shifts left.
- The inhibitor binds to the enzyme-substrate complex, effectively lowering the amount of functioning enzyme.
- Non-competitive Inhibition
- The x-intercept remains constant, reflecting unchanged Km, but the y-intercept increases due to a decrease in Vmax.
- The inhibitor binds regardless of substrate presence, reducing the maximum possible velocity of the reaction.
Conclusion
The Michaelis-Menten equation and the corresponding double reciprocal plot are invaluable tools in enzymology, allowing researchers to elucidate enzyme behavior and the effects of different types of inhibitors. By providing a clear framework for interpreting kinetic data, these concepts advance our understanding of biochemical reactions and enzyme functionalities, paving the way for further discoveries in the field of biochemistry.
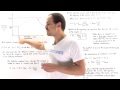
so the infamous equation that is continually used over and over in enzyme kinetics is the miches meal equation and
this is that equation and what this equation does is it builds a relationship between the rate at which
the enzyme operates on a certain substrate and the concentration of that substrate in that surrounding
environment so if we plot the following equation on the XY AIS we get the following red curve and notice an
important point about the red curve the red curve initially increases very rapidly so essentially linearly and then
the slope begins to decrease over time so the slope begins to level off and it approaches a maximum value known as the
Vmax it approaches that value asically and that's a very important mathematical term so what do we mean by a curve
approaching a number ASM totically what that means is every single time we increase the substrate concentration the
red curve gets closer and closer and closer to that Vmax value but what it means so proach asically is it never
quite reaches it so the red curve is never going to actually reach that Vmax quantity now that's problematic because
we want to be able to calculate what Vmax actually is and in fact if we can calculate what Vmax is then we cannot
calculate what the km value is the michaus constant so remember the michis constant basically describes the
Affinity of that substrate for the active side and the km value is the concentration of that substrate at which
that enzyme operates at a velocity that is exact L half of that Vmax value so if we know what this y coordinate is Vmax
divided by two then we can calculate exactly what the km value is we simply draw a horizontal line until it hits the
curve and then we draw a vertical line and that gives us the x coordinate the km value so if we can't calculate what
Vmax is because the slope never actually touches the Vmax value then we can't calculate what Vmax / 2 is and therefore
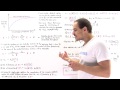
we cannot calculate what km is so back in the day before computers we really had no way of using this graph to
actually calculate what Vmax and km is so back in the day instead of using this michaus me an equation in this form we
changed the equation into a slightly different form and what we did was we took the reciprocal of the left side and
the right side of that equation now remember in mathematics if we have an algebraic equation and we change the
right side and the left side in the same exact way that uh that does not actually change the information that the equation
provides us with it doesn't change the information but what it does is it Chang the way it changes the way that that
information is actually displayed so the information from this particular equation basically gives us an ASM totic
curve but if we take the reciprocal of both sides we get a linear equation we get a straight line and now the same
pieces of information the km value the V Max and so forth is given to us in the form of a straight line and a straight
line is much more useful than this ASM totic curve because a straight line can be used to actually calculate what km is
and what V Max is so instead of using the above michaa Menan equation that gives us an ASM totic red curve we can
take the reciprocal of the left and the right side to obtain a double reciprocal curve also known as the line weav bur
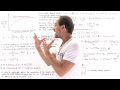
curve so if we take this equation we take the reciprocal of V KN we get 1 over V KN we we take the reciprocal of
this so the top is Vmax multiplied by this and the bottom is simply km plus the concentration of s so if we
reciprocate this simply goes to the bottom so the bottom becomes Vmax multiplied by the substrate
concentration and the top becomes km plus the concentration of s and now we essentially rearrange the equation we
distribute our denominator to this quantity and this quantity and we get the following result and
notice the concentration of the S cancels out on this second term on the right side of the equation and this
equation has the same exact form as a straight line so this left side 1 over V KN is the Y AIS so here's the Y AIS the
x axis this is the x value of that line so the x coordinate is 1 / the concentration of s the slope of the
straight line is km / V Max so the slope of the red line is KM ID by by Vmax and the Y intercept is 1 / V Max so what
this really tells us is the point where the curve intersects the Y AIS is the quantity 1 / V Max so if we carry out
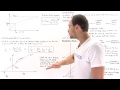
our experiment we collect the data points and then we plot the double reciprocal curve if we find what this y
value is so let's say it's 20 then we know that is equal to 1 / Vmax and if we solve for VMax we get that Vmax is equal
to 0.05 so that allows us to calculate exactly what the Vmax quantity is unlike
in this case where we had no way of actually determining what that Vmax is because the Curve Cur never actually
touches that Vmax quantity now what about the km well notice that the red curve also touches intersect the x axis
and if we basically let the left side of the equation equal to zero we can solve for what the xaxis is the xaxis is equal
to NE of 1 / km and so if we find exact what the x value is again let's suppose I don't know it's -2 then we said -2
equal to -1 / km and we find that km is equal to 0.5 and in this manner we can calculate exactly what the Vmax value is
and what the km value is in addition if we know any two points on the curve we can calculate what the slope is the
slope is simply km ided by V Max so this double reciprocal plot is a very useful way to basically determine exactly what
these quantities is and these qu or what these quantities are and these quantities can be used to basically
study the way that enzymes increase the rates of different types of chemical reactions now in addition to this
usefulness there's one uh one other important application of the double reciprocal plot we can also actually use
the double reciprocal plot to basically differentiate between the three different types of reversible Inhibitors
remember we have competitive Inhibitors we have uncompetitive and we have non-competitive and we can use the
double reciprocal plot as we'll see in just a moment to basically differentiate between which type of inhibitor is
actually present in our mixture so let's begin by disc discing how a competitive inhibitor will actually affect this
double reciprocal curve so the red curve describes the curve in the absence of that competitive inhibitor and the
purple curve describes that curve in the presence of that inhibitor so notice what happens in the presence of the
inhibitor the slope is greater the Y intercept is the same and the x intercept is less negative it's closer
to that origin the question is why well let's recall how this type of competitive inhibitor actually affects
the kinetics of enzymes so remember a competitive inhibitor binds exactly into the same location the same active side
as the substrate does and because it binds reversibly we can simply increase the concentration of the substrate to
basically replace and kick out that inhibitor and so all ultimately the Vmax value is not changed and if the Vmax
isn't changed because 1 / by Vmax is that y coordinate value it's that location where the curve intersects the
Y AIS both of these curves will intersect the same exact coordinate value because this Vmax does not change
and so one over Vmax also will not change now is affected by a competitive inhibitor well the km value is affected
remember in the presence of a competitive inhibitor the Affinity of that substrate for the active side
decreases and so we have to increase the concentration of s to basically get all those active sides occupied with that
substrate and so km will actually increase now if km increases then because the slope of the line is km /
VMAX Vmax will not change km increases and so the ratio km / by Vmax also increases and that's precisely why the
slope of the purple one uh purple line is greater than the slope of that red line and finally because the km
increases this one ided uh 1 divided by km ratio will essentially decrease and so this x coordinate the x intercept
will be close closer to that origin and so that's exactly what we see in this particular case so if we basically have
some type of unknown inhibitor we take out the uh inhibitor then we plot the red curve and then we place that
inhibitor into our solution and we plot the purple curve if this is how the curve changes we know that it must be a
competitive inhibitor now what about uncompetitive well let's recall what well actually let's first look at the
following plots so again the red describes the absence and the purple describes the presence of that
uncompetitive inhibitor and notice what happens essentially we take the curve and we shift it upward and notice the
slope doesn't change because these lines are parallel what changes is the x coordinate value where the line
intersects the X AIS and the y-coordinate value the Y intercept now why does that actually
take place well recall what an uncompetitive inhibitor does an uncompetitive inhibitor binds onto that
side of the enzyme that is only created when the substrate actually binds onto that particular enzyme so what that does
is it decreases the total number of enzymes that are functional in the mixture and so it brings down the Vmax
value decreases the Vmax value now if the Vmax value is decreased then the ratio 1 / smaller Vmax value means we
have a y intercept that is higher up and that's exactly why the Y intercept is higher for the purple curve than that
red curve now what happens to the km well the km is also affected the km also decreases and that's because when the
inhibitor actually binds onto that enzyme substrate complex to create the enzyme substrate inhibitor complex it
essentially increases the Affinity of that substrate for that enzyme because once the inhibitor binds onto that
enzyme substrate complex that substrate cannot actually leave the active side because its Infinity is higher and if
the infinity is higher the km value is lower so km will also decrease now if km decreases the ratio 1 / by smaller km
value will become more negative it will become larger in the negative Direction and so that means the new km value the
new 1 / km will be farther to the left along the x axis and that's exactly what we see happening here now what about the
slope why does the slope actually not change well the slope is given to us by the ratio km / V Max and in this
particular case both km and Vmax decrease and in fact they decrease by the same exact amount for example if km
decreases by a half this also will be halfed and so what that means is the ratio does not actually change because
the proportion will remain the same and so the slope km / by Vmax will not change and these two lines will be
parallel with respect to one another and so so if we take the case when we have the inhibitor and then we don't have the
inhibitor and we find that the two lines are parallel they have different X and different y intercepts that must mean
the inhibitor is in fact an uncompetitive inhibitor and finally let's see how a non-competitive
inhibitor actually affects that line Weaver Burke curve so if we look at the following uh graph we see that the the
red curve again the absence of that inhibitor the purple curve the presence of that non-competitive inhibitor and
notice that the slopes are different the slope of the purple line is greater we see that the Y intercept is different
this is greater but we see that the x coordinate is actually the same the x intercept is the same and that's because
as we discussed in the non-competitive inhibition case uh that inhibitor non-competitive inhibitor binds onto the
enzyme regardless of whether or not the substrate is actually bound onto that enzyme so the inhibitor can bind onto
the individual enzyme or onto the enzyme substrate mixture and what that basically means is the Vmax will be
smaller and so if the Vmax is smaller the y coordinate the Y intercept will be greater as we see in this particular
case now even though a non-competitive inhibitor binds onto the enzyme and
changes the shape of the active side of the enzyme that substrate
Heads up!
This summary and transcript were automatically generated using AI with the Free YouTube Transcript Summary Tool by LunaNotes.
Generate a summary for freeRelated Summaries
Understanding the Michaelis-Menten Equation: Enzyme Kinetics Explained
Explore the significance and implications of the Michaelis-Menten equation in enzyme kinetics.
Understanding the Michaelis-Menten Equation in Enzyme Kinetics
Explore the Michaelis-Menten equation, its derivation, and its significance in enzyme kinetics. Learn how enzymes interact with substrates.
Understanding Enzyme Kinetics: A Deep Dive into Reaction Rates and Michaelis-Menten Theory
Explore enzyme kinetics, reaction rates, and the Michaelis-Menten equation for understanding enzyme behavior.

Understanding the Michaelis-Menten Equation: Insights and Physiological Importance
Dive deep into the Michaelis-Menten equation, its significance, and how enzyme activity functions at various substrate concentrations.
Understanding Non-Competitive Inhibition in Enzymatic Reactions
Explore how non-competitive inhibitors affect enzyme kinetics using the Lineweaver-Burk plot.
Most Viewed Summaries

A Comprehensive Guide to Using Stable Diffusion Forge UI
Explore the Stable Diffusion Forge UI, customizable settings, models, and more to enhance your image generation experience.

Kolonyalismo at Imperyalismo: Ang Kasaysayan ng Pagsakop sa Pilipinas
Tuklasin ang kasaysayan ng kolonyalismo at imperyalismo sa Pilipinas sa pamamagitan ni Ferdinand Magellan.

Mastering Inpainting with Stable Diffusion: Fix Mistakes and Enhance Your Images
Learn to fix mistakes and enhance images with Stable Diffusion's inpainting features effectively.

Pamamaraan at Patakarang Kolonyal ng mga Espanyol sa Pilipinas
Tuklasin ang mga pamamaraan at patakaran ng mga Espanyol sa Pilipinas, at ang epekto nito sa mga Pilipino.

How to Install and Configure Forge: A New Stable Diffusion Web UI
Learn to install and configure the new Forge web UI for Stable Diffusion, with tips on models and settings.

If you found this summary useful, consider buying us a coffee. It would help us a lot!