
Introduction: The Foundation of Data Science
Data science and machine learning are among the top jobs of the 21st century, with an average salary of $120,000/year. This comprehensive course, led by Dr. Abanda Sarar (Ph.D. in Statistics from Stanford University), covers the statistical foundations needed to succeed in this field. For a broader overview of what this field entails, see our guide on Understanding Data Science: Concepts, Importance, and Analytics Lifecycle.
Key Distinction: Statistics vs. Machine Learning
- Statistics: Formulate a problem first, then get data to solve it.
- Machine Learning: Here is the data, tell me what it says.
- The key difference is that in statistics, the question is expensive and data is cheap; in ML, the question is cheap and data is expensive.
Types of Analytics
1. Descriptive Analytics
Describes what happened. For example, analyzing sales data to see where and when sales are declining. This is the starting point of analytics, as introduced in our Comprehensive Introduction to Statistical Methods for Economic Analysis.
2. Predictive Analytics
Uses data to predict outcomes. For example, if you reduce watch prices, will more people buy them?
3. Prescriptive Analytics
Recommends actions. For example, given the prediction, what marketing strategy or operational change should be implemented? This involves complex optimization.
Descriptive Statistics in Detail
Key Measures
- Measures of Location: Mean (average), Median (middle value), Mode (most frequent)
- Measures of Dispersion: Range, Interquartile Range (IQR), Standard Deviation, Variance
Understanding the Mean vs. Median
The mean and median differ when data is skewed. For example, in income data, the mean is often higher than the median due to high-income outliers. A right-skewed distribution means the mean is greater than the median. For a deeper dive into data classification, refer to Statistical Methods for Economics: Data Classification and Frequency Distribution.
- Mean: The "center of gravity" of the data.
- Median: The value that separates the bottom 50% from the top 50%.
Key Insight: The Five-Number Summary
A powerful descriptive tool consisting of:
- Minimum
- 25th Percentile (Q1)
- 50th Percentile (Median, Q2)
- 75th Percentile (Q3)
- Maximum
This gives a quick snapshot of the data's distribution, location, and spread.
Covariance and Correlation
- Covariance: Measures the direction of the relationship between two variables (positive or negative). It is not standardized and is unit-dependent.
- Correlation: A standardized measure of the strength and direction of a linear relationship between two variables. It ranges from -1 to +1.
- Important: Correlation does not imply causation.
Probability Basics
Core Concepts
- Sample Space: The set of all possible outcomes.
- Event: An outcome or set of outcomes.
- Probability: A number between 0 and 1 representing the likelihood of an event.
Key Rules
- Addition Rule (OR): For mutually exclusive events, P(A or B) = P(A) + P(B).
- Multiplication Rule (AND): For independent events, P(A and B) = P(A) * P(B).
- Conditional Probability: P(A|B) = P(A and B) / P(B). This updates the probability of A given new information B.
Bayes' Theorem
A powerful tool to "flip" conditional probabilities.
Formula: P(A|B) = [P(B|A) * P(A)] / P(B)
Real-World Example: Medical Testing
If an HIV test is 95% accurate (sensitivity) and the disease incidence is 1%, a positive test result may still only have a 16% chance of actually having the disease. This is because the large number of healthy people creates many "false positives." This counterintuitive result is explained by Bayes' Theorem. For more context on foundational concepts like populations and samples, check out Introduction to Statistics: Understanding Populations, Samples, and Data Collection.
Key Probability Distributions
1. Binomial Distribution
- Used for: Counting successes in a fixed number of independent trials.
- Example: Probability that exactly 2 out of 7 customers pay their bill on time, when each customer has a 60% chance of paying.
- Parameters: n (number of trials), p (probability of success on each trial).
2. Poisson Distribution
- Used for: Counting the number of events that occur in a fixed interval of time or space.
- Example: The number of customers arriving at a bank in a given minute.
- Parameter: λ (lambda), the average rate of occurrence.
3. Normal Distribution
The "bell curve." It is symmetric and defined by its mean (μ) and standard deviation (σ).
The Empirical Rule (68-95-99.7 Rule):
- 68% of data falls within ±1 standard deviation
- 95% of data falls within ±2 standard deviations
- 99.7% of data falls within ±3 standard deviations
Summary: The Path from Description to Prediction
The course establishes a clear progression:
- Describe the data using descriptive statistics.
- Use probability to quantify uncertainty.
- Build predictive models (like linear regression) to infer or predict future outcomes based on past data. For more on the broader role of statistics in understanding data, see Unlocking the Power of Statistics: Understanding Our Data-Driven World.
The session concludes by showing how descriptive statistics (like mean and standard deviation) are used with probability distributions (like the Normal distribution) to answer business questions, such as "What is the probability that a pack weighs less than 280g?" This bridges the gap between simply describing data and making informed predictions.
data science and machine learning is the hardest job of the 21st century with an average salary of
$120,000 per year according to LinkedIn the data science job profile is among the top five jobs in the entire world
now if you want to for into the world of data science you need to have good command over statistics as it forms the
base of all the data science Concepts so with the help of Statistics you can make predictions such as New York will be hit
with multiple tornadoes at the end of this month or the stock market is going to crash by this weekend now all of this
sounds magical doesn't it well to be honest it just statistics and not magic and you don't really need a crystal ball
to see into the future so keeping the importance of Statistics in mind we have come up with this comprehensive course
by Dr abanda sarar Dr abanda sarar has his PhD in statistics from Stanford University he has Tau Applied
Mathematics at the Massachusetts Institute of Technology being on the research staff at IBM let quality and
engineering development and analytics functions at General Electric and as co-founded omix Labs we are uploading
this highquality classroom session by Dr abanda sarar from great learnings business analytics and business
intelligence course it has been ranked number one analytics program consecutively for the past 4 years this
tutorial will be on YouTube for only a limited period of time so that Learners across the world can have access to high
quality content so please do subscribe to Great learn YouTube channel and share the video with your peers so that
everyone can learn from the best now without further delay let's have a quick glance at the agenda we'll start off by
understanding the difference between statistics and machine learning then we'll go through different
types of Statistics which are descriptive predictive and prescriptive after that we'll understand
the different types of data available going ahead we'll understand the concept of correlation and co-variance
comprehensively following which we'll head on to probability and learn how to implement
conditional probability with base theorem and finally we'll look at two types of probability distribution
binomial distribution and poison distribution so let's start off with the session what you now need to do is you
now need to be able to get the data to solve this problem
so therefore the statistical way of thinking typically says you formulate a problem and then you get the data to
solve that problem the machine learning we have looking at things typically says here is the data tell me what that data
is telling you many of my colleagues and I myself have run into this problem when going for interviews etc etc and so uh
um sort of statisticians say that um we're not getting jobs out there and so I go to uh go to people who are hiring
and saying that why don't you hire statisticians and I reach an interesting conclusion to this entire discussion um
that sometimes around the way the interviewer who's interviewing the statisticians for a data scientist job
ask the question um here is my data what can you say and the
statistician answers with something like what do you want to know and the business guy says but that's why I want
to hire you and the statistician says but if you don't tell me what what you want to know how do I know what to tell
you and this goes round and round right no one's happy about this entire process so there's a difference in the
way these two communities approach things my job is not to resolve that because in the world that you will
face you'll see a lot more of this kind of thinking than you'll see in this thinking because in this
world the data is cheap and the question is expensive and you're paid for asking the
right question in this world the question is cheap and the data is expensive you're
paid for collecting the data so sometimes you will be in a situation where this is going to be
important for example let's suppose you're trying to understand who's going to buy my
product you're asking the question let's say that my products aren't selling and you want to find out
why what will you do get what data so let's say that you're selling your I don't know what do
you want to sell um you want to sell watches say so let's suppose people AR buy buying watches
anymore which is a reality correct so you're a watch company who buys watches these the entire business model of a
watches disappearing do you have watches some of you
have he has actually a surprising number of you have maybe they do different things
these days right that that seems like a very that that's a fitness device is not really a watch at
all so so something like this was actually with my daughter at lunch today so she got something like this I'm not
sure my my my my wife who's an entrepreneur runs their own company she came back from Delhi she came back with
two of these I don't know where she picked them up so my my daughter the first thing she did she took one of this
and she took this thing out because she thought of the whole wristband as an unnecessary
idea I mean she that didn't occur to her I mean that's a separate thing that's a nice little beautiful red wristband Etc
so a watch is a different thing but let's say that you're a watch company nobody's buying your watches or fewer
people are buying your watches now how are you going to solve this problem or how you going to process this
information what do you want to do what do you want to know theel okay but remember I'm asking this
question also from an analytical perspective So when you say that to check the model and see what is not sold
that assumes the whole data question so you so first order you'll see sales for whom and when and how how do
you structure your data how will you how will you arrange the problem comp are your competitors sing
okay that makes problems even harder because now you're going to look for data that isn't with
you no no he's right he's right he's right maybe people are not buying watches because they're buying something
else that's a reasonable thing but let's keep this problem simple let's consider only data that is within
you we'll go outside not to worry but let's say that I'm looking at my data what data do I want to see and what
questions do I want to ask of it let's so sales year by year types and then what comparisons do I want to do year on
year year on year region region wise age with what purpose what question am I asking the data what
section of customers are buying my product or what section of customers are buying my product compared to
what what has changed in terms of the what are my biggest set of customers so that's so that's one thing who who are
my biggest customers okay that's a very interesting question to ask except that that question implies that I needed to
know who my biggest set of customers sort of could have been but it's a good point where is the
bulk of my sales coming from then someone else say something about time you know is it going is it going down so
you can look at things like saying that for which group of customers are my sales going down the
most for example you could ask that I'm not saying that's the right question but that's a possible question to ask so
let's suppose you follow that approach that I'm trying to understand I know that my are going down that's an obvious
thing my CEO is telling my CFO is telling me and if I don't stop this we're all going to be out of a
job correct the HMT factories in Bangalore are not in good shape one of them I think has become the income tax
office right somewhere in the mishwar area so that's going to happen to me if I if I don't do this well so I know my
sales are going down but I don't know by how much and particularly for whom so are there segments for which the sales
are going down which segments are sales going down the most in which segments are they going down a little bit how
fast are they going down I can question I can ask questions of that
sort now what conclusions at the end of this do I want to be able to do how do I need to how do I want to use
this information now for this you usually follow something like a three-step
process and you may have seen this and this this covers both these sides and these words should be should be familiar
to you to some extent the first is called descriptive the second is called
predictive and the third is called prescriptive have these words been
introduced to you at least in this at least you've read it I'm sure you you all Cruise the web and look at blogs and
things like that nothing new in this I'm sure but I just want to set a context because it's going to talk a little bit
of what we descriptive there's a c here so descriptive predictive and prescriptive now what is a descriptive
problem the descriptive problem is a problem that says that describe for me where and I'm losing my sales and when
I'm losing my sales it just describes the problem for me it tells me where the problem is it
locates it it isolates it the predictive problem says look at this
data and give me an idea as to what might happen or what would happen if I change
this that or the other so let's suppose I do the following kind of idea I say that let me relate my sales to my prices
let me try and understand that if I reduce my prices of my watches will more people buy
them conversely if I make my Watches luxury items increase the price of a
watch remove a low-end brand and make a watch an aspirational thing a decorative item a luxury item a brand item so that
people wear a watch not to see the time but also as a Prestige statement as a fashion statement whatever it is if I do
this then what will happen that's predictive I'm trying to predict something based on it I'm trying
to say if something happens to let's say one part of my data what will happen to the other part of my data and then and
based on that the doctor carries out a predictive analysis of you because I see this I now think you have this
issue you have this thing going on let's say I'm diagnosing you as being pre-diabetic you're not yet diabetic but
you're happily on the way to becoming a diabetic now because of this I now have to issue you a
prescription I now should tell you what to do
so there's a data that comes from you that data in some way is modeled using the domain knowledge that the doctor
has and that model has translated into a into an action that action is designed to do
something typically it's designed to do something actually fairly complicated the first action the doctor
tries to do is number one let's say Do no harm the hypocritic oath first let me make sure that that I
don't do any unnecessary harm to the patient then let me shall I say optimize his or her
Welfare by making sure that I control the blood sugar the best and that I postpone the onset of diabetes as best
as I can it's a complex optimization problem of some sort in a business also it's a
complex optimization problem right I need to be able to sell more
watches but I also need to be able to make money doing so I can increase my sales but if I increase my sales
and my profits go down or my earnings Go Down based on the cost then that's a problem but at the same time if I try to
run a profitable business and nobody buys my product that also is not a particularly good
idea then there are other issues maybe in running the company I've got employees that I want to keep on the on
on on the boards how do I run the company in such a way so that it needs that particular labor
force I have finances to take care of I have loans to repay how do I get the cash flow in order to repay the bank
loans that I have so the prescription has to meet lots and lots of requirements if you're building an
autonomous vehicle you'll have situations saying the car has to do this but it also has to follow certain
other rules for example if it sees someone crossing the road it should stop but it shouldn't stop very suddenly
because if it stops very suddenly is going to hurt the car it's also probably going to hurt the
driver so it can it should needs to stop but it shouldn't stop too suddenly it has to follow the rules of the
road because otherwise the computer will simply say oh you want me to avoid the person crossing the road I'm just going
to go behind the person and you going going to tell the car please don't do that because there's
a house next to it you can't just sort of do that oh you didn't tell me that you just told me to
avoid the person you didn't tell me about the house okay we'll put that as a
constraint in our program and see how well it goes so prescription is problematic another simple way of doing
it might be to say that description is how many centuries has Virat kohi scored look up Crick info and it'll give you
the answer prediction might be try to guess how many centuries verat kohi will score
in the World Cup prescription might be how do we get vat kohi to score more centuries in the world
cup and as you can figure out you're going from a purely data BAS version of the problem into something that's only
notionally about the data data will help you but there's a lot more than the data when it gets to
that what we'll do today what we'll do now once I've finished talking to you is we'll we'll take a look at what
descriptive what the the descriptive part of analytics is so the descriptive part of analytics
is talking about simply describing the data without necessarily trying to build any prediction or any models into it
simply telling you the way it is this is hard this is in itself not necessarily an easy thing to do because you need to
know very well how to do that and what are the ways in which one looks at data this is skillful in
itself so for example let's suppose that you are you're the I'm you're a do you go to the doctor and the the doctor is
looking at you looking at your symptoms and the the doctor recommends a blood test now how does a
doctor know what blood test to recommend based on the symptoms based on the symptoms but remember that
potentially there's an enormous amount of information in you all of us as biological things carry
an enormous amount of information in in our blood in our neurons in our genes or wherever you know if you're talking
about Big Data as I said there's 2 meters inside every cell and there are a few billion neurons in your head
you don't need to go far to see big data you are big data you are one walking example of big
data we all are right now in that big data what little data does
the doctor know to see that's a descriptive analytics problem the doctor is not doing any
inference on it the doctor is not building a conclusion on it the doctor is not building an AI system on it but
it's still a hard problem because given the vast amount of data that the that the that the doctor could potentially
see the doctor needs to know that I I this is interesting to me and this is interesting to me and this is
interesting to me and this is interesting to me in this particular way for example a blood test let's
suppose that I draw I draw blood from you for a particular purpose let's say for blood sugar correct leaving aside
the biology of how much blood etc etc to draw um
just neither none of you I guess are a do any of you are doctors here any doctors in the
room doctor so I can say whatever I want you won't understand what I'm saying no no but so but I'm old enough that this
is a real problem for me so you have a you have a large amount of blood that's flowing through you we all do this blood
carries nutrients what that does is that every time there is a nutrient inflow the
blood looks a little different so if you eat your blood looks a little different because that's your blood's
job the blood's job is to carry nutrients if you want to run you want to walk if I'm walking around my legs are
getting energy from somewhere the energy need from my legs is being carried from the blood and it
is being generated through inputs that I get some of it because of the air that I breathe from where it gets the oxygen to
burn things some from the food that I've eaten the nice lunch that that I had where it gets the calories to do that so
therefore based on what my energy requirements are and based on what I've eaten my blood is not
constant my blood content is what is known as a random variable what's random about it because
it looks a different it looks really different all the time your blood at 12:00 is going to
look a little different 12:00 at midnight is going to look a little little different from
12:00 at noon because it's doing something a little different the same phenomena is there
everywhere if I were to for example measure the temperature of the oil in your car or in your two- wheeler what do
you think that temperature will be it depends first of all it depends on whether the car is running or not it
depends on whether it has run or not it depends on how much oil there is it depends on how you drive it depends on
temperature rest of the car the answer is it depends and the same is true for your
bodily fluids so this becomes a slight problem because if it is
random then from a random quantity how do I conclude what your blood sugar is how does a doctor reach that reach a
conclusion of any sort average of what average of particular duration so
there are multiple averages that you can get first of all there's a question of saying that if I take blood from you how
is the blood usually collected so the fotus comes and usually takes an injection from one point let's say by
some strange accident this is Thoroughly in advised but let's say by say some strange accident two different people
are drawing blood from two hands at the same time do not try this at home but let's suppose they do do this
will they get the same blood IDE ideally yes it depends what time
same right at the same time as I said do not do this at home but at the same time you're getting two different samples
there's not just a question of time your blood is not going to look the same even within your body at one period
of time even from the left hand even from the right hand exactly the same period
of time it's not going to look the same there is a slight there is a slight problem that somehow a little obvious
that that you know your your your heart is in the middle your heart is actually in the
middle but it beats to the left why because the the heart is what the heart is both a pump and a suction
device the pump side is on the left the suction side is on the right so your blood pose out from your left side and
it goes back in on the right side so there's a slight asymmetry in your body between left and
right one side tends to go out the other side tends to come in it's slight it mixes up all in the
middle so one sampling idea is that I'm taking a sample of blood from you and it's just one
example the second question is as you were saying it's a question of time so you can average over time if you average
over time this is really easier you can say I'm going to do this maybe before eating after eating reg after eating so
for those of you who have blood pressure test for example oh sorry blood sugar test once they ask you to do it fasting
and then they ask you to do it some 2 hours after eating do they tell you what to
eat sometimes with glucose okay sometimes they don't they they sort of say that based on what you naturally eat
let me figure out what you are processing they expect you to eat a typical meal and not go and eat you know
large amounts of KFC if that is is not what you normally eat just eat what you normally eat a vegetarian eat normal
vegetan eat normal food and then figure it out let's see how how good your body is at trying it out so it's saying do a
normal thing and I'll take another normal sample then one of you said something
very interesting they average things out now what does averaging do neutralize that's an interesting word
to use neutralizes things Prov a general provide context provide context context of what
context there a good point so so what is the doctor trying to do so let's let's simplify things a little bit and say
that let's suppose that the doctor has a threshold let's give it a number let's say the doctor says that if your blood
sugar is above 140 I'm going to do something if your blood sugar is say less than 140 I'm not going to do
anything I don't know whether this is the right number or not but just let's make it up
now the doctor is going to see from you a number it may be a single reading it may
be an average it may be a number of things how is the doctor going to translate what they see from you and
compare it to the 140 how is that comparison going to be made maximum number of
people Maxim so let's suppose I have just one reading so let's suppose that I have one
reading and that reading oh I don't know is 135 I've just got one reading from you
135 what does that tell me no test required one AR one argument is it's simple let's take a very machine
learning computer science view to this 135 is less than 140 ahuh so now he's saying yeah but you
know what let's say that 135 and another guy who say 14 120 there should be something
that says that this 135 is a little bit more trouble than 120 closer to the threshold as he
says so maybe in other words this threshold isn't quite as as simple as I thought it
was so I can solve this problem in one of two ways one way to do this is to make this
140 a little range this is something called fuzzy logic right in other words the question
you're asking becomes fuzzy not as crisp you're not fiddling with the data you're fiddling with the boundary you're
fiddling with the standard the other way to do that is to create a little uncertainty or create a
little plus minus around the reading itself around 135 saying that if this is
135 and let's suppose that I go and get another reading and the second reading that I get is say
130 and the third reading that I get on the day after that is say 132 and I'll say
Okay seems to be fine I might say but let's suppose after 135 the guy goes and I do my usual thing
and I measure it again and this time it comes out as 157 and I do it again and it comes out
as 128 and I do it again it comes out to be 152 so in both cases 135 was probably a
good number but in One cases 135 was wearing very little and the other cases 135 was wearing a
lot which gives me different ideas as to how to process it so what descriptive analytics talks about
essentially is trying to understand understand certain things about data that helps me get to conclusions of this
kind a little more rigorously now to be able to quantify what these plus minuses are is going to
take a take us a little bit of time and we will not get there this residency we'll get their next
residency to say that in order to in order to say it's not 135 or 135 plus minus something that question now needs
to be answered but to do that I need to have two particular instruments at my
disposal one instrument that I need to have at my disposal is to be able to know what to measure I need to say what
does an error mean I need a statement that says that maybe I'm 95% confident that something is happening I'm 95% sure
that this is below 140 I need a way to express it and that is the language of
probability so what we will do tomorrow is we'll introduce a little bit of the language of probability
it'll be sort of unrelated to what we're doing today so there's going to be a little bit of a
disconnect but what we're going to do is we're going to create two sets of instruments one instrument that is
purely descriptive in nature and one set of instruments which is purely mathematical in nature so that
I can put a mathematical statement on top of a description and the reason I need to do
that is because the pure description is not helping me solve the problem that I've set itself that I have set
so therefore what will happen is you will see in certain medical tests you will not see points like this
you will see intervals your number should be between this and this your chestal number your
HDL whatever should be between this and this you won't see a number you'll see a range the typ typifies the variation and
in certain cases you will see thresholds or maybe the it's just a lower limit or an upper limit but you'll also see a
recommendation that says Please do this again in other words I'm going to compare I can't compare one number to to
one number one number to one number is typically a very bad place for any kind of analyst to be in because you got no
idea of which is error prone and where the error is so therefore what happens is you try to improve one of those
numbers and so either by filling around with the range or by getting more measurements and you'll do that and
you'll see that as we go along a little later so this is a context for for what we have uh in terms
of terms of data let's see so this is a set of files that has been loaded uh it's a very standard set of
files it's not mine to be honest uh I just want to make sure that I'm doing what I'm supposed to be
doing so so for reasons that are more to do with security my understanding The Notebook will not
access your drives so keep it on your desktop and not complicate
life so uh and there is this notebook it's called cardio goodness of
good the word statistics refers to the idea that this is comes from the statistical way of thinking
which as I said opposed to the machine learning we have thinking is tends to be a little more problem First Data next
which means we worry about things like hypothesis and populations and sampling and questions like
that and the descriptive part refers to the fact that it is not doing any inference it is not predicting anything
it's not prescrib anything it is simply telling you what is there with respect to certain questions
that you might POS possibly ask of it now what is the context to the case the market research team at a
company's assigned the task to identify the profile of the typical customer for each treadmill product offered by the
company the market research team decides to investigate whether there are differences across product line with
respect to customer characteristics exactly what you guys were suggesting that I should do with
respect to the watch understand who does what entirely logical the team decides to collect data on individuals who
purchase a treadmill at a particular store during the past 3 months like watches they're now collect looking at
data for treadmills and that is in the file in the CSV
file so what you should have is you should have a CSV file in the same um
directory and through the magic of python you don't have to worry about things like
path before we get there remember because we're looking at
this statistically before we get the data we should have a rough ideas as to what we're trying to do and so they say
that here are the kinds of data that we are looking at the kinds of products the gender the age in years education years
relationship status annual household income average number of times a customer plans to use a treadmill each
week average noriz a customer expects to run walk each week on a self-rated Fitness scale on 1 to five where one is
in poor shape and five is in excellent shape some of this is data some of this is
opinion right some of this is opinion masquerading as data like for example number of times a customer plans to use
a treadmill hopeful wishful thinking it's still data you're asking
someone how many times will you use it her Rose daily no problem seven times a week oh we'll see huh but it's still
data it's come from somewhere so so what has happened the way to think about this is to say that I
want to understand a certain something and the certain some certain something has to do with the
characteristics of customer uh customer characteristics and to do this you can then use either you can either take
let's say a marketing point of view who buys you can also take a product engineering kind of view what sells in
other words what kind of product should I make Etc in business as you probably know for those of you are
any of you entrepreneurs one hand up there one hand up the closet
entrepreneurs from what I could figure out right sometimes it's unclear what that word means in other words you think
you are or you're not confident enough to call yourself one or you're doing that uh in in it space if you're an
entrepreneur for example in um in in physical product space or even in software space one of the things you
often think about is What's called the product Market fit which is you're making
something how do you match between what you can make and what people will
buy because if you make something that people do not buy that doesn't make any sense on the other hand if you identify
what people buy and you can't make it that also doesn't make too much sense so the conclusions that we will
draw on this we will not draw on today but the purpose is to be able to go towards conclusions of that kind either
isolate products isolate customers and try and figure out what what they tell us pandas generally has a fair amount of
Statistics built into it that's what it was originally built for numai is something that was built
more for mathematical problems than anything else so some of the mathematical algorithms that are needed
are there there are other stat side plots in metal plot life or c Bor and many other things that you have seen
already um python is still figuring out how to arrange these libraries well enough uh the the shall we say the the
the programming bias sometimes shows through in the libraries so I for one do not remotely
know this well enough to know what to import up front but a good session you know what to import up front and you do
all this up front so you don't get stuck with what you want to do the naming is up to you if you like the names as they
are then that's fine you want a standard set of names so when you wrote the data set if
this is in the right path just this will work do CSV it's usually smart enough to convert
Excel forms into CSV in other words if you have this as excels and things like that it's usually
smart enough but if it isn't then just go in and save an XLS file as a CSV file and operate that way in case it doesn't
do it on its own but more often than not what you see is that when you when you when when
Jupiter sees it it'll see an any excels file as a CSV file or go and make the change
yourself or you can have other XLS other restatements in it as well you can change functions inside it and you can
figure out how much to head what this tells you is there's the head and the tail of the data this is simply to give
you a visualization of what the data is um this gives a sense of what
variables are available to it um what kinds of variables they are we'll do we'll see a little bit of a
summary after this Etc so for example some of these are numbers income what is
income income is annual household income that's a number sum for example let's say gender
m male female this is a categorical variable this is not entered as a number it's entered as a text field if
you are in Excel for example right at the Top If you go in and you see that it will tell you how many
distinct entries there are how many distinct settings there are so usually what happens right at the
beginning and a data frame like this if it is created this is a data frame if a data frame is created when it gets
created the software knows as to whether it is talking about a number or whether it is talking about
categories there are certain challenges to that you can see one particular challenge to
this um what does this 180 mean
counts why do you think there are so many decimal places that comes here 14 years of experience 16 years of
experience why is it going 0 that's yes it does this because it sees
other numbers where those decimal places are needed so what it does is what any
software typically does is when it sees data it sort of says that at what granularity do I need to store the
data sometimes this is driven by your computer your 64 bit your 32bit and things like
that but what it does is it means that the data is stored in the data frame to certain digits now usually you don't see
that you'll see it in this way but sometimes for example when you say include equal to or and and you ask for
a full description the data comes out in this slightly irritating way h because of something here because
of let's say the income field or any of that now when it recommends when it looks at the descriptions of this what
is the description that it is reporting and how does it choose to report out the description in this particular situation
so let's take a little bit of a closer look at this one thing
here look at the way it's done here so count unique top frequency and then there are certain things here mean
standard deviation minimum 25% 50% 75% and Max when it sees a variable like
gender it reports out lots and lots of n what does that tell you right off the bat it can't do that which means it's
not a number this is not a number in other words if you ask me to find the mean of
something and you're giving me male and female as inputs I don't know what to do which is an entirely reasonable stand
to take for any reasonable algorithm right it it requires another kind of description for it to
work but the problem we describe this syntax is that it's asking for the same description for all of them whether it's
in significant digits whether it's in columns etc etc so it's chosen this description and
it says that that's all that I'm going to give you but where it makes sense
let's say for example I look at age now for age I've got 180 observations and it is calculating
certain descriptions for it correct so what are the discriptions
that is calculating let's look at these is calculating a desription like say minimum minimum is what 18 maximum is 50
these are easy to understand then let's look at something really
interesting suppose I want to report one number one representative age for this data
set this is like asking the question how do I get a representative blood sugar number for
you I can give you a minimum and a maximum but to do the minimum the maximum I need to draw blood many many
times from you but let's suppose I want to this I want one representative age for you
somebody asks you what is your blood sugar you want to give them one number similarly somebody's looking at
this data and ask the question give me a representative age how old is your typical user or what age do you want to
build it for or you're even asking a you're even asking let's say a product question you're a product designer and a
product designer building a treadmill now how do you design a product those of you
Engineers based on based on the weight now very good what weight who's weight huh who's the
user what is the weight of the user he's got a good point as as a design engineer I need to know what weight will be on
that treadmill now what is the answer to that question Max us who visit the gym huh so
there's a question of saying that if I want to measure a variable by one number how should I even frame that
question what makes sense what is the one average no Max in this particular case
you might argue the max is the is the right number because I want to be able to
say if I can support him I can support anyone but there's also a downside to that I've now engineered that product I
You could argue that I shall shall I I say over engineered that product I'm sorry fact of safy a factory
of safety okay all right so let's suppose that you are you are doing this for a
mattress you all sleep on mattresses we're all relatively wealthy based on the fact that we're here so we probably
sleep on a mattress not everyone's fortunate enough to sleep on a mattress but let's suppose
you do sleep on a mattress how much weight should that mattress be designed to Bear if you over engineer it what
will happen happen is that number one for for for a reasonable weight let's say weight a lot below that that
mattress is not going to sink let's say that you design it for 100 kilos now if you have 50 kilos or 60
kilos that mattress is not going to sink for you because it's going to feel comfortable for someone who is 100 kilos
and for someone who's 50 kilos you're just going to bounce on it you're going to feel it soft
silkiness or whatever it is you want to feel from the mattress it won't work so what to
do that's a hard problem it's a description but it's a hard problem who do I Engineer
for and so therefore uh people have different ranges of what I mean to represent it so here's one version of it
this is what is called a fiveo summary I report out the minimum the 25% point the 50% point the 75 % point and
the maximum variable by variable I report five numbers I report the
lowest what does 25% mean 25% of my data set or the people are younger than
24 the youngest is 18 25% or a quarter of them are between 18 and
24 a quarter are between 2 24 and 26 a quarter between 26 and 33 and a quarter are between 33 and
50 this is what is known as a distribution this is what is known as a distribution statisticians love
distributions they capture the variability in the data and they do all kinds of things with it so I'm going to
draw typical shape of a distribution we'll we'll make more sense of it later on this is a theoretical
distribution distribution for example let's say has has a minimum has a
maximum has say 25% Point has a 50% point it say 75% point in terms of probabilities there's 25% here 25% here
25% here 25% here if you want to think in terms of pure description this is not a probability it's just a
proportion if you want to think in terms of probabilities what this means is that out of 180 out of 180 people if I draw
one person at random if I draw one person at random there's a 25% chance that that person's
weight is going to be below below 24 sorry age 24 correct if you want to
think in terms of probabilities we'll do that tomorrow but this is a
description so what this description does is it gives you an idea as to what value to use in which
situation so for example you could say that I'm going to use 20 26 as my representative
age if I do that what is the logic I'm using this this 25% this 50% point so to speak this is called the
median this is called the median and we'll see it median means the age of the average
person first s take the middle person and ask how old are
you the age of the average person I could also ask for the average age AG of the
person which is what which is the mean which is 1 / n X1 + xn now this is
algebra what you have to do is you have to put n equal to 180 this is the first age the second age
the third age up to 180 1 by 180 age
1 plus age 11 18 this is called the mean this value is what 28.7
n the average age is about 28 years or 28 and a half years 28.8 years but the age of the average person is 26 yes so
can you please repeat the median and the the difference between the two describe what is the age of the
person so I described the median as the age of the average person and I describe the mean as the
average age of a person now he's looking at me like saying you have to be kidding me right
that's confusing I admit to it the easy way to understand it could be this what is the
mean add them all up divide by how many there are what is the median sort them from the smallest to the largest pick
off the middle if they're an even number what do you do you take the average of the two
middle ones if they're the same it'll be the same number if they're not it'll be a number between
them so sometimes the median may show up with a 0. five or something like that for that reason if there is an ing
counts but there are an even number of counts now which do you think is better dep you're giving the right
answer it depends you'll figure out that I like that answer they both make sense they both
make sense it depends on what what context you're going to use it for in certain case yes you said that
Med basically the mean of the it's it's the it's the age of the average person it's a reading from the average person
so what is the parameter we are saying it is average person how we are getting that aage okay if you're talking in
terms of parameters so he used an interesting term he's saying what is the parameter I'm after parameter is an
interesting word parameter refers to something what generally in a population it's an unknown thing that I'm trying to
get after for example blood sugar is a parameter it exists but I don't know it I'm trying to get my
handle on it correct so if I'm thinking in terms of of of
parameters then these are different parameters so let's let's look at a distribution here I'm not sure whether
this will pick up things I hope so so the median is the is the median is a parameter such
that on this side I have 50% and on this side I have 50% this is the
median the mean is what is called the first moment what that means is think of this as a
plate of metal and I want to balance it on something where do I put my finger so
that it balances it is the CG of the data the center of gravity of the data
you can understand the difference between these two now if for example I push the data out to the right what
happens to the median nothing happens to the median because the 50/50 split Remains the Same but if I push the data
out to the right the mean will change it'll move to the right your lever the lever principle right if there's more
weight on one side I have to move my finger in order to counterbalance that weight so these are two different
parameters if the distribution for example is what is called symmetric symmetric means it looks the same on the
left as on the right then these two will equal because the idea of going half to the left and half to the right will be
the same as the idea of where do I balance because the left is equal to the right so when the mean is not equal to
the median that's a signal that the left is not equal to the right and when the mean is a little more
than the median it says that there is some data that has been pushed to the right
and that should be something that you can guess here because the mean and the median to some extent are what 24 26 Etc
the lowest is 18 that's about six 6 years 8 years less than that but what is the
maximum 50 that's 25 years beyond the data is pushed to the right a little bit instead of saying push to the right
the right technical term is Right skewed there are there are shall I say people are more not
average on the on the older side than on the younger side there was a hand up somewhere I was just confused with the
statement that Medan would not move but then you explain yes so so therefore one reason that the median often doesn't
move is because it is not that sensitive to outliers so let's suppose for example we
look at us us and we ask ourselves what is our mean income or median income and we have that each of us make a certain
amount of money we can sort that up and set and put that in now let's suppose that Mr mukes am money walks into the
room now what is going to happen to these numbers mean is going to go up right he
alone probably makes a very large multiple of all our incomes put together possibly I don't know how much you make
I know how much I make but what's going to happen to the median it's going to stay almost almost
the same the typical person may move by at most half because what is the typical person
going to be the typical person is going to be an actual individual in the room or maybe an average of two individuals
in the room and that person is not going to change
yes yes that's that's one conclusion we can draw draw on this there are other plots below which will also show the
same thing you're not being able to draw that conclusion good logical reason I haven't shown you the full data we'll
see the histogram we'll do that so hold on to that question the conclusion was drawn is
that there are two pieces there are two things to do see here one is if I simply look at this without seeing any more
Graphics where is the middle of the data from a median perspective at 26 correct now from 26 look at the
difference between 26 and the smallest 18 between 18 and 26 that's 8 years this 8 years contains 90
observations because there's 180 total now what is on the opposite side of this 26 to 50 that's how many years 24 24 24
years this 24 years now contains how many observations same 90 so there are 90 observations that are
between 18 and 26 and there are 90 observations between 26 and 50 so if I were to draw a picture
what would what would that picture look like yes exactly as you're drawing it right we can say on left this usually by
definition is called right skewed this is a problem that bab has does this mean it's left skewed or right
skewed as a word right it's called right skewed more data to the right sorry more data is a dangerous
word huh no that's it's the same number of observations I'll say the data is pushed to the
right more variation or right more variation on the right side is probably a safer way of putting it yes so
skewness is often measured in various things one measure of skewness is typically for example mean minus median
mean minus median if it is positive it usually corresponds ress mean minus median negative usually
corresponds to left skewness this is a statistic iCal rule but sometimes it is used as a definition
for skewness there are many definitions for skewness skewed data sometimes causes
difficulties in analysis because what happens is the idea of variation changes being variation on one side
means something really different than variation from the other side um by the way um what's happening to you with
respect to things like books are you getting books are you not getting books are you have no idea what the books
are you got one book which is what which is the statistics book okay I'll take a look at that book later so
this book right okay show me the book okay comment one very nice book comment
two not a python book right that doesn't make it a bad book so if you're looking for help on
how to code things up this is not the right book get a book like think stats or
something like that but if you want to understand the statistics side to it it's an excellent
book so everything that I'm talking about is going to be here I might talk about which chapters and things like
that at some point and I might talk about how to use this in the book so for example at the
back of this book there are lots in there are tables there are tables at the back of
this book which we'll learn how to use and then I'll try to convince you that you shouldn't use them
but remember many of these methods are done in ways in which either you don't have access to
computers or if you do have access to computers you don't have them shall we say at
runtime in other words when I want to run the application on it I can build a model using a computer but I can't run
it within one the runtime environment for statistics is often done when there are
no computers around the build environment can include computers but the runtime environment
cannot a lot of Statistics is done under that kind of situation even
probability yes very much so very much so okay so definitions of skewness and things like that do it do it in the way
you usually use a book which means you go to the index and see if the word is there and then you go back and figure it
out and it'll give you some ideas as to how that works it's it's a nice book it's one of the best best books that you
have in business statistics but it's not necessarily a book that will tell you how to code things up that is not a
deficiency of the book not every book can do things of that sort there are other books around that will tell you
how to quote things up but will not explain what you are doing it's important to know what you are doing
it's also important to know why you're doing it but books can't be written with often
everything in mind yes can you suggest some book that which tell us how we can think that way the thinking is here I
think this is good for thinking I I would absolutely recommend this book on the thinking side because the problem is
lies that in which situation what we need to yes and that answer I think is very very good here where you won't get
is it'll say do this and it won't give you the python syntax to do it that that will not be here so if you can solve
that problem through some other means I used to have a colleague in in corporate life who had a very big
sticker on his board it said Google search is not research right now nobody agrees with
him anymore so I suppose that when in doubt you do what normal Homo sapiens do today
which is you Google for an answer so one possibility is that you ex you you you understand something from a
book such as this and if you want to understand the syntax just Google for the term say python that term whatever
it'll probably give you the code things are very well organized these days uh there's also the question and I
should give you a very slight warning here not to not to discourage you from anything but in the next 9 months or
thereabouts the the duration of your program there's going to be a fair amount of material that will be thrown
at you correct the look and feel will sometimes be like what we would what we
would often call it MIT as drinking from a fire horse you can if you want
to but you'll get very wet so therefore pick your battle if you want to understand the statistic side of
it please please go into the depth of it but if you try to get into equal depth on every topic that you want to learn
that will take up a lot of your professional time now the reason we do the statistics
for first one it's it's a little easier from a computational perspective although harder from a conceptual
perspective so we begin it this way but hold on to that idea and then as you keep going know see if this is something
that you want to learn more on and if you can you're welcome just write to us or let us know or let anyone know that
is just coming let her know and we'll get the references to you but if you want to for say for the first few
residencies please read the book and see what happens if there are doubts yes but it's it's a well-written book it's in
it's it's instructor is one of our colleagues here you know if you want we can also help explain
things so this is the summary what did the summary tell you the summary gave you
what's called the five numbers five numbers that help you describe the data minimum 25 50 75 Max we'll see another
graphical description of this it also described for you a mean there is also another number here and this is this
number is indicated by the letters STD STD refers to standard deviation SD refers to
standard deviation and what is the formula for a standard
deviation STD is equal to the square root of
little bit of a mess but Two Steps step one calculate the
average step two take the distance from the average for every observation ask the question how far is
every data point from The Middle if it is very far from the middle say that the deviation is more if it is
not far from the middle say that the deviation is less deviation being used as a synonym for variation I'm talking
about variation variation can be more or variation can be less more than the average less than the
average if someone is much older than average there's variation if someone is much younger than average there is
variation so therefore both of these are variation so what I do is when I take the difference from the average I Square
it so more than xar becomes positive less than xar also becomes positive then I add it up and I average
it there's a small question as to why it is n minus one and that is because I'm I'm Divi I'm taking a difference from an
observation that is already taken from the data now if I've squared when I have
squared my original unit was in age when I have squared this has become age
squared so I take the square root in order to get my measure back into the scale of years so the standard deviation
is a measure of how spread a typical observation is from the average it is a standard deviation where
a deviation is how far from the average you are and because of this squaring you
need to work with a square root in in in sort of modern machine learning people sometimes use something
called a mean absolute deviation mad mad very optimistically called so what mad is is if you don't
take a square you take an absolute value and then you do not have a square root outside
it and that is sometimes used as a measure of how much variability there
is so why it is squ why is it why we do just we Square it because we want to look at both positive and negative
deviations if I didn't Square it what would happen is it would cancel out what was the word that one of you used
neutralize right I love that term your positive deviations would neutralize your negative
[Music] deviations yes seen the posi and thetive this
number is going to be positive if say X1 one so let's look at the first number here so if I look at the head command
here when I did the head command here what did the what did the head command give me the first few observations now
this is an 18yearold this probably sorted by H this is an 18y old correct now I'm try I'm
trying to explain the variability of this data with respect to this 18y old what is the what is the what why is
there variation this 18 number is not the same as 28 and 18 is less than 28 so what what I want to do is I want to go
18 minus 28.7 what I'm interested in is this
10 this 10e difference between the two now the person the oldest person in this data set is how old 50 when I get
to that row this 50 will also differ from this 28 by 22 years so I'm interested in that 10 and
I'm interested in the 22 I'm not interested in the minus - 10 or a minus
22 we can I can do that I can do that in other words what I can do is I can look at I can represent 18 - 28 as 10 and I
can represent 28 - 50 as 22 and that is this as I said 1 / n -1 absolute X1 - xar plus plus absolute xn - xar that is
this with n minus one and this is done as I'm saying this is what is called mean absolute
deviation and many machine learning algorithms use this you are correct in today's
world this is simpler now when standard deviations came up first this was actually a little
harder but people did argue about this I think well 150 maybe more abouts I forget my history that much there were
two famous mathematicians one named ga and one name llas who argued as to whether to use
this or whether to use this laas said you should use this and gaus said you should use now the reason
gaus won was simply because gaus found it easier to do calculations why is this easier to
calculate with because Newton had come up with Calculus you know a century or so before
that and so for example let's that you want to minimize variability which is a which is some something that we often
need to do in analytics which means you need to minimize things with standard deviation which means you need to
differentiate this function the the square function is differentiable you can minimize it using calculus this is
not so therefore what happened was gaus could do calculations but laas could not and laas
lost and gaus won the definition of the standard deviation we haven't much used 25% or 75 so as in
as in okay why do we not do that so today this entire argument makes no
sense because today how do we minimize anything our computer program you don't use any
calculus you ask you run fmen or something of that sort you basically run a program to do it
so therefore this argument that's you can both do calculations equally well with this as in as in that so today what
is happening is that lass's way of thinking is being used more and more this one is a lot less sensitive to
outliers this one what it does is if it is far away the 22 squares to 484 or something like that which is a large
number so the standard deviation is is is often driven by very large deviances larger the devian the more it blows
up and so therefore this is often very criticized if you read for example the finance literature there's a guy called
Talib Nasim Talib he writes his book called the black Swann and Fool by Randomness where he left and right
criticized the standard deviation as a measure of anything so today this argument doesn't
make a great deal of sense and when in practice something like this makes sense it's often
used so a lot of this is done historically it it looks this way because of a certain um
historical definition and then it's not it's hard to change so today in in you know centuries
after gaus sad people like me are trying to explain it having trouble doing it because there's a logic to it right I
mean and that logic doesn't hold at all anymore now yes in simple terms is that 18 how far generally is that from the
medum how far how far on the average is an observation from the average confusing statement again he's
going to be unhappy but how far on the average is an observation from the average if that
answer is zero that means everything is at the average but you asking the question how
far from the average is it is an observation on the average if I take your blood pressure how far from your
average blood pressure is this reading if this is exactly equal then I don't need to worry about variability
every time I measure blood pressure I'll see the same thing what is your average bank balance
don't tell me that but but but you know what I mean right you have an average bank
balance your your bank account manager or your bank actually tracks this what your average bank balance
is but you're not actually your B balance is almost never or very very rarely equal to your actual average bank
balance it's more and it's less how much more how much less is something that the bank is also
interested in in order to try and figure out you know how much of your money so to speak to get out
there because the bank is going to make money by lending it out correct but when it lends it out it can't give it to
you so it makes an assessment as to how much money it's I don't want to get into Finance now but you get the drift
H so therefore then it is a measure of that it is not the only measure of that so
for example here's another measure so you remember this 25 number and the 75 number that you're asking about let's
say that I calculate a number that looks like this let's say 33
minus let's say 33 is a 75% Point minus 24 so 33 - 24 let's say this is my 24 and this is my 33 between this how much
data lies 50% why because this is 25% and this is
25% this now contains 50% this is sometimes called the inter quartile range inter quartile range big word
right now why is it called an inter quartile range the reason is because sometimes this is called Q3 and this is
called q1 Q3 stands for upper quartile you can understand quartile quarter so upper
quarter and this is the lower quartile and the difference between the upper quartile and the lower quartile is
sometimes called the inter quartile why is it called the range because what is the actual range of the data the range
of the data in this particular case is 50 minus 18 and 50us 18 which is your max minus
your Min this is simp sometimes simply called the range range is maximum minus minimum
inter quartile range is upper quartile minus lower quartile and these measures are
used they do see certain uses based on certain applications you can see certain
advantages to this for example let's suppose that I calculate my five point summary with my five point summary I can
now give you a measure of location which is my median and I can give you two measures
of dispersion which is my interquartile range and my range so those five five numbers have
now been Twisted to give me a summary number which is the
median and a range number interestingly I can also draw mental conclusions from that for example
I can draw conclusions from these five numbers in the following way 24 and 33 half my customers are between 22 and
24 and 33 so if I want to deal with half my
customers I need to be able to deal with a range of about 9 years within this 9 years is all that I'm interested to get
this right so if I'm building my if I'm building my my my machine I'm going to make sure let's say that the 33y old is
okay with this and the 24 year old is okay with this will the 50-year-old be okay with
this no may not be but if I want to make the 50-year-old okay with this I'll have trouble with
the 18-year-old so I can do a lot with even these five
numbers we'll see more descriptive statistics as we go along by the way this is only for age I
can do this for you know usage I can do this for Fitness I can do this for income I can do this for Miles income is
interesting here's the median income $50,000 and the mean income about $53,000 if you see income in almost all
real cases the mean income is going to be more than the median income the per capita income of India is
more than the income of the typical Indian see what does this command do if I say my data. info what this is doing
is my data first of all is a data frame that I created just to review I read the PDF file this way now this is a
describe and this here is info now describe and info in the English language are similar things description
and information and this is interpreted in the software is two completely different
things information is like your variable setting it's like your integer field your real field it's setting like that
it's giving you information on the data as data the word data means different
things to different people to a statistician data means what to a statistician data means a
number to an IT professional what does data mean bytes information you know I've
lost my data I don't particularly care what the data is I've lost my data so this is that information it tells you
tells you about the data it's an object it's a description it's a 64-bit stored integer it's an object so it tells you
about numeric categorical it tells you about the kind of data that's available nonnull fields
in other words there are objects in the field Etc there are so many integer types
which are stored at 64 because this computer is probably capable at 64 and there are three categorical
variables this is a this is shall we say a data object summary of the of what is there in that data frame not a
statistical summary useful in its own way particularly if you're processing it
and storing it for those of you who are going to go into Data um sort of curation like carers this kind of a
database is a nightmare because typically what happens is when you store real data you in in
addition to data you often store what's called a data dictionary sometimes that's referred to
as metadata data about the data because simply storing a bunch of numbers is not enough you have to say what the numbers
are about this adds a layer of complexity to the metadata you now have to store not only what the varable is
about but what kind of a variable it is so many professional organizations say is that archival data should never be a
mixture of both numerical and categorical objects and they pay a price for that numerical things should become
categorical or categorical Things become numerical but what happens is if you are storing large volumes of It And
archiving it and making it available for people who have not seen it before it sometimes gets convenient so therefore
fees like this are often useful to see how big a problem you have right now I want to plot a few things to
plot you can plot anything Sion I think is coming a little later but this
plot this is from M plot library and it is plotting through a command called
hist hist means histogram which you've already seen you've covered his histograms right
I think we seen histograms so this is a histogram now histogram as a syntax has bin sizes and figure
sizes so what you can do is you can play around with these and see the differences in what this histogram does
but there's a certain default that shows up and that default is quite good and here is a histogram distribution of the
age this is not a set of numbers this is a picture this is a picture what does this
picture have this picture has a set of bins and it has a set of counts within each
bins between these two numbers between say 10 and whatever this is let's say 22 or thereabouts I have a count of let's
say 17 so it gives a count and it does this by getting a sense of how many bins
there are and plotting this shape it's a little bit of an arc to write a histogram
program there there's a there's a python book out there I think things chatter one of it in which sort of the first
onethird of the book is basically how to write a histogram code It's a Wonderful book but because it treats this example
it got terrible reviews reviewer said why do I want to learn how to code a
histogram and the book's author is I'm teaching you how to write a code a histogram is an is an example of how to
do that and I tend to agree if you want to test yourself of your understanding of data and your understanding of any
programming language and any visualization language quote a histogram in
it and have fun so so it's it's a nice Challenge from many perspectives the data
challenge the language challenge the visualization challenge all of that yes so you said Aral data should be
numerical many companies do that that they that they want archival dat data to be have only one data form only one
format why is that so because as I said when you store data how do you store it let's say that you've generated an
analysis the analysis is done correct and you've decided not to destroy the data you're going to keep the data in
your company's databases or in your own database how will you keep it you can take a technology let's let's let's pick
an example let's say what's pick an example SQL Excel whatever let's say Excel let's say I keep it in Excel now
if I keep it in Excel what will I now do so let's say I have an Excel spreadsheet let's say my cardio data set let's say
this data set now in addition to the data what do I need to store with it
information yes metadata how do I store that metadata yes so one possibility is I can have a text file like that like I
had at the top of this describing all of this which is typically what happens in Excel storage it describes this and it
describes there's one file calledd and another file called descript or something of that sort which basically
describes the variables and the idea is that they have the same name and one extension gives you the data the other
extension gives you the description of the variables that are in this data correct now this is good now what's
going to happen on that data certain code has been run that code is going to assume certain
things about the data what do you want that code to assume about that
data whatever you want that code to assume about that data should be available in the data
dictionary now if that code is stable enough to realize that whatever Fields you give me I will run on that's cool
but if that Cod requires you to know what kind of data is being used let's say discrete data let's say continuous
data in the future you'll be doing things like linear regression logistic regression linear regression will make
sense if the variable is a number logistic regression will make sense if the variable is a zero or a
one if you have that problem now in the metadata you need to be able to tell not only what business information this
variable contains but also what kind of a computational object it is so the code can
run so therefore what people often say is that I'm going to make it very simple and I'm going to assume that my entire
data frame consists of only one kind of variable so that when I run any algorithm on it I know EX ly what kind
of data input that algorithm is going to get but I'm saying it's a practical answer that many companies often often
have and I've worked in a couple of companies at at least one company where this was very seriously done so we had
to we had to when we put data back in we had to convert it and for in the situation that I was in it wanted
everything in categories so what we would do is we would take continuous data and we would do what's called Fine
classing which means that we would divide not into four pieces but into 10 pieces desile one desile 2 desile 3
desile 4 up to desile 1 and every variable was stored now not in its original numbers but as 10 9 8 7654321
so let's suppose that I tell his income is n what that means is I know he's in the ninth
desde 10% of the people or more have income more than him 80% have less than him he's in that bracket and all
variables were stored that way now what happens is every algorithm knows that every variable is going to be stored
that way and you can keep writing algorithms that way otherwise what would have to
happen is every algorithm will need to be differently and let's say you're doing credit scoring let's say you're
doing CRM models you're doing something of this sort and youve built a very sophisticated CRM model that tracks your
customers and it works now suddenly you've got a new variable coming in the Twitter
feed and suddenly nothing works what to do go back and rebuild that entire model
that's going to set you back 3 4 months that's going to set you back a few thousand so you say no any variable that
has to go in has to go in in this form and if it goes into this form my algorithm can deal with it so when in
such case it might not affect the I mean the efficiency of the model that we generate yes yes and in practice I'm
going far away from topic now in practice an profession analyst has to struggle between doing the right thing
badly and the wrong thing well you want to do the right thing well but the right thing well is going to
cost you time money data and everything so you struggle between saying
that I'm going to get a flawed model quickly built on a new data set or I'm going to get an inefficient answer on a
Model that's already been built and let's see how far it goes and so these are more cultural
issues with how an an analytical solution is often deployed in companies they vary very much from industri to
Industry they vary very much from um company to company from the culture of a company to a culture of company they
depend on regulatory environments in certain environments an auditor like entity comes in and insists on seeing
your data show me your data let's say in finances is sometimes happening regulat agency let's say Reserve Bank of India
goes into a bank and says show me your data all this npas Etc show me your order book show me your loan
book correct and now that has to be done and the decisions you made have to be done in a way that is patently clear why
you have done this so very often people say I don't want to make the best risk decision I want to make the most obvious
risk decision which may not be the same thing at
all but I'm being audited so that's a practical question and and I
don't have a clean answer to that but I do know what happens is it
right no it's not
but we live in a world that has that kind of imperfection my one of my teachers his name was Jerry Friedman
you'll see some of his work later on he came up with algorithms like projection Pursuit cart Mars gradient boosting he
created many of the algorithms that you'll be studying one of my teachers at Stanford when he ran our Consulting
classes he would say this solve the problem assuming you had an infinitely smart client and an infinitely fast
computer after you've done that solve the real problem when you do not have an
infinitely smart client and you do not have an infinitely fast computer this was in the early 1990s where computer
speeds were a lot slower and we didn't have powerful machines like this
around so a lot of this is done in in that kind of situation where where you are uh where you struggling for
continuity when you're figuring it out imagine yourself as an analytics manager and I hope many of you will be and you
have an analytics team sitting in front of you correct you're looking at them and you're looking at them in the eye
and you know how much you're paying them and you know that half of them are going to leave at the end of the year
what are you going to do with regard to the modeling and things like that your first order of business is
going to be to ensure continuity in some form keep it simple right keep it simple keep it obvious for
the next bunch of people who are going to come in and for that you'd be willing to trade a little bit of make it
right so now the new person coming in will now not want to solve a very complicated kind of situation this is
not where you want to be but and I do not want to depress you on day one but it's also the fun part of the profession
right it's also what makes it interesting and sort of interesting and exciting right it's not all bad okay
so the histogram command summaries of what these histograms are and each gives you a sense of what the distribution is
and as you can see from most of these pictures most of these variables when they do have a skew tend to have a right
skew maybe education has a little bit of a left skew maybe education a little bit of a
left CU that a few people are educated and most people are here but even [Music]
so right now here's an interesting plot um mro life has this as well but seor
has a better version of it this is what's called a box plot you've seen a box plot
there's a box plot um people are unsure as to where this box came
from because there's a transtion called box who's used this before but this box came from it used to be called a box and
whisker plot these are the whiskers this whisker will go this is this is the
median this is the upper quartile the top edge of the Box the bottom edge of the box is the
lower quartile the end of the whisker is 1.5 times the interquartile
range above the box right if you want a formula s of the whisker the length of
the whisker is 1.5 * IQR should I have a break now a little
bit maybe huh so we okay 345 whatever we'll go after there
Le yeah I haven't stopped I just got distracted so 1.5 *
the if so it goes up to that if a point lies outside it the point is shown outside
it if the data ends before it the whisker also ends
correct what is the whisker okay what is the whisker all right let me explain another
way the whisker is the maximum the top of the whisker is the maximum the bottom of the whisker is the
minimum okay not okay okay some of the points are outside
so this point here now what is this plot here age for males so what this means is this is the minimum 18 or whatever it is
and this is the maximum 48 or whatever it is minimum the maximum so if you see nothing else on the box plot no other
points other than just the box and the whisker then your five point summary is sitting
there that's it right now what happens if you see points like this outliers what is an outlier an
outlier is a point that lies more than 1.5 times the interquartile range above the box so this whisker will not extend
indefinitely it'll go up to 1.5 times this box and then it'll stop and if any
points are still left outside it it'll show them as dots you can treat this as a definition
for what an outlier is same thing same thing in the other direction
the logic is symmetric no no that means this it hasn't it's the data is ended here the
data the data is ended here is was there any other number tried instead of 1. I suppose so and you can change it you can
I won't try it now but you can go to the box plus syntax and change that so you can go to boxplot syntax and you
can change that 1.5 it's not hardcoded into the algorithm I'm I'm I'm I think 95% sure
as statistician I'm never sure about anything but but I but but it's it's it's a parameter in
the in in in the uh you should be able to pass the parameter in the Box function default is
1.5 you should be able to change it and what's the color part that's the medi which one the color
coloror oh no these these two colors these two colors are because I've asked for two
things I've asked for male and feale if I if I had three of them that's okay but how
the the oh this this one here oh this is Q3 the lower is Q3 and the upper is sorry lower is q1 and the upper is Q3 so
this qu qu range so so for males between the bottom bottom whisker to the end of the box is a quarter of your data the
box is half your data and the top of the box to the end of the whisker is quarter of your
data so the middle line is the middle line is the median the middle line is the median
there is also function inbox plot you can play with where it'll give you a DOT and that dot is the a
mean I mean you can you can you can ask boxplot to do that but but a mean is not a general standard component in the
fiveo summary it's a different calculation not a
sort but if you want to you can make box plot to give a DOT on the mean as well by
definition yes so so mean Medan so half the data is between um 24 and 34 or whatever that
is half of all my all the men in my sample are between those two numbers I think box plot doesn't allow
you to change the shape of the box I think that is set that's sort of central to the idea
of a box plot it does allow you to fiddle with the size of the whisker but I don't think it allows you to fiddle
with the size of a box in other words if you change that to something else let's say the 20% point to the 80% Point 80/20
rule that's no longer a box plot it's another interesting plot the significance of it is exactly this as we
had seen before the significance of it is is that the data looks like this it's right
skewed think of the picture so this is your q1 and this is your Q3 this is your Q2 or the median then the median is
going to be closer to q1 than it is to Q3 in the same way that the minimum will be closer to the median than the maximum
same idea this is a summarization for numbers if you were to summarize for categorical
data what's called a cross tab or a cross tabulation this is simply how many
products are there product category 195 498 and 798 they've got three kinds of treadmills and
they're trying to understand which who was using what kind of treadmill our business problem is to understand who
was using what products this is a cross stab what is this this is something that will be used for categorical variables
no box plot will make sense here there are no numbers so now you can ask interesting
questions here if you want to and you can think about how to answer it is that for example you can ask a question is
there a difference between the preferences of men and women
possibly is there a difference in the products that they that irrespective of gender is there a
product that that they prefer you can ask all kinds of interesting questions and you can find
ways to answer it which we will do not in this residency but next time around for those we can ciz it also categorize
for those preferences so this is simply once again this is descriptive all this has done is it has
simply told you the data as it is what I'm saying is that if for this if you want to do a little more analysis
on it you now have to reach a conclusion based on it so for example one conclusion to ask
is is that is that do men and women have the same preferences when it comes to the fitness product they
use now that's a question to answer that question it's enough to look at the data but just looking at it will not give me
the answer I need to be able to find a statistic to figure that out a statistic that does what that in some way measures
that difference let's say measures the difference between men and women or what
we will do is not measure that what we'll do is we'll measure that if there was no difference between men and women
what should this table have looked like and then we'll compare the difference
between these counts and that table but that's the interesting part of a statistical statistic which we'll do
that's called a k Square test it's coming up in the next residency but that's the prediction part or the
inference part of this description this is just the description you can do a similar thing
here this for example is for um marital status and product what product you
use are you not very dependent whether you're partnered or sing what is marital prodct maybe it has to do with age or
maybe they're correlated should you use one as opposed to the other
okay right you can use counts as well if you see instead instead of instead of doing it this way instead of seeing it
as a table if you want to see it as a plot you can ask for counts so there are things like count plots and bar
plots which allow you to do counts in the lab you'll do probably a few more of these this is simply another
visualization of the same thing uh for those of you who like things like pivot tables in
Excel h of Microsoft has made you know wonders of us
all in corporate life they were I was told that you know you can have um you can have a master's in in in Bachelor
master in anything engineering is good Etc and it's nice if you have if you have you know phds in a few areas but
what you really need is a PhD in PowerPoint engineering I mean that's a necessary
qualification for Success so certain tools have been used so therefore those tools have been
implemented in many of these softwares as well this is the pivot table version of the same data set this is the last
sort of not last but still this this is a this is a plot uh let me show you this plot and then we'll end or we'll take a
break this is a plot that is a very popular plot because it is a very lazy plot this plot requires extremely little
thinking pair plot of a data frame right you don't care what the variables
are you're telling it nothing about the plots You're simply saying figure out a way to plot them Pair by
pair and it does that so for example how would you read this plot on this side so it creates a
matrix the rows are a variable and the columns are variables what is
this this is age versus age age versus age makes no sense so what it plots there is a histogram of age
doesn't like the Gap nature abols the vacuum I suppose python does as well so it now
plotter what it should have plot is age versus age you're right it should have been a 45° line H but a 45° line is a
useless graphic particularly if the same 45° line shows up in the diagonals so to make a more interesting
graphic it plots the histogram there this analysis this kind of analysis sometimes
has a name associated with it the name is univariate univariate means I'm looking
at it variable by variable one variable at a time when I'm looking at age I'm only looking at age it's called
univariate analysis it's just a word uni as in uniform same form unicycle cycle with
one wheel things like that univ variant huh unit but for the other set of data also replicate the same kind of pattern
if I'm going to give other set of data another set of data it'll replicate the same it'll replicate the same nature of
the data there'll be histogram here again so yes so what it will do is remember that this
graph the nature of the graph so let's let's see this right so where is gender
here where is gender here is it
there is gender is gender in my data it is there so when I did past plot my
data what did it do with gender yes remember in info when we did info here
remember how it has stored the data no not any here so it had product gender and
marital status it had identified as objects in the data frame when it had formed the data
frame so now what does it tell you about the about the command the pair plot
command only yes it will it will ignore those objects so in answer to your question if
the data frame has been stored has been captured with integer 64 basically integers or numerics in it it will
plot if it's only objects he'll probably give a null plot yeah how
say again AG is why like that this is the histogram this is the same plot this plot is the
same as which plot this one it's the same as this one
here age no this is not age versus age this is just age age versus age would have been a 45°
line but it's not plotting that it's not plotting that in the diagonal it is not plotting age versus
age in the diagonal it is simply plotting AG's own distribution yes with the count so what
it is doing is it is essentially running hist on age all each observation and putting it on the diagonal yes what
can 20 again there is a b there is a bin what can
that from each bin it's a count count of people in that age it's a count of the number of people
who are in that age group here this is age no this miles this is
age this is age so say let's say between here between uh let's say say 40.5 and 43.5 whatever these numbers are
there are three people it's a remember the histogram is a visual thing you can datamine a histogram if you want to
which means you can se you can find out what those are and you can see it inside inside histogram just ask for a summary
of that it'll give you what the features are of that histogram but the histogram is not meant to be used that way it's
meant to be used as a as an optical device to see the shape to see the count it's an art to do a
histogram if you change the bins a little bit the histogram will look a little
different so I would suggest that unless you've got a lot of experience in this or you really enjoy the programming do
not fiddle with the histogram it shape will change I'll show you a little later
after the break not change the histogram but what shape is no not not in default you can go in
and change it on size but the bin width Etc the binwidth of histogram takes a little more to
change right so you can there's stuff out here you can find other things in which you can play
this so there are ways to do it okay so quickly ending we're losing our
food so these different plots and we'll continue after the break the rest of it is simply an X versus y so for example
this is age versus education this is age versus education
so the second graph from the first one is just rotated yes he's right if this is education on the Y AIS and age on the
x-axis or vice versa then these two plots one and two and two and one are just mirrored images of each
other a mirror image rot you right depends on where you look where you put the mirror but
yes mirrors so I remember when I was a when I was a kid mirrors would confuse me so I would ask a question like this
that when I see a mirror left and right gets switched but top and bottom don't I never understood
why you know huh due to gravity you can think I mean left and right gets switched but
top and bottom don't I thought it was something to do with a mirror and then I thought it was something to do with my
eyes you know maybe because they left so I looked at it this way and that didn't help so yes it's an important point when
you do symmetry it's a good catch it's a good catch to realize that there aren't so many plots there actually only half
as many plots because the plot on this side of histograms and the plot on the opposite side of histograms are the same
there was another question that one of you asked is that many of these seem to look like rows and columns
in the sense that what are these rows now what does this row look what does this mean it means that this variable
Fitness this variable Fitness actually has very few numbers in it it has a number 1 2 3 4 and five now
why is that because remember how I Define Fitness it's my perception of whether I was fit or not in my original
definition of the variable here you go self-rated and fitness and one to five scale where one is in poor
shape and five is in excellent shape this was the created data so in this data set I now have that this variable
in it these kinds of variables sometimes cause difficulty in the sense that there
are some there's a word for it these are sometimes called ordinal variables so sometimes data is looked at sort of you
know numerical and categorical and categorical is sometime
called nominal and ordinal nominal
means it's a name name of a person North Southeast and West gender male female Place Etc
it's a variable essentially it's a name ordinal is it's also categorical but there is a sense of
order there is a of order dissatisfied very dissatisfied so there's an order order therefore
ordinal this variable the fitness variable can if you wish be treated as an ordinal categorical
variable so for example the liquor scale is that so the seven point scale not satisfied very dissatisfied dissatisfied
moderately dissatisfied neutral sat moderately satisfied satisfied very satisfied mark one this generates a data
from a scale of say 1 to 7 or 0 to 6 so it'll show up in your database as a number like for example here you can say
instead of 1 to5 very unfit moderately unfit
okay relatively fit very fit instead of giving one to five give it that way and you code it up this way your choice so
sometimes when you have data that looks like this the data the python or any database
will recognize it as a number because you've entered it as a number but you analyze it as if it is a
category so the opposite problem also sometimes exists in that sometimes you get to see a categorical variable show
up as a number but you know it's a categorical variable a zip code is an example a zip code shows up as a number
but it's obviously not you can't add up zip codes
right you take two places in Bangalore and you want to find a place between them that's not the average of the zip
codes it might be close but you can't do arithmetic with zip codes the other difficulty with zip codes is that they
can be many of them which means that as your data set grows the number of zip codes also grows
so the number of values that a variable can take grows with the data and this sometimes causes a difficulty because
what happens is that in the statement of the definition of the variable you now cannot State how many categories there
will be present so you know that there will be more zip codes coming you just don't
know how many more zip codes will be coming but you also know it's a categorical variable so you can't treat
it like a number and so there are some special types of you know problems like zip codes that require special types of
solutions so the plot itself is a very very computational plot if it recognizes it as a number it plots
it if you don't want to make it plot as a number change it to a character most softwares including python will allow
you to do that now this is in some way a graphical representation of it for the for the end
of this session we can talk a little bit about the numbers associated with it so here for example my data age you can
also go you know do age if you want to and things like that this is the
mean um 27. 7888 is the mean so you can extract it there are functionalities of the mean that can be that can be
recovered like trimming etc etc that if you want to you can calculate the standard deviation you remember the
standard deviation formula that strange formula that I wrote on the board this is the standard deviation formula if you
want to calculate the standard deviation you can do this for other variables as
well this is an interesting plot so I don't want to go too far into this plot but it's an interesting plot
right in seon there's a warning on the code this is called or what they're
referring to is a distribution plot so this is a plot that tries to look at not what the data
is but what the distribution is so remember I was drawing these odd pictures pictures like this and drawing
lines on it those were distributions so what he trying to do is it's trying to go after the distribution
of the data now what does this mean it means that it says this it says that there is
an underlying distribution of the age variable this distribution is a distribution you do
not know however you have a sample from that distribution how big a
sample about 180 observations from that sample of 180 can you guess at what that
distribution is in other words can you give me a curve it's an answer to that
problem and it gives a curve why is the raw data not enough so the raw data is not enough
then this goes to the heart of what the statistical problem is is because I am interested not in the
age of this particular group of people I'm interested in the corresponding age of another very
similar group of people why what is the problem I'm trying to solve I'm trying to solve the problem of
who is buying my cardiac equipment now when are these people going to buy my cardiac
equipment at some point in time okay now what is my data but for whom is this data who have
I got the data for people already right people have already bought so I have a problem my
problem is I want to reach a conclusion about my future customers based on my old
customers how to do this what mathematical logic allows me to say something about the
future based on the past yes in short the way to do this is to assume that there is what is called a
population we'll talk more later at this stage to assume a distribution to assume that there is a
distribution from this distribution I have seen a sample today from this distribution I'll
see a sample tomorrow the people are not the same because the people who are going to
use my cardiac experiment cardiac equipment yesterday are not what going to use it next year if it was a same I
never have a growing business there's no point analyzing data of customers unless I want them to buy
more things or I have new customers coming in so what is common between my observed
set of data and the data for my new customers that commonality is what you can think of as a
distribution so he says that from from this can you give me a sense of what this distribution is and from this
distribution I can think of other people coming so what we'll do tomorrow is
we'll talk about a few distributions certain few specific distributions and how to do calculations in the
distributions for now what this graphic does is it simply calculates that distribution for
you I'll explain very very briefly how it does that won't go into too many details what it does is it takes the
averages of points yes so you mean that for a sample distribution cannot be
done I'm saying that for a sample why so why is not the sample the distribution
itself why am I not saying it's a good question why am I not saying ignore the curve why am I not saying that the
original histogram which I've seen three or four times before why is that itself not the
distribution that's similar to the following question let's suppose that you have done a blood pressure test and
you've gotten a few measurements you've been tested twice today let's say prear you know before
breakast after breakfast next week also you have done this let's say you have done this for whatever be your reason
youve done this say once a week for a month so now you got four readings no not four read eight readings
now these eight readings is that the distribution no you
have yes so there's something something that says yes if I want to understand what my blood sugar is and what it will
be going forward if I do not get treated then certainly there's a relationship between this and what will happen in the
future for example if I behave exactly the same way if I eat exactly the same way or I exercise or not exact exercise
exact exactly the same way if I smoke if my lifestyle is exactly the same as it is I would expect my readings to be the
same but what about it is going to be the same and what about it is different I don't quite know yes it is true that
those eight numbers are a representation of the distribution but they're not the
distribution itself if they were the distribution itself I would be forced to say that in the next month I would have
exactly these eight readings but I know that's not true but I also know that from these eight
readings I can say something about what will happen next month it's not that there's useless
information there so if my readings this month for example are let's say 110 120 115 125
let's say good health 130 Etc I know these these are my readings I know with some idea perhaps that that if things
become remain the same next month they will not start becoming 22 20 210 215 230 they will not become
that how do I know that because I have this readings this month so the idea of a distribution is
to be able to abstract away from the data the the random part and the systematic part and the systematic part
is what remains as the distribution around it there's going to be a random variation and that random variation is
going to exist from data set to data set like this month and next month like this bunch of customers and and another set
of customers who buy cardio equipment maybe from another branch of my store if I am for example uh running
let's say a chain of stores let's say that I'm oh I don't know not to pick names but let's say I don't know
Reliance fresh or something of that sort and I want to understand how my stores are doing let's say I take five or six
stores and I study them extensively how do I know that those results are going to apply to the remainder of my 500 600
stores what is common between these five and the remainder how are they representative of it what part of it
applies to the rest and what part of it does not how do I extend it how do I extend your blood pressure readings to
the next blood pressure readings how do I figure this out that is the heart of Statistics that's called
statistical inference to abstract away from the data certain things that remain the same and
certain things that do not so a distribution is an estimate of that underlying true distribution of
age and so it's not as rough it's smoother how smooth is something that the plot changes that the plot figures
out on its own like histogram but you are free to change it you are free to change it there are
fun there are functions within it functions within this plot and that's it's a it's a fairly sophisticated
function which you can do which you can do many things with I mean it's a fairly sophisticated thing there are many many
functions available within it so for example this bin of histogram this allows you to say where should the
boundaries of those his the histogram part of it be whether you want to plot it or not
whether you want to plot that that what I was calling a distribution the gaussian kernel density estimate it's a
sophisticated way of saying the same thing and there are functions available to put into that so you can change this
it's it's one of the one of the most sophisticated plotting functionals that you'll be able to
see I wouldn't suggest doing it now get a little more experience in doing this but gaussian will not make too much of a
difference what will happen is if if there is if there is no smoothing out here it'll look like a it'll look like a
normal distribution this little these little Wiggles will go away me um it's better gives you a Smo curve we will
discuss that a little later as to when maybe tomorrow as to when it's a good idea to do that and when it is not H
just hold on to that question in a little bit we haven't talked about the gaussian distribution yet I'll deal with
that when the gaing distribution comes for now what this is is it gives you a visual representation simply a
descriptive representation of the underlying distribution hence a distri hence a
distribution plot distribution you always want to compare with the like the samples eight samples if take an example
you distributed them then you're taking a current sample the current yes so if my
distribution is correct let's suppose in an Ideal World if my distribution thinking is correct
then here's what would happen if I take my old new old Aid data and I do a histogram sorry I do a dist in the new
data I do a disc again these two should be very similar the histograms may be different
yeah but the distributions should be similar if I've done my analysis correctly does that mean the variance is
I wouldn't use the word variance I'd say variability it means that there is a there is a s this is called sampling
variability in other words there's a VAR variability that is due to the fact that you've taken a
sample there is an underlying truth but you're not seeing that truth because you're taking a sample there is an
underlying level of your blood sugar but you're not seeing that because you've taken only a very small sample of your
blood a few milliliters where there are liters flowing around and at only for at a few second in time there are many
hours in the day there are so many other things that your reading could have been but if it
is a good if it is a good sample then what would happen is that I'll be able to cover this
variability so if I want to get a sense of what your blood sample actually is and I want to sample this well what I
will do is I'll take samples in different kinds of situations one thing they cover for example before eating and
after eating that that they cover I maybe maybe I want to cover other things as well for example in certain kinds of
diseases they're very conscious as to where to take the blood from because the the metabolism in the
blood changes based on what certain diseases and I won't make for example you draw the blood near the liver the
liver is the body's filtration system so essentially you want to figure out the nature of the blood when it
flows into the into the liver and and then after it flows out of the liver in order to understand whether the liver is
filtering your blood correctly or not now to do that you need to draw the blood in very specific
places so in order to do that therefore you your experimentation should cover all of that what does that mean for
example in business terms let's say that you're looking at sales data and you want to understand your sales
distribution well don't focus on certain sales people look at your bad sales people look at your good sales people
look at your high selling products look at your no selling products cover the range of
possibilities if you do not cover the range of possibilities you will not see the distribution and if you do not see
the distribution you will not know what where the future data will come from and if you don't know that you'll not be
able to do any prediction or prescription for that histogram is just a summary this is
also just a summary but the histogram summary applies to just this data set this distribution is pretending to apply
to a little bit more what is the definition of it definition of distribution the definition of a
distribution doesn't apply to the data so a distribution function so to speak is just this so for example it's
sometimes defined this way f of x is equal to the probability that X is less than or equal to X this is sometimes
called a distribution function f of x is equal to the chance that age is less than or equal to say 15 age is less than
to 16 a to 17 and now let me confuse you even more h F ofx this is the derivative of x the
differential of X is the density function which is the area under the curve this is called the density
function which is what this plot is plotting this is sometimes called the density function the density function so
the distribution function is the integral of the density function and the density function is the derivative of
the distribution function if you're very maty in all of this huh so so what they're plotting is
plotting the density function I showed the so this is actually called the density function the reason I'm calling
it a distribution function is because it says distribution here I was hoping not to confuse you clearly I failed go
ahead yes that's the idea
yes ah now you now you now you've hit the problem of Statistics bang on the head how do I get an idea of a
distribution that applies to everyone based on only one sample sitting in front of
mezen that is the million dollar question and that is why people like me exist right that is the whole point of
the subject and it is a hard problem it is a hard problem because you
are trying to draw a conclusion outside your data
you are you're not nobody is interested in your data nobody's interested in your data right everybody's interested in
their data or in their problem nobody's interested in your data now but you still have to analyze the
data that is in front of you and reach a conclusion that makes sense to them the bank has to look at its at its you know
portfolio and figure out what his risk strategy should be the clothing store needs to figure out look at its sales
and figure out what loads it should make great learning has to figure out its course reviews and figure out which
faculty members to keep you have to look at your uh your expenditures and figure out how much salary to negotiate
for huh how will you do all of this how do you do all of this by the way based on some sense of distribution
right so so when you go and you negotiate for a salary now you're not going to negotiate for you know 100 cres
you might but you say no one's going to give me that anyway so maybe you're good enough I don't know
but but but what you do is you essentially say you do roughly something like the following you figure out how
much money you need and how much money you are expecting and that to Drums to some
extent is based on your expenditure and what you want to do your expenditure is also based on that you have a certain
income and you're spending based on this you're doing all of this on a on a on a regular basis H you're standing on the
road correct you're standing on the road and you're trying to decide whether to cross it how do you
decide experience you got past data and that data is telling you please cross the road how that data has not seen that
car H k53 3619 with his driver has not been seen by your data set how are you Crossing because you're making the
assumption that while I have not seen him I've seen many others like him so so there there's this story right
so you know um a taxi driver is is is is going at night on the road etc etc and he's
just running left right left right so red light cross no issues ETC it just keeps
going the the driver the passenger is getting very scared
stop the the driver he says in Hindi apologize for the language and I'm the lion of the road
who will stop me he goes through all the red lights and then there's a green light and then he
stops and then he says why will you stop now the guy says so the guy on the other side so
he's logical right so his data is saying that there are people who cross the red light so therefore if I'm standing in
light there's red light on the other side cars are going to cross that red light
right very logical so therefore and we do this all the time so while we are not trained as
statisticians at least normal people are not they behave like one based on the experience now your objective and the
objective of an analytics professional is to translate this logic into a algorithm into a procedure the that the
company and the computer understands and that is not easy for starters let's say that you that you
that you are here and you say that this is an average right this is the mean age this is
28.78 A8 and you could say that this is an estimate of the mean of the
distribution this is not this is the mean of the data but you are not interested in the mean of the data why
you not interested in the mean of the data because you're not interested in this particular set of 180
people but you are interested in the average age of my customers so now the question becomes what does the age of my
new customers have to do with the number 28 are they related yes you would say that they're they're like a copy of what
I have now that's interesting so they if they like a copy of what I have then
will I see 28.78 again and now you'll say probably not there a copy but not that much of a copy most likely ah now
we talking so now How likely is most likely and what about it is going to be the
same and what about it is going to be different y AIS of the distribution so the y- axis of the distribution you'll
say is the same Al so for example you could say that this 78.8 is an estimate of the population distribution which
means that yes it comes from the history prog it comes from the same data history comes from but it also comes from this
distribution but there's also this nagging feeling that I do not know for sure I do not know I don't know what
this new data is going to be so what will happen is we will not give the answer 78 28 sorry we will not give the
answer 28.7 we'll give an answer that is like 28.7 plus minus something we'll say I do
not know what the population mean is but I'm going to guess it's around 20 8 I know it is not going to be exactly
28 but 28 isn't useless for me either it's going to be around by by around
28 how much around 28 now certain criteria come in what will this depend on it will depend on
the variation of the data if the data is standard deviation if the data is very variable this plus minus will be large
and the nature of the data right same yes the nature it will depend upon how many things I'm averaging over if
this was 180 I'm so sure if this was 18,000 I'll be even more
sure if this was 18 I'd be less sure so it depends on how much data is being averaged over the more data I have
the Sher I am about the repeatability of it the Sher I am that I will see something similar
again it depends upon how sure I I want to be if I want to be 95% sure if I want to be 99% sure if I want
to be 99 the more sure I want to be the bigger the the the the tolerance I must have on my on my interval and those are
things we'll get to so those are also desriptions but those desriptions are heading towards being able to predict so
now if I give you this 28.78 I've given you a description of the data but I'm not given you a
prediction if if I've now given you 28.78 plus minus something I've now begun to give you a
prediction H today is about descriptive analytics we're not we're not predicting anything we'll get there but this plot
is in some way a first measure of of of of looking at this idea of a population and of a distribution associated with
the population this is yeah huh
if the if the variation less this Curve will be Sharp flat means variation is
more if the curve goes this way it means that there is a lot of variation I'm unsure about the middle in that case you
can't get the proper prediction it's harder you need more data data is more
definitely not the variation of the average would go less so let's suppose that you have no
control over your diet I'm not accusing you of anything it happens to humans but let's
suppose that you are doing a job in which your lifestyle is very varied you travel from place to place you eat in
different hotels sometimes you don't eat at all sometimes you stress out a lot sometimes you're naturally going after
trains and sometimes you're sleeping for 12 hours in a row your life is highly variable now let's suppose and there's
nothing wrong with that many people have very varied lives but let's suppose I'm now trying to measure the blood sugar of
such a person what must I do
now try to other variables or at the very least what I need to do is if I simply want to get a good blood pressure
measurement is I have to measure it under many different circumstances or I could argue I don't
control your circumstances I can control your circumstances so I can say for example that go and measure
it at this time or go and measure it take a glucometer take a glucometer and before
going to bed do this H or after you've just had a very hard day do this I can give certain instructions to cover all
the corners or I can simply say I don't know but what you need to do is you need to measure your blood pressure or sorry
your blood sugar say every 6 hours and then tell me what happens but you need to to do this often because I expect
your blood sugar to be highly variable simply because your body is being put through a enormous amount of
variation in a business situation let's suppose that you've introduced a new product you do not know if this new
product is going to sell or not what will you what will you do I mean how will you measure it you've just
introduced it based on past data you'll do that but you've just released it you can measure
current dat no different situation I've just released the product all that is over
all that is over I now have just released this this watch in the market what typically happens is people
track the market very very closely number number of History the ads number of sales made everything the reason is
because they're not sure how much this will sell see the question is what changed what changed was your product
release now the competitor could be reacting immed immediately my point is not my point is not that there are many
things to look at which you should my point is that when there is a change in the distribution when there is when
there is an un unknown distribution coming in front of you whose variation you do not know you tend to get more
data you sample more frequently or you get more data you you you you figure this out H we do this all the time for
example let's suppose for those of you who who have kids let's suppose your kid is is going to a new school what will
you do you'll ask more questions to them you'll get more data you'll find out
what is happening in school what are the teachers like it because there's too much variability standing in front of
you now with those answers and then you do a few trips to the school you're now a little more you know you may like it
you may not like it but you're at least more more informed that distribution is now known to
you so you get more and more data that's why you get the experience that's
why you start getting that experience if you have that experience already in other words if you know the
distribution very very well and you're comfortable with it it'll take time to get there and
that's why this big data world is becoming so interesting that by the time you've understood a problem the problem
is not important anymore there's a new problem now this is good right that's why you guys have
jobs huh but also means that the answer to that is it also means that when you have new data you solve a different
problem you don't solve the older problem better which is what a statistician to
some extent is trained to do that as you get more and more data get the distribution better get a better idea of
the unknown make a better product but the alternative view is make another
product solve a different problem if you have more data so the CEO is now saying I have more
data give me more more of what solve another problem for me give me new customers that I can
go after and things like that so therefore that problem is is a problem that statistic Big Data people often and
and it's not an easy problem to go after that as you have more and more data coming in how do you utilize it how
how do you how do you how do you make efficient use of this information do you get tighter estimates of what you're
going after you're doing sentiment analysis of text many people do text analysis you'll write you know Twitter
code in Excel and you'll do Laten semantic analysis you'll look at positive net you know net sentiment
scores and things of that and now the question will be that you know that this is going to change people's opinions are
going to change correct so over what granularity do you expect
people's opinions to say the same do they change every day if they change every day there is no point looking at a
person over an average of days because that average is nothing every day is a different opinion
on the other hand if their opinions change let's say on a monthly basis then you can look at Daily averages and
average them you'll get a better estimate of that monthly rating so so so you have to make a guess
as to whether I'm estimating a changing thing or whether I'm estimating a solid thing
better and that's not a that's not an easy thing to do it's is a I know it's happened to me
I don't know whether it's happened to you or not but there are times in my life where I have simply not had
haircuts what that means is I've gone 6 Months 8 months a haircut has been like a weight loss program
right I'm not cared what I look like I'm not sure I do now but you know when things become very unhygienic I go and
get a haircut there have also been times in my life when I've been a lot more conscious
of what others think about me you can imagine what points in my life so now I groom I'm very careful I get my hair
done and you know I'm all correct and I'm getting my hair cut much more regularly now what am I doing so in the
second case what I'm doing is I'm trying to make sure that I'm reaching a certain distributional
standard in other words there certain Target distribution that I have and I'm interested in getting there I'm
intolerent of variability I'm saying that I'm going to estimate this distribution I'm going to stay close to
it in the first case I was not I was perfectly okay with the variability and in certain cases you
will be okay with the variability and you will not want to estimate a distribution of this type and in certain
cases you will you will want to estimated very very well you'll want your hair to be done
very correctly you'll want your product to be targeted to a very specific age group you'll want to know that when I am
targeting to this particular age group what advertisements do I want to show you'll want to advertise it on
television and you'll want to know who is watching the program on which you advertising
this are they are they College people are they professionals are the old people sitting at home who will use this
and therefore where will I advertise my cardio product there times when you want to know this very very precisely or as
precisely as you can so therefore this number this mean number
and this number from a description perspective from a description perspective is perfectly okay it is just
the average but from an inferential perspective it's just the beginning of
the journey it's just one number and we're going to have to put a little more bells and whistles around this go ahead
you have lots of questions clearly uh usually what we read is that a variable with not normal
distribution should not be taken further in the stud okay so we haven't talked about normal distributions we will do
tomorrow but so statisticians need to make assumptions about their data one of the
assumptions is what he's talking about it assumes a certain distribution it says that I'm going to assume that the
data has a normal distribution is an assumption now why do statisticians make assumptions like that one reason they
make assumptions like that is because they make the calculation becomes easier now just because the calculation becomes
easier doesn't mean the calculation is correct because if the assumption is wrong the calculation is also going to
be wrong but because of the Assumption you can do many of these calculations and if
you don't make those assumptions these calculations now become difficult or even impossible given the data at hand
so a lot of the tests and a lot of the procedures that we'll be talking about are going to make certain assumptions
we'll see one in about an hour or so and if that assumption is correct I will have a strong model but if that
assumption is wrong I will still have a model that is that that is indicative so there was
an econom I think Paul Samuel said I'm not entirely sure who but someone who said No George box I think the box and
the box box he said that um all models are wrong but some models are useful right so the question is it may
still be useful if in many cases the distribution is expressly allowed to be not normal
the domain tells you that let's say that you are in an engineering domain you know the data has a certain shape and
the engineering domain tells you that it's a shape and the shape is sometimes called a wable distribution what that
means is that if you reporting out let's say the failures of something you're reporting out the failures of gas
turbine blades as I spent a number of years doing that we had to report out a viable distribution we didn't report out
a normal distribution we had to report out a viable distribution in the finance industry you
report out a log normal distribution means and variances of it every industry has its own favorite distribution
because every industry has its own generic data form now even within the industry a
particular data set could violate that rule and then it becomes interesting that as a statistician do you now use a
higher power tool set a more powerful tool set to solve that this leads to certain complexities
the first complexity that often runs into is which one and do I different do I do it differently from someone
else is like a doctor who looks at a patient and says that uh you know what the textbook says that I should do it
this way but I like this guy he looks different H I've never seen anyone like him before more so let me ignore the
textbook and treat him this way I think he'll get better now could he could I be right I
could but I'm taking a risk so every time you're making an assumption on your own and following
through on it you're taking a very similar risk you could be right for that particular case but the Precedence you
have far fewer precedences to go on and as a result of which later on when you extend it Beyond to someone else you're
going to have to you're going to find it hard to do so so therefore people often make
assumptions and distributions in a sort of in a sort of historical sense that they've known that this has worked
moderately well over a period of time and they're very hesitant to change it for particular
cases sometimes they're not allowed to in regulatory terms they're not allowed to uh any accountants
here accountants right so accountants so you know this so if you're an accountant you have to do your books in a certain
way right let's say that you're measuring cash flow there there is there is a certain way in which you will
measure cash flow right now you may say that in this particular month your business was done
a little differently so I'm going to show better cash flow this way if you can you know you're running into
trouble now you may be right you may be right in the sense that that may actually a better way better way of
doing it but but as soon as you go out of CFA CFA as soon as you go out of a very standard way of doing
things things will be a problem and the same kind of logic applies to often statistical analysis as
well so as a result of which like an accountant you are you are doing the right thing approximately most of the
time in in in in machine learning there's a term that you might see there's a term that's often called like
supervised unsupervised Etc is called pack learning pack
learning it's a it's a deeply technical field and pack stands for probably approximately
correct probably approximately correct I'm not telling you anything if I'm wrong don't blame
me but I'm probably approximately correct and the probabilistic part comes from statistical thinking the
approximately part comes from machine learning thinking and and and it's a it's a it's a deep field it's a serious
field but it it it puts a probabilistic statement or an approximation so therefore at the end of the day whatever
method you use there has to be a sense of how generalizable it is you will do that um you'll do that
fairly soon in in a couple of months you'll do a first hackathon and your first hackathon all
your hackathons will have a certain feel to them a common feel for hackathon is I'm going to give you a data set you
build your model on the data set and I am going to have a data set that I'm not going to show you and I'm going to tell
you how well your model has done on my data set and you have a day or 6 hours or
whatever to fill around with your data set and show Improvement on my data set this is what you'll do you'll do it
twice I think in your in your schedule what does that mean it means that by being very good on your data set doesn't
necessarily mean you are successful you have to be good on my data set but I'm not going to give you
my data set this is not as impossible as it sounds this is a very standard problem
and this is a typical problem you will not find this hard you'll find this very easy by the time you get there no no no
not a problem you all will your predecessors will you will you'll get you know 96 99 what whatever percent
accuracy not to worry technically this is not hard how oh so right so there are two answers to that one is if the mean
is different from the median then you ask no no mean being equal to the median from a
distribution sense means that these are the two numbers okay if the distribution looks
like this and I have a I have a parameter mu we we're going to do this later when when statisticians use a
Greek letter they're referring to something that they do not know right It's All Greek to
them so mu is a population parameter it exists but it is unknown it exists but it is unknown now
if the distribution is nice and symmetric like this then this unknown thing in the middle can be estimated
using a mean or it can be estimated using a median now the question becomes which is better and the answer to that
roughly speaking is this that if there are many outliers if this distribution tends to sort of spread out to the tals
then use a median because of the reason that I said the median becomes stable to
outliers if this distribution has a more Bel shape curve of this particular kind the mean is more efficient at this a
better answer is what if the nature of the distribution is not that but it is like this then the the median may be
here and the mean may be here now you're asking different question now it's not a Statistics question it's a common sense
or a science likee question which one are you interested in are you interested in per capita income or are you
interested in the income of the typical Indian correct for example let me ask you this how much time or give me one
number one representation of the amount of time that you spend on a website I'm asking for one number don't
tell me the number but think in your head as to how you would answer this how much time do you spend on a
website by a website what I mean is this aage yes but what does average mean so how would I do this so so here
here's what I'm asking you you're cruising the web every day let's say so what I'm asking for is a number like
this that and the amount of time that you spend on a website you go to different websites and you spend a
variable amount of time on each of these websites for whatever be your purpose sometimes you're just passing through
sometimes you're seeing a video sometimes you're sending an email blah blah blah whatever and every session I'm
thinking of as a different website and you go to if you go to Google twice then I thinking I'm thinking of that as two
websites so session wise so to speak now I'm asking for representative number so how would you come up with
that number what's what's what's a fair answer to that a mean so if I do the mean here is
how I would do it on a given day I would so the first website I've gone to I'll find out how much time I spend there
second how much time I spend there third how much time I spend there fourth how much time I spend there and I add this
up and I divide that's the mean right what would be the median the median would be i' look at
all those times and I sort it and i' put this in which is going to be larger
it depends is correct but in this particular case so think of your think of your typical browsing habits now
everyone's browsing habit is different huh but just think of it and Network people who deal with network traffic
deal with this problem on a on a regular basis so here is what usually happens most of your sessions are
actually quite short for example a query you go to a website and you post a you post a query
or you go to your Gmail and you check whether there's been a new email or you go to a favorite website news site and
see whether something new is there or not most of the actual Pages you visit you don't spend a lot of time on
but sometimes you go to a website and you spend a lot of time on it let's say you write an email let's say you see a
video so what does your data look like many small numbers and a few big
numbers this is what is called a heavy tail distribution the distribution the histogram sometimes looks like
this heavy tailed this is the right tail this is called a tail of a
distribution a tail to a statistician is not an animal thing a tail is usually refers to the
end of a distribution something called a heavy tail distribution and and network traffic is
a is an example of a typical example of heavy tail so now here is what happens people in this particular case the mean
and the median are carrying very different kinds of information the median is essentially
saying that for a typical website that you go to how much time do you spend on a typical
website now the if that number is low that is an indication that most of the time you are shall we say
cruising or browsing on the other hand if you if you're looking at the mean and that
number is high then you know that you're spending a lot of time on certain very specific
websites and this points to two very different kinds of people so the mean and the median are
carrying different kinds of of information with them both useful so in answer to your question it
depends on what you're going after and and and in certain things you will see one of them being naturally
used as opposed to the other there's also a third one called the mode which is which is actually harder when we when
we were sta students we study M median mode and the mode is the peak of the distribution what is most likely
and the reason the mode isn't talked about much is because the mode actually algorithmically is very hard to get at
the mean is a very simple algorithm the median is a very simple algorithm the mode is a harder
algorithm you can think about how to write a program for the mode if you want to it's it's a much harder algorithm so
the mode essentially what is the mode of this distribution for example so let's take a look at one of
them this is what um this is income for men what is the modal income the modal
income is here it's some somewhere around 55,000 where this maximum
is correct for women it's here maybe just less than 50,000 so you understand what the mode
is it is the it is the highest frequency or the most common value but in practice that's actually a little
difficult to do if I give you a set of numbers how will you calculate the mode but will you see a spike what is a
spike so I'll give you all your ages how would you calculate the mode so one possibility is you you'll look at
the age and ask which age is the commonest where the count count of the AG where the count of the age is more
but that almost almost means that your data is not numerical you're almost thinking of the
data as being categorical because you're counting how many observations there are at a
value the idea of a numeric is that it's sort of continuous it's not chunked that way so for data that is chunked up or
categorical you can easily calculate the mode but something that is not and so the mode therefore has become less
fashionable because it's not a very easy thing to go after when we were in college the more was something actually
quite easy to calculate here's the way we would calculate the mode here is the histogram and the way we would calculate
the mode is this we draw a line from here to here we draw a line from here to here left to left take the highest
class draw this cross line draw this cross line and here is the mode this is the way we would do the
mode in the pre-computer era right I went to college where we didn't have any lap laptops and things
like that running a program meant running to the computer center with pieces of
paper so many of these things were done by hand and this is something very easy to do by manually this is not that easy
to do on a computer the logic is Twisted you have to figure out what
the binwidth is therefore you have to make therefore his estimation of mode and his
estimation of mode will be different from the same data set that is not going to be true for the mean or for the
median and as soon as two different people find the same answer to the same different answers to the same question
you know there's a problem with the statistic so therefore this is so so the mode isn't done as much
these days these are the histograms sort of my data histogram it's this is a way of separating out the histograms in
other words looking at the histograms by different column equal to income essentially means at which variable the
buy says which gender so it's and they go Side by size because they essentially tell you as to what the difference in
the distributions is so what does this tell you I could have plotted a uh a dis plot here as well or other code could
have but this has says that there is a little bit of a difference between the male and the female distributions in
shape as well as in the actual value so to speak and so from a descriptive perspective you can keep doing analysis
of this kind to see whether there is a difference not just in the in gender variable but in other variables as
well do people travel the same amount of miles on different um on different devices a plot like this will tell you
um to compare these two what we can do in the next residency or you can do as an assignment after
that is you can say is there a statistical difference between the miles of
products that are traveled or that are used for between the different products in
other words is there a difference between these three products in terms of how much usage they see and you can
compare three distributions and we will compare three distributions in time okay now the last idea I want to
talk about today is we've done we we've talked mostly about univariate which is one
variable we saw a little bit of a plot but I want to talk about shall we say by variate by variate means two variables
at a time if you want to talk about many variables at a time that's called multivariant but before we get to many
let's get to two so we've we've looked at one notion or we've looked at two Notions we've
looked at the notion of location location means that if there is a distribution what is its middle and
that can be mean or median we have looked at variation like standard deviation range
and an interquartile range but when I look at distributions of two variables
there's a little bit more to it there is a relationship between the two variables that I want to want to be
able to capture a sense of relation or a sense of correlation that how do I measure whether one variable is related
to the other variable or not remember I'm still describing I'm still trying to find a
number like a mean like a standard deviation I'm trying to simply describe a number if that number is this
correlation is high if that number is this correlation is low what should that number be there are many many ways of
defining such a number here is one and is there in the book Let's
suppose so I'm going to do this slightly abstractly so I've got I've got numbers that look like this
X1 these are my points so for example if I look at say a
plot here let's take one of these um this is say miles and income the amount of exercise done and
income each of these points has an x coordinate and a y coordinate these coordinates I'm calling X1 y1 X2
Y2 X3 Y3 X4 y4 x180 y18 you understand there pairs of observations this is say X1 y1 this is
say X2 Y2 this is say X3 Y3 the pairs of observations this way
right now xar is what 1 /
n X1 + xn and I'm going to write this simply because I'm going to have to
write something a little more complicated now summation I is equal to 1 2 n x
i if you don't like the sigma notation that's fine you can write it with dots I add a little complexity
here Y Bar which is the average is similarly summation I is = to 1 2 n y i
okay now I'm going to write something here I'm going to write summation x i -
xar y i - y bar I'm going to write that down I'll tell you why I'm writing that down
but look at that what is X i- xar it's it's sort of like a variation
or a spread of XI from its average similarly Yi minus y bar okay now when is this
term x i - xar y i - Y Bar when is it positive when both of these are positive or both of them are negative
right now both of them are positive means what both of them are positive means XI is above
average and Yi is above average right both negative
means XI is below average or Yi is below average so imagine a data set that looks like
this where is xar and Y bar somewhere in the middle here here is one line Sorry here is a
line and here is another line for all the points here XI is above its average and Yi is
above its average for all the points here XI is below its average and Y is below its average which
means all these terms or most of these terms are going to be positive I may still have a point for example say this
point where it is negative but when my data looks like this this number will
be positive what happens when my data looks like this
when my data looks like this then XI is above its average sorry Yi is above its average and XI is below its average that
means one of these is positive and one of these is negative that means this guy is
negative so when the data looks like this this becomes negative what happens if the data looks
like this the positives and the negatives will this number being negative means
when one is high the other is low for example let's say height and weight height and weight means what the
taller you are the heavier you are the relationship between the
two my doctor says that I'm about four or 5 kilos over overweight I say no doctor I'm about 2
in too short I don't have a weight problem I have a height problem your
interpretation so so therefore so if you want to therefore
get a statistic that captures whether your data whether your variables are moving together or in opposite
directions opposite directions for example might be something like say weight of a car and mileage of a
car bigger cars have lesser mileage which means that if you have an above average weight
car that's probably has a lower average lower than average mileage so this particular
measure this is an addition when I divide it by 1 / n minus1 to take an average effect this
thing is called the co-variance of X and Y this is called the co-variance of X and Y covariance are very heavily used
in certain areas um they're heavily used for example in um you know Dimension
reduction in principal components you'll see that in time um they're used in finance for portfolio management and
things of that sort this is called a covariance of X and Y what is the covariance of X and
X the co variant of X and X which means instead of Y I'll just put X this becomes 1 / n minus 1 summation I
= 1 to n x i - xar into x i - XR which means x i - X bar squared which is the square of the
standard deviation this is sometimes called the variance of X which is the same as the standard
deviation of x squared so that thing that before I took the square root that's called the
variance with the square root is called the standard deviation without the square root is called the variance by
the way it's all there in the book H so in case you didn't get it you can see the video or you can read the
book or these are very standard definitions so the covariance is a measure
of the nature of the relationship between X and Y if the covariance is positive they're moving in the same
direction if the covariance is negative they're moving in opposite directions if the Coan is
zero then many things can happen either the data looks like this there's no relation or maybe the data looks like
this not a normal distribution this is not a distribution this is say price and
profit for example what is the relationship between price and profit by the way
price huh so this is the theoretical relationship between price and profit on this side as price goes
up your profit increases because you're getting more money per product and on this side with even higher price fewer
people buy your product so your profit goes down now for such a thing there when I
the average is somewhere here so the correlation also becomes zero another way to think of it is it's positive on
this side and negative on this side so if this is zero it doesn't mean that there is no relationship it could mean
that there is a complicated relationship something that is positive on one side and negative on the other side and not
that simple I once remember doing an analysis um in which we were trying to find out
it was about attrition why people leave companies and inside it there was a model that we were trying to for some
reason trying to find out the relationship between or trying to understand where people
stay do they stay close to the office or do they stay far away from office and now what do you think is relationship
between say experience and distance to home higher The Experience closer the
distance the experience is the home tenor or experience okay um we had
normalized for that in other words think of it as just experience but we were looking at populations in which
experience Loosely translates to age but you're right there could be people who join join the company very old I agree
with that but let's simplify life and say that you have a data set in which you experience uh and here's what we
found that that early on in their careers people live close
by in the middle they moved away and towards the end they again became
closer now this was an observation there's no signs to this this was just simply scene in that particular
company this particular thing would happen but remember the point is not to describe the point is also to predict to
understand and things like that so we had we had to build a story around this when we went to the CMD and said that
you know here's what we had done uh so so so you can make up a story around this and the story we made up correctly
or incorrectly I don't know is that in the beginning to some extent people have low
dependencies you typically coming you're unmarried Bachelor ET you're also ready to work a lot harder so staying close by
is convenient you get a PG or you get an apartment you stay close to you stay
close to work because staying further away from work gets gets you no particular benefit it's just
inconvenient but as you as you reach in some way Mele so to speak things become very
complicated there is a spouse here he she may have a job there are kids there are schools there's kinds of houses that
you can afford and so this solves a more complicated optimization problem and you may not be able to find a solution to
that problem close to work but people who survive even longer in the company earn enough to solve this
problem through other means and then what happens is they move back to work
again you know bu a villa close to Etc and now there are multiple cars to take you know people elsewhere
kids are often grown up so the number of dependencies are a lot less you may agree with the story
you may disagree with the story but the point is that there's a complicated relationship you're trying to explain
based on what the data is now the use of it I won't talk about much so this this number is a number whose sign positive
or negative tells you about the nature of the relationship but only the sign tells you
the value is much harder to interpret the reason is because I can measure these things in what whatever
units I want suppose I'm measuring you know you know height say height and and weight
and I measure height in in in centim and weight in kilog that's one answer but I can measure height in feet and weight in
pounds and get a different answer I can even make this number Much Higher by measuring height in millimeters and
weight in milligrams I don't know why I do that but I get so this as a value is a entirely dependent upon the units of
measurement which makes it a problem so what statisticians do when they reach this situation is that they normalize
things they make the unit go away so the way the unit goes away is you divide this by the standard deviation of X and
you divide this by the standard deviation of Y now I can do this on the board without
writing anything again but I would suggest you write the whole formula again huh when I divide this by the
standard deviation of x the standard devation of Y now the units cancel out now this value becoming one means XI
is one standard deviation above average in whatever beats units and Yi is say two standard deviations above
average in whatever its units the unit has gone away this number is called the correlation between X and
Y and the correlation between X and Y is a number between 0 and I'm sorry is a number between Min -1 and
1 the correlation is between Min -1 and
one if the if the data looks like this then it is one if the data looks like this then it is minus
one this is the correlation it is a measure of the relation reltionship between two
variables measured in this very peculiar way it is not just a measure of the relationship it is a measure of what I
would say the linear relationship between X and Y a nonlinear relationship or a strange relationship could cancel
out positive and negative and end up with zero or a low number so if the correlation is close to
+ one there is a strong positive relationship between the two strong positive relation means what if one of
the variables is above average then the other is also very likely to be above average and vice
versa so what I can do is this is the when I do my data and I do do core as a function
right this gives what is called the correlation Matrix again it'll calculate it only for
the things with numbers if it doesn't in other words if you give it a data frame and this
doesn't happen then just make sure that you only take the subset of it which has only the numbers do not calculate
correlations for things that aren't numbers if they're not numbers there are other ways to calculate assoc iation
we'll see that later as well now based on this what do you see first of all the correlation between age
and age is one why well it's a 45 Dee line right by definition it is one that this
is a number that comes from one data set with one kind of relationship what does that say anything about the Practical
world so to speak it's another way of stating saying what I've been saying all along how does your data have anything
to say about these relationships outside the data the problem is a little clearer
here maybe but the problem exists for anything so for example there is a correlation of 28 between education and
age H 28 means that there is a positive relationship but a not a very strong one where is that where is that
graph this is age education was a second one right so this one right or this one whichever
way this shows that there is a weak positive relationship between them when one goes up the other does
have a sight tendency of going up now I should warn you that there is no sense of causation here there is no sense that
if x goes up then y goes up because correlation of X and Y is the same as the correlation of Y and
X definition this is a symmetric concept it makes no attempt at causation that's
a different thing altogether so this is a positive this these this is a positive relationship
it's a weekly positive relation relationship this is about usage and education is about
40.4 income and education is about 62 miles and usage is about 48 miles and fitness is about 78 let's see miles and
fitness this is Miles and Fitness nothing in this data set has a negative correlation but you might have seen it
if one was negatively correlated to the other negative related to the other close to
zero you're looking for low correlations right so age and usage for example is a very low
number age and miles in other words age doesn't seem to have much to do with things shall we
say other than income but age and income doesn't really have much to do with your product per se it'll be useful in when
you do clustering later on variables like that are useful to try and segment H Rich old
people always an interesting segment yes population is zero correlation means zero that there is no
relationship between the variables it could mean for example that a plot that looks like this let's pick a variable so
uh closest to zero is what age and usage uh so age and usage is where usage
and this one now this age and Miles that also is prob thing low probab this
one no there's no relationship between them in the sense that there probably is a relationship in the variability in
other words there's more variability here than here but if I want to draw a line through this the line doesn't have
a positive slope or a negative slope there's no there's no idea that says that if one of them is above
average the other is also likely to be above average so low correlation means that
there is no sense that one being above average Rel to the other being above average no increasing no
decreasing correlations are notoriously hard numbers to interpret but they're also very useful summaries particularly
for large data the question that he asked is to does this make any sense in the real
world has two components to it component one is your relationship between the two related to a linear
concept so for example uh I was talking about height and weight what is the what
should be the relationship between height and weight linear so if I plot height versus
weight I should see a straight line okay how she's going to say not
necessarily okay removing outliers we're all outliers aren't we okay um have any of
you heard of a concept called the BMI body mass index in this DNA you have all heard of body mass
index what is body mass index height by height by by no there's no age in
it height by weight squared height by weight squared now so BMI is height by weight squared
now if BMI is height by weight squared what what does that tell you about the human body height by weight squared is
what is called BMI and this number let's say should be around 25 if you are healthy what does
that tell you if you are taller what will happen how will your how should your weight
increase no there's a square here half the half the rate so roughly this should mean let's say that this is
correct let's say roughly that this is correct if this is correct what does that mean it means that height is
approximately 25 into weight squared if you're healthy that means if I see a bunch of
very healthy people and I plot their height versus the weight I should see a curve like
that not a straight line she's figuring this she's saying now why why why why if I'm twice as tall
as should be twice as heavy yes if you want to give it a fancy name correct no you're right right right
that is a parabola undoubtedly true now you now you could argue as to why is it height by weight
squared that's a slightly different question why isn't it say weight by height so let's suppose that you so
weight by height means what so let's suppose that these two they're not the same
well let's suppose that there so so so so these two so this is a certain height this is a certain height if I put this
on top of this what happens to the weight if these two are exactly the same this is going to double or if I take two
of these I don't see two of them I apologize but anyway okay so here's one more so these two so if I do if I put
this on top of this this doubles so therefore if I look at objects such as this then by doubling the weight and
doubling the height so height by weight it remains a constant correct so if I'm looking at BMI for bottles
this way it should be weight by height so if you were a bottle your BMI would be weighed by
height okay now imagine that you are a football now if you're a football and your height doubled how much bigger
would you be you understand the problem this is a
football it is now twice as high how much heavier is it by factor of what huh by so the Vol
height has doubled volume has gone up by what no no huh p r what no 4 by3 P CU it has grown up by by a cubic
Factor so now for a ball the BMI should be weight by height cubed so you're not growing like a
cyinder and you're not growing like a football you're growing like something
between a cylinder and a football we all are not you personally
so which is why it looks like that right babies grow like cylinders we don't we don't grow like
because if we grew like cylinders we'd be a lot thinner think of yourself imagine
yourself when you are you know five or six and now double your height You' be a lot
thinner right similarly you don't grow like a you you don't you don't grow like a football as well imagine you s five or
six and now imagine you grew in every dimension in the same way You' be a lot fatter than you are now so therefore
this relationship depends on the empirical relationship between height and weight for for the data that is
available which is of humans growing and so empirically people have discovered that this is the object that
should be invariant this is an example of what's called Dimension
reduction two variables are being combined into one which is carrying information for you but it relies on a
nonlinear relationship between the two that is not going to be P only picked up by the
correlation so the correlation goes so far and no further it is not one of the more analytically useful things very
often we do test a hypothesis is the correlation Zero versus is the correlation not zero to ask whether the
correlation is real or what is often called spurious and in a later class I think
about two or three residencies from now you'll spend some time on things like spous correlations in other words I'm
finding a relationship between X and Y but is it real or is it due to something else it yes it could start as a basis
for a causation it it gives you some summary of the data it is at best a descriptive measure of
Association sometimes people want to see it in in another form this is what's called a heat map it is exactly the same
thing as a correlation except that in a heat map it gives you nice colors it gives you nice colors and you
can change those colors so to speak um here's the index of what the color is minus one is pale blue positive Etc
and and positive was in the same direction so it gives you a sense of what the color is so sometimes when you
have lots and lots of variables this is two fewer set of variables for a heat map to be useful um so for example let's
suppose that you're looking at a product catalog a few thousand products and you're trying to find the correlation
between sales of those products across time and across geographies and you give a display of you know where and so you
do a heat map and you find those regions where the products are sort of clustering up we often do it in medicine
through what is called micro are we essentially we look at data from genes and let's say there are thousands of
genes and and you look at the expression levels of each of these genes and you say these are the genes that have been
expressed and these are the genes that haven't been so if you are doing correlations of thousands of variables
or hundreds of variables often a nice a nicely arranged set of variables with a heat map gives you a good picture of the
data so heat map in this form is exactly the same as a correlation except that it adds colors to the numbers so that
you're not looking at the numbers you get a visual picture of it so the you so so so the traditional
choice of it is hot is related so red is related and white is not but there are many ways in which you
can change the the coding of the heat map colors okay now comes to some extent a
tool that is descriptive however it is the first predictive tool that you will see I will
not want to use it like a predictive tool but I'll still show it so let me show you what the end product
is the end product is I want to summarize the relationship between say miles usage and fitness VAR like
these right now in predict in relationships of varibles such as this kind here's an equation miles is equal
to - 5.75 + 20 into usage + 27 into fitness this is shall we say a targeted
equation what is this equation as far as I'm concerned today this is this is a description of the
data but the description of the data will be used in order to predict how many miles my instrument will
run so think of what the instrument is the instrument is going to be is an engineer designed instrument and I'm
trying to figure out how much it will be used how many miles it will be used to do that I will figure out whether people
consider themselves fit or not and how frequently they use it and using that I want to get an equation
for the number of miles this will run is there a descriptive way of getting at that
equation so what this does this kind of an equation is what's called a linear regression
model this is your first model this is going from descriptive to
predictive I haven't run it yet I haven't run it yet I'm just saying what I'm trying to
do self-rated Fitness on a one to5 scale I'll get there so maybe I shouldn't have shown you the output
always dangerous to show good people output never show output moral of the story so so what I want to do
is keep it deliciously vague huh so Y is equal to Beta plus beta 1 X1 plus beta 2 X2 I want to fit an equation of that
type why do we have multiple variables I can do it with one variable maybe life is simpler with one variable you have
given me so you can you can in the code AS you'll
see you can you have one variable you can have two variables you can three variables you can have any number of
variables I think they've chosen two to say that you I once had um we going from byar distribution multivar distribution
so he did all of byari distributions then at the end he said now put 2 equal to
n and we were telling him sir it doesn't work that way if you do it for N I can put n equal to two but if you want me to
put 2 equal to n in which two do I put which n h so he's saying I'll show you it for two but if I show it for two you
can do it for one and then you can do it for three you can do it for any but we can try it for one also if you want
to so let's look at that and what what what am I trying to put here I'm trying to
put miles here and I'm trying to put usage here and I'm trying to put Fitness here I
forget which was where but anyway these two variables how am I using it to describe
so you want to you might want to think of it this way if I give you three variables how do do I describe the
relationship between them if I give you three variables how do I describe the relationship between
them there are three variables in the form of something like that is one way of doing
it now does that mean that in reality as you might say that there is a relationship between these three things
no correctly so receiving prise maybe I don't know not necessarily correct not necessarily
so when you do linear regression in the future any regression for that matter there will be three uses of it use one
it is simply descriptive it will simply describe the nature of the relationship to you it
will make no causal inference no sense that this causes this it it will give you no predictive model it simply
describes and we'll discuss how it describes two it predicts predicts means when I put in another value of
x and another value of X1 and another value of X2 I will get a different value of y which means that I've looked at
data from all of you and a new person comes into the room with a new X1 and X2 and I'll put then her her number in and
I will predict her why that is the predictive use of the of a Mor third
prescriptive in order to get a different targeted Y what changes should I make in my X X1
and X2 to get different usage of the equipment what behavioral changes do I
need to make in people to get them to use more an even more complicated use of the same thing so the same model the
same principle can be used for different uses I am using it simply as a description simply as a way to
summarize not univariate not bivariate but trivariate or
multivariate I can do that with the 3X3 correlation Matrix but if I choose to do it this way
now where is my where is the what number am I looking for Fitness is is here average number of
miles a customer expects to walk or run average number of times the customer plans to use so I'm going to give it
this variable and this variable and try and get an outcome for the middle one getting it the way to do it is
something that I won't talk about too much so there's a there's there's there's SK learn which is you know one
of the one of the learning modules that they learn in the sense of supervised learning import linear model regression
linear model as a function and the slightly irritating big function here called linear model which is inherited
from linear model you're giving it a y what is the Y the thing on the left hand side of the equation what is the X the
thing on the right hand side of the equation what is r fit r fit means regression
fit H and this fits my X and Y and this outputs something it doesn't output
anything at this point in time now I have my regression coefficients and my regression
coefficients are 20 and 27 my regression intercept is - 56 and my mil predictor is - 56.5 4 + 20 usage plus 27 Fitness
how is this interpreted from a purely descriptive perspective it means that for
example if usage Remains the Same and my fitness goes up by one unit then my miles goes up by
27 if my fitness Remains the Same and my usage goes up by say 1 hour or one unit then my miles goes up by
20 what does minus 56 means if you don't use it at all and you have zero Fitness you have run minus 56
miles makes no sense but nether does zero Fitness so the model is not necessarily
written in a way in which this intercept makes sense which is why in the software The Intercept is not treated as a
coefficient The Intercept is a part of the equation but is not one of the coefficients that you
interpret this is pure description how does it how does it what does it do in case you are asking can I
hope you don't what it does is this what it does is it looks at the
data and what is my data my data is say y1 X1 X2 and it says this it looks at y1 sorry Yi minus beta minus beta 1 X1 i -
beta 2 X2 I whole SAR this is my prediction or the equation beta KN plus beta 1 X1 plus beta 2 X2 this is my
actual what prediction is the closest to my actual in what sense find the difference between the prediction and
the actual Square it and then minimize it with respect to beta 1 beta not beta 1 and beta 2 so what are bet beta not
beta 1 and beta 2 their variables or their parameters that are estimated in such a way that if
I estimated this way this plane is the closest to the data in what sense in the sense that the
difference between the predicted and the actual is the smallest don't worry you will do this
again you will do this again this is a very important thing in supervised learning in prediction mode in
description mode all that is necessary for this to happen is that it describes the nature of the relationship between
miles usage and fitness describes in what way in addition to the interpretation of the numbers there's
also something else interesting here the positive sign what does the positive sign mean it means that as Fitness goes
up miles goes up as usage goes up miles goes summarize the relationship between three variables treating one of them as
a output this is a descriptive use of linear
regression as a way to describe data is the description real to be
decided to be confirmed to be analyzed to be understood right you do not know it is
empirical it is based on data why is it why is it necessarily
true is there a logical reason why this is to be the case yes you can do it with one you can do it with you can remove
it so if I remove it what happens so what would you do you guys can do it with there you would move it
here instead of instead of usage and fitness just have one of them there I have not given you any idea as to
whether the description is good I've not told you whether this model is a good model or a good equation
in the same way that I did not tell you whether the correlation was good or whether the mean was
good I've not given any quality assessment to anything these are ways to
describe the quality of the model how accurate is my mean how good is my prediction these are things that are
going to be inference and pred we'll come we can't answer those questions before we get to probability the middle
here sense of language on it yes H Fitness and usage
as h Huh huh that's true so you're saying that it it doesn't make sense for
certain values which is true which may well be as I said I am not saying that this is a good predictive model what
will happen is you will you will what will happen you will study a model like this and you'll ask certain
questions what questions might you ask for example here's a question that you would ask you asked a question that if I
fit a model like that is this coefficient that is in front of this variable actually equal to
zero because if it is actually equal to zero then there is no relationship between
the output and that variable so what we do is we ask for a statement of this kind if say Yi is
equal to Beta + beta 1 X1 + beta 2 X2 I asked for the statement is beta 1 equal to
Z and these are called hypothesis because if beta 1 is zero then this number should not be in the
model and therefore this variable has no predictive power over this variable which is where the analytics part
becomes interesting but to answer that question I need to have a sense of how do I know
whether this is zero or not and to answer that question I need to have a sense of what the error around
that number is so this number is not 20 it is 20 plus minus something in the same way that my mean
of 28 age of 28 was not 28 it was 28 plusus something this is also similarly not 20 it is 20 plusus something and if
that plus minus something includes zero then I can't say that this is not zero if on the other hand that plus
minus does not include zero I can say it's a predictive model that's coming but for now this is simply a way
to describe data and like for means like for correlations like for standard
deviations and for linear regression all of these all will now see an inferential phase to them the mean must see a plus
minus the regression coefficient must now see a test is it equal to zero or is it not equal to zero all these models
all these estimates will now be put into an inferential test into predictive test how is how useful is it for new
data because just describing current data is not going to be good enough for me I'm writing an equation like
this I want to write this equation I want to write miles is equal to Beta KN plus beta 1
into usage plus beta 2 into fitness I want to write
this the code now tells me what these numbers are this number is -
56 this number is plus 20 and the third number is plus [Music]
27 that's it you can call it intercept based on what your whatever your term is yes yes yes in X just put in another
variable do comma another variable it can be any number try it out I mean you can do it
now if I don't want to FID around with this I won't plot it my Purp Pur is to if I could plot it I would but remember
there are three variables remember there are three variables why am I doing this because in
two variables I can plot it I can also look at many variables at a time and see a correlation but if I have three
variables plotting things becomes difficult if I have four variables plotting things becomes even more
difficult but you still do it I think you have Tableau or in your um curriculum maybe I'm not sure but
visualization technique can still help you but if you got a 10 variables then plotting is not a way to do it so how do
I express the relationship between 10 variables by arbitrary equations like this what does it mean this intercept is
if this is zero and this is zero what is this but as we had said this zero doesn't make sense and this zero doesn't
make sense but this this is simply a line that goes through the data if I have
data that looks like this for example all it does is it fits this straight line what is The Intercept where it cuts
this axis does it make any sense maybe maybe not this is the place where the data makes sense but the equation is
written so that it cuts the line here correct if I find a relationship between height and weight and I write
the equation as Y is equal to bet or say weight sorry is equal to Beta plus beta 1 into height what is beta 1
beta 1 is the weight of someone who has height zero makes no sense right but giving me
the freedom to have a beta 1 here allows me to get a much better line because I can move this line up and down in order
to get the best fit it allows me an extra flexibility don't
worry in fitting good models you will have enough experience in doing this my purpose is just to show you it as a way
to describe three variables in one shot I am again I'm not building a models if I do it for two of them just miles and
usage just just two of them this is an equation an equation just of this kind with one variable you wouldn't do
this because there's nothing to model right there's no equation between one variable criteria for doing this
remember my purpose is not to use this to select which variable to model when I'm calculating means and standard
deviations and correlations I'm not using them to select anything I'm not saying that I will measure your mean
because you're important or I'll measure your standard deviation because you're low I'm using this as a tool to
summarize three or four variables which variables to use where in predictive mode you can do you can look at for high
correlations and there are many other techniques that you learn in order to figure it out so just like a mean is a
way to do analytics correlation is a way to do analytics stand deviation is
similarly uh so what we had done yesterday is we had spoken essentially about descriptive statistics and
descriptive statistics is the taking of data and to Simply describe
it with the later purpose of either visualizing it or writing a report or using it for inference and prediction in
later courses or later applications it is compared with um predictive statistics or Predictive
Analytics and then prescriptive describing is simply a a task of summarizing ing a given set of numbers
uh you'll do sessions in visualization in due course prediction is a task that is uh
often in uh machine learning or a data mining professionals requirement to say that if something changes then what
happens uh I should have made a comment that there are two English language words that mean more or less the same
thing one is forecasting and one is prediction um in the machine learning World these words are used a little
differently forecasting is is usually in the context of time so something has happened in the past what will happen in
the future I'm giving you this week what will happen next week forecasting in the future prediction is usually used
without any sense of time prediction is like I'm giving you an X you give me a y so I'm giving you one variable you give
me a another variable so Predictive Analytics doesn't necessarily forecast
anything despite the fact prediction itself is about forecasting uh so the words mean
slightly different things uh it's a little like you know price and worth mean more or less the
same thing but Priceless and worthless mean different things so so the words are used in
slightly different context so in descriptive statistics um we had looked at certain ways of doing things for
example we had looked at what is called univariate Data univariate means one variable for
the univariate distributions we had seen certain kinds of descriptive statistics some of them were about shall we say
location location meant where is the distribution and we had seen for example things like means and
medians which talked about where is the distribution located we talked about things on
variation where we have talked about standard deviation we'll talk more about things like this
today standard deviation um Range inter quartile
range here also we had terms for example like you know the quartiles the upper quartile the lower
quartile these are parameters that are used in order to convey a message to someone saying that what is the data
about so for example a five point summary talks about the minimum the 25% point the 50% point the 75% point and
the maximum irrespective of the number of data points you could have 10 of them
you could have a 100 of them you could have a million of them you could have a billion of them it doesn't matter it's
still five numbers uh sometimes those five numbers tell a lot they tell about location they
tell about spread they talk about skewness is the distribution sort of tilted towards one side is there more
data on this side than on the other in terms of the data spreading out towards the
tales so and so there are plots associated with this as well we talk a little a little bit about the plots
later then we went towards the end towards the idea of let's say bivariate data by variate means that there are two
variables in which we didn't spend a lot of time we talked about co-variance and
correlation covariance is a sense of variability of two variables together uh its univariate version is a
variance which is the square of the standard deviation a scaled version of cence is
the correlation if the correlation is is close to plus one then it means that there is a strong positive relationship
between the variables positive means if one goes up the other also goes up if one goes down the other also goes down
negative means the opposite as one goes up the other goes down correlation is not to be confused with causation there
is nothing in the descriptive world that says that this causes this there's no sign sence to this this is simple
description the science to it and the logic to it and the use of it for for inference for for for business logic and
things like that will come a little later for now we are simply describing then we have taken an even
brief and perhaps even more confusing look at multivariate our first multivariate summary where we looked at
the idea of a linear regression a linear regression is an equation of
the form Y is equal to say beta plus beta1 X1 plus beta P XP where one variable is
written as an equation of the others this is nearly done to describe
the nature of the relationship between the variables correct it can be used for
prediction it can be used for prescription if you want it to but that is not our purpose here our purpose is
simply to describe a relationship why is this useful because let's say that you've got three
variables four variables 10 variables you need a mechanism to say how these variables are connected how do you
describe 10 things at a time there are Graphics out there there are famous Graphics in history where you have uh
many variables being represented in in on one plot or one visualization so visualizing things
itself so for example we looked at a certain kinds of plots we looked at for example
histograms we looked at box plots sort of pairs which were essentially scatter
what are called Scatter Plots so these are for the human eye these are things for the human eye to to
see data and they have the limitations because we can only see data in a
certain way we can't see very high dimensional data visually we can see up to three dimensions
maybe uh for those of you who are interested about such things or any of you are in the graphics World Etc you
spend a lot of time saying how do I how can I make people see things um so how many dimensions can you actually plot in
uh python itself is is good at it uh but there are other devices so for example let's say that you're plotting you can
have of course one variable as x one variable as y um another dimension can be maybe the the size of the plot you
know if this is bigger then another variable Zed becomes larger it can be a color like a heat map a fourth variable
if it is low can be blue and if it is high can be red another may be the shape of it lower values are circles higher
values are more pointy so there many ways in which you can get summarization to be
done so um when you do visualization if you do you'll see other ways of summarizing it but if you want to do it
as a number then something like an equation that looks like this is often a good representation how one gets at
these beta 1es and beta PS I I explained very briefly what happens is you you form this equation and you take those
values of beta beta 1 and beta P that are closest in some sense to the data so if I draw a picture of say two of
them y on X and I say give me a line which line should I take take the distance from the line to the
points and make this distance the smallest get a line that goes through the data with the smallest distance to
the points how is small measured small is measured by the square of these
distances because distance on the above the line and distance in below the line are
equivalent so if this is my Beta plus beta 1 x and this is my Y what I do is I look at y minus or y i minus beta minus
beta 1 x i I is equal to 1 to n my N Point Square it this is the squar of the distances
from the line and then I minimize this with respect to Beta KN and beta 1 that is how I get the numbers but if you're
simply interested in what python or R does then the program will simply give you what the number is so what those
will give minu of beta 0 bet what sorry what I will get it from those you will get the Val value of beta not and beta
1 find the value of beta not and beta 1 such that this is the smallest f for different values of beta
not and beta 1 this distance will be different for different lines this distance from the line will
be different which line will I take the line such that this is the
smallest how to get the beta so take form this y IUS beta minus beta 1 x i s on a plot actually that points
are where the point existed the point is here the points are here so these line line is basically which the line is a
line I'm trying to find here is a point here is a point here is here is a point here is a
point here is a point right let's say Five Points I want to describe the
relationship between these Five Points therefore what I need to do is I need to find a line that goes through
these points I want to write an equation of the type Y is equal to say I'll remove
the B and X Y is equal to a plus BX I want a line like a plus VX going through those points there are many
lines this is one line this is one line this is one line this is one line they're all lines which line will I use
to represent the relationship between Y and X I need a
criteria so what I do is I try to say let me find a line let's say that this is the line and find out how good it
is at this describing the data now when is it good at describing the
data when it passes close to the points because that is his purpose to describe the data because I want to say
that this line without any data points is a description of the data but how to get
that line position that's what I'm talking about so I need the value of a and
b correct so how do I find the value of a and b for every such line A and
B I find the distance of the points to the line so if there how many points do I
have here I've got five points I've got five distances what are the points this is
the point X1 y1 this is the point say X2 Y2 X3
Y3 X4 y4 and X5 y5 these are my Five
Points how far is the point X1 y1 from the line This
distance and what is this distance this distance is how much this distance
is this point is y1 minus what is this point a so
A+ B X1 that's the point on the line
correct okay I can stop here but if I stop here what will happen is that if this is the distance then this will
become a negative distance and this will become a positive distance and they will cancel or neutralize as you say Sir a is
which point which is from that point to the line actually that is the a distance no a is this
equation a is the equation of the line you want to know what the term a is a is this
point B is this slope and I want to find a and b so this equation is a + BX so this point
is y and this length of this line is y - A + bx1
squared plus for the second one what is it for the second one Y2 - a - b X2 whole s
do this five times
correct for every line you will get this number if you want to you can take a square root for every line you will get
this number this number is the sum of square distances of the line from the data it tells you how far the line is
from the data the larger this number is the further the line is from the
data the smaller this number is the closer it is to the data if it is if the data is on the line
what is the value of this zero so if every point is on the line or if the data is itself a straight line then this
will be zero so I have formed this now I find the value of a and b such that that is the
smallest for every A and B I will get a value like this if I take another line I will get another value of
this for every choice of A and B I will get a difference distance from the data which A and B will I
pick that A and B such that this distance becomes the smallest so can we have a issue where the algorithm means
computationally we don't find you don't value of which can kind of minimize me the kind of uh okay so let me finish
this so choose a and b to minimize
this and that is the A and B that the software gives
you this is called a linear regression right answer to does it have a pro does it have a Le Square this is why gaus was
so successful and laas was not you will get a unique solution this what called a convex
problem and this is a convex optimization because of the squaring if you have modulus values here
there is a possibility that you'll not get a single answer but because of this and because
of this square and because of the nice b-shaped curve that the square function gives you you will find a unique
solution to this so how many times system tries the number of data point no the system doesn't do it that way the
way the system does it is the system differentiates this with respect to A and
B differentiates with respect to a sets equal to zero differentiate respect to B sets equal to Z Z and solves those two
equations it doesn't minimize it doesn't minimize when this becomes very high
dimensional this minimization this differentiation of solving it becomes a very interesting problem in mathematics
in numerical analysis to do that you need typically to do linear algebra and in courses such
as this and in machine learning books you will see at the beginning of the book you'll often find Chapters on
optimization and linear algebra because of this or something similar to this that to represent a problem you
often need a matrix representation and to get a a good learned solution you need an
optimization so most machine learning algorithms are built that way because for as I was saying yesterday that
you're going to tell someone to do something you're going to tell a car to behave itself on the
road yesterday while going back today morning I heard that or I read that BMW and dler are setting up a you know 1
billion Euro R&D operation somewhere in Europe for self-driving cars etc etc two different Industries are trying
to go towards making cars that don't need people the automobile industry is as well as the ride healing
industry people like uh Uber and Lyft and Ola and these companies so now you're going to figure
out the car is now going to have to be told when to go and when to stop but how does the car know that it has a good
rule how does it know that it has learned and what is good learning as opposed to bad learning what is enough
learning as opposed to not enough learning a computer is stupid all a computer can do is store a
lot of data and do calculations quickly computers aren't intelligent to make the computer
intelligent you have to give it an intelligent function you have to say Okay run your algorithm such that this
thing becomes the highest it can be or this thing becomes the lowest it can be which is an optimization
problem so what machine learning algorithms almost invariably do is they say that here is an input and here is an
output give me an algorithm such that based on the input you can come closest to the
output for example object recognition if I'm if I'm teaching computer vision or if I'm teaching text
recognition or any of these let's say text recognition so I'm trying to understand what a word what the word
is so so I'm the computer is reading something let's say in in handwriting and he trying to identify
that as an English language or or a Canada or a Hindi phrase so it's going to write something
down you write this and in my horrible handwriting I'll write something and that camera has to recognize what I
wrote and transcribe it into something that you can read now how does it know it's done a
good job what it needs to know is that this is what I think the word is and this is what the correct word is now
tell me whether I'm close and if I'm close I'm good if I'm not close I'm not good but this has to
work not just for one word this has to work for thousands of words so I must be close to thousands of
words at the same time therefore I need to measure the distance from my prediction and my
actuality over many many data points so all these algorithms what they do is they take your prediction and they
compare with the actuality and they find a distance between them and they minimize the totality of the distance
between the prediction the actual and an algorithm that minimizes that distance is a good algorithm it has learned
well so they all do something like this with this is the prediction and this is the
actual and a and b are the parameters in the in the prediction in other words find a prediction such
that it is closest to the actual so this algorithm has become very popular it's probably the single most
popular fitting algorithm out there this is called Le squares least squares
H this is called least squares squares here's a Square least because you are minimizing it's called
least squares and the least squares algorithm is a very standard way of doing things this has nothing to do with
the algorithm itself the algorithm can be anything this itself can be a neural network it
can be a support Vector machine it can be a random Forest it can be Association rule it can be any of your
Logics but the question is if you give me the program how do I know whether the program is
good so I give it what's called training data training data means I tell it what the
right answer is sir yes this we can infer that this is the starting point of basically what
the prediction and what that we are comparing and getting the result of that yes so this is the prediction this line
is a prediction if you want to think of it the data points are the actuality the problem is this these dat
points are also not the actuality the actuality is going to come in the
future it is a training set for the data it is the it is the the data that has been given to the algorithm to train
it but is not the algor it is not the data that the data will actually run on the car will run on the road the car
will see its data points its people and other cars and the cows and whatever for the first time it will not have seen
that data before but it will need to know what to do starting on learning basically yes so
what do you do so what you do is you train the algorithm what does training the
algorithm mean training the algorithm means you give it data for which the car is told what to do in other words you
give it what they call Ground truth so you give it the why and you say here is the data or here is the situation please
do the right thing so please do it such as this so here's a person who's Crossing the
road please stop here is another person crossing the road but he's very far away calculate the distance compare with
your speed and decide what to do he may be far enough for you to be able to see but you may not stop if you are driving
a car it's quite possible that you are seeing someone crossing the road but maybe about close to 100 met ahead and
you're not slowing down because you're doing the calculation that I have a speed the person crossing the road also
has a speed and by the time I get there this person would have gone do not do this when doing a level
crossing but we all do this all the time we do this when crossing the road so I'm happily doing that there is a car coming
but I'm still crossing the road why because I know that I'll be able to cross the
road before I get there so the car needs to be taught how to do these things so this data it's given data like this and
says for the training data get as close as you possibly can to the training data and then it's given what's called
test data and now the algorithm is told oh now I'm going to give you new data and now you're going to tell me how well
you did on new data so suppose you were given a problem like this I'm not supposed to talk about
this your your ml instructors are supposed to talk about this but suppose you given a problem like this in other
words I've given you a data set and I'm going to tell you that your performance will be judged not by this this data set
but on another data set that I am not giving you how will you what will you do how
will you make your program ready generaliz yes so how how will you make your program
generalizable so the usual way it's done is something interesting you say that okay you want me to predict data that I
have not seen I will see if I can do that so what you do is all the data that is available you take a certain part of
it and you keep it aside you have it but you don't use it and now the remaining part of the data you build your
algorithm on and now you test it on the kind of data that you yourself have but have kept aside this is called
validation data and now if your algorithm works on your own heldout data that data that
your algorithm is not seen you are more hopeful that it will work on somebody else's new
data this called validation and this entire cycle is often called test validate train or or train validate test
Etc and you will do this in your hackathons but to do this the algorithm
needs to know as to how good it is and it needs measures like this there are other measures so for example if you're
classifying an algorithm good or bad positive sentiment on tweet or negative sentiment on tweet no numbers then you
do not need this what you need is simply are you correct or are you incorrect if it is correct let's say you
give yourself zero distance if it is incorrect let's say you give yourself one distance in other words you made one
error and you just count how many mistakes you made but what is a mistake when it comes to estimating a number
like say miles and things like that there's no mistake you're either close or you are far so you need to measure of
how close that's a measure of how close so this descriptive method is used as a criteria for building predictive
models this itself can be a predictive model but very rarely is it good enough too few things in the world are this
simple are they things in the world this simple yes but as we said as we discussed
yesterday even things like height and weight are not that simple there are complexities to that so
for example you can have theories we said for example you could say uh let's say a savings rate what's a savings rate
a savings rate is the proportion of money that you save now if there is a savings State what that would mean is
that you if I take your income data and I take your consumption data that should form a straight
line because you're saving up the same proportion every month but it's not if you go home and month by month
you figured out what what your income was fairly precisely from your salary or from other sources etc etc and you also
plot again fairly precisely as you can how much you you your household spend that month
it will have an increasing effect probably but it it's very very unlikely to be a straight line in certain things
you may be going after a law of physics but the law of physics May hold for Gravity may not hold for anything
else I remember trying to apply this so one day one day Cricket sort of became popular when I was in school or
thereabouts and one calculation was done as to as to how to figure out whether a a team is doing well or or how well is a
Chase going so one point possibility is to Simply track the score the other possibility is to say that if you know
how many runs you're going to get you tend to begin slow protective wickets and you accelerate so what you do is you
build models for that you build models by saying that let me assume that the team is going to accelerate
constantly which means that every over that comes later it's going to do it's going to get better its run rate
is going to keep increasing steadily now if its run rate keeps increasing steadily then when will it reach the
halfway point that is the same thing is asking the question that if I take a ball and I
drop it how long will it take to get to the halfway point and there's a square root term there and the answer is about
50 divid by the square root of two about the 37th over or something of that sort so effectively the logic was if at
if if you have reached halfway point below let's say the 37th over or so you are on
track if not you need to accelerate a little faster that's using a physical law to try and predict something that is
not a physical law and the laws of physics do not apply to CRI Cricket at least not in this way
that I'm describing so therefore these laws will get you somewhere like a straight line
etc etc but they are approximations and so what you will do is you'll build better versions of this
when you use it for an actual prediction but the same argument holds for things like mean standard deviations and many
such things if there's a specific problem you need to solve you may make get a better estimate for doing it yes
someone had was asking a question question that yine yes then what the B is actually
that what we talked about so so there are many ways to do that one is you just put it in you you find for different
values of A and B you find what that number is and then you solve it if you want to do it the hard way you can still
do it the hard way and the hard way will end up being something like this I'm minimizing and I should not be talking
about this say Yi - beta minus beta 1 x i squ I was using a and b right so say A and B
whole squ I'm going to minimize this with respect to A and B so essentially what I'm going to do is I'm going to
call this let's say l Of A and B and I will say DDA of L A is equal to
Z ddb of lb is equal to Zer and this will and I will solve these and this will give me two interesting
equations and my answers will be this I'll tell you what the answer is your B hat your estimate of
B your estimator B will be this summation x i - xar y i - Y Bar divided by summation x i - xar
s and your a will be this Y Bar minus B hat xar so if you want formulas these are your
formulas because I'm minimizing something to minimize something is the same thing
as setting as derivative zero now that is also the same as maximizing something but this is where convex optimization
comes in that this will have a minimum but will won't have a maximum so by setting it equal to zero I'm going to
arrive at the minimum yes the minimum will come with respect to a right not with respect to X
and yes X and Y are fixed the data is fixed the parameter is varying the range is
X and Y are fixed for my data correct so my B is written in terms of a and so this is a Formula if you want to
close it this can also be written as the co Varian of X and Y divided by the variance of
X so if you want to calculate it for two variables what you need to do is you need to calculate the covariance and
divide by the variance and here Y Bar minus B xar this means that the that the that the line passes through xar Y Bar
the line passes through the middle of the data with the Der the minimum will be we
are minimizing a right we minimizing with respect to a a is a variable
how Min how it will do this so for different values of A and B
the distance will look like this there's a particular value of a and b in which the distance will be this there's
another value of a and b in which the distance will be this there's a particular value of a and b in which the
distance will be this that is corresponding to the cor this is this is my my uh summation Yi - a - bxi
s this value for different values of A and B I will get this
so when I minimize this now to do this you don't need to do it all you need to do if you want to do it if you want to
do it is this if you want to do if you want to do it do this do you have yesterday's
code open it you can do it then right now that's it you stop is like saying I get the mean then
what one use of it is to predict another use of it is to prescribe there are many
uses of it a third use is to do nothing but simply to use it to to visualize or to summarize the relationship between
two variables correct and we do this all the time so um so for
example how do you measure how price sensitive your product is do you understand the question you
trying to you're trying to change the price of your product why would you want to change the
price of your product profitability maybe you want to increase it so that you get more
money so people in marketing often want to understand how sensitive my sales are to
price now to do that they come up with various kinds of measures one particular measure is what is called the elasticity
of demand velocity of demand means this if my price changes by
1% by what percentage does my sales change well if my price goes down I
would expect my demand to go up but by how much now there are certain assumptions to this for example it's
it's assumed that the same number works if it increase price as well as your decrease
price so this is called the elasticity of demand so therefore to get the elasticity of demand but what is the
elocity of demand the elocity of demand is essentially a slope a slope that relates something
like this that if I have Demand on this side let's say sales on this side and price on this side I have this negative
slope the slope of this is what the elasticity is so very often you do equations like
these in order to Simply get at a number that has a certain meaning for you so the slope of linear regression
between log sales and log price is the elasticity of demand for that product I mentioned log sales and
lo log price because elasticity is done in terms of percentages a percentage increase in
price and a percentage decrease in sales if I don't do it as a percentage there's a problem now my measure depends on my
units is it, units per rupee or what it depends on what I'm selling and want currency and that's not a good measure
so I measure it not I measure it as percentages but when I measure it as percentages have to meas on the log
scale so there are many models like this where the equation itself is used to Simply describe a
parameter something that tells you a little bit about the market like an elasticity of
demand you're not using it to predict anything you're simply using it as a descriptor so you say that this is this
is an inelastic product if this is an inelastic product what does that mean it means that if you change its price there
won't be too much of a change in its demand classic examples of that for example are
salt if you change the price of salt a little bit they at least certainly domestic salt there won't be too much of
a change in demand there might be a little bit but there are certain things that highly in elastic you change it a
little bit and the demand will change a lot and marketing people are very sensitive to to this idea saying that do
I is my is my demand elastic or is it in elastic if I want my prices to go up then I want the demand to be in elastic
because I don't want my demand to go down if I want my demand to if I want my prices to go down or if I'm pulling my
prices down then I want the demand to be elastic because I want people to say that your prices are going down
therefore I will buy more so marketing analytics is very concerned with things like
this so therefore sometimes an equation of this kind is built just to describe
something right so what I'm going to do is let's go down and since we are going to do this
just on two let's pick it just on two so let's let's change this to maybe miles and let me remove
this so what I'm going to do is I'm just going to do it on one of them I I suspect one
parenthesis might then work I suspect this might work two x has to mean two simply
because of the weight entered ah because it because I have not done anything on this data set
now this one is a comment so what do I have on the coefficient here 36 and 22 so what is my
equation based on this miles is equal to -
22 plus 36.2 n whatever into usage okay all right now let's try to do
this manually if you want to if I want to do this manually what so I need to get at each of these things so now I
need to find for example I need to find let's say the co variance between miles and usage how do I do that tell
me no not a sample the data is present in me so if I so now I have things like for example my data
miles correct so I can I can calculate things on this so for example I can
do I can do this this the mean I can do calculations on
this okay so now if I do say say what is the standard deviation
syntax St not DV
okay this is standard deviation okay let's try one more this is the variance what is the
variance the square of the standard deviation now I want to find the covariance of
these how will I find the covariance not necessary remember I have the correlation function how did I find
the correlation function here I found a correlation function from here so I've got a number of ways to
potentially do this one is I can do it with the correlation function or the covariance function in other words so
for example I can try doing this how do I write it here my data
dot this thing here was the correlation this gives the covariance Matrix this gives the co Ian Matrix okay
now what is the value what is the value of B according to my formula so covariance of which variables
now which are which are my two variables miles and usage where is that co-variance is it this number 42.6 71
right okay divided by what variance of what VAR no variance of
usage why not why is in why but why is in question mark why so
so so my data dot
usage Dot bar is this also here in the data it is because what is a sort of
what is the diagonal element of this what is this number usage
dot this is usage 1.17 this number here here this number here is
the variance okay what is the equation usage this is my X this is my y this is my X so
covariance of XY divided by the variance of X So based on this what is my answer my answer is going to be for the
the answer for my coefficient is going to be where is the covariance here 42. I can do it you know manually almost 42.
71 divided by where is the variance 1 1 7 say you
know you know six or something of that sort 36. 318 where is my value of
B here this is my slope
right how do I get my how do I get my intercept mean of Y
so my data this is the mean of all of them so what do I want which mean do I
want mean of what is my y here miles where is my mean miles let's say
103 say point oh I don't know say9 minus what is my slope say 36 point I know 32 or something of that
sort star what is my X usage which is 3 point say 4
five so 3.4 5
3.3 4 five or something like that right will star work that way
minus 22 what is my coefficient minus
22 so if you want to you can do this from first principles by using that
formula I'm not asking you to you can do it just by running linear regression but what it is is this you
can also check the units what is the unit of B the unit of B is a unit of Miles divided
by the unit of usage what is unit of the covariance miles into usage divided by variance which is miles into miles so
the ratio of this is usage by Miles what is the unit of a miles this is in Miles this is in miles
per usage and this is in usage so the unit all makes sense which one
units what is the unit of the covariance the unit of X into the unit of Y why is that remember the definition of
covariance it's the product of an X and A Y so this is in the unit of the product
of X and Y this is in the unit of the square of X so the product of X and Y divided by
the square of X X and Y cancel out y this becomes the units of Y by X which is what B should be B should be in miles
per usage 36 means what it is 36 miles per usage unit that's what B
is B is in some units because B is in some units we will run into some difficulty when you use this in
predictive models because let's suppose I want to figure out is this number equal to zero or not because if this
number is equal to zero statistically speaking then miles doesn't depend on usage but because this is not a
dimensionless number I can make it anything I want to by simply changing the unit that makes the
statistics a little hard so I cannot simply look at this number and say whether it's high or low I can make your
height anything I want to by simply changing the scale I can make your height A Million
by see simply using a small enough unit so simply taking a raw measurement tells you no idea of the value of its
magnitude yes that same arent will work for any of those parameters so therefore when we do testing when we do hypothesis
testing we need to normalize all these numbers by something and that's something is typically standard
deviation so we'll do that okay so let's end this the purpose of this was just to tell you what that regression line is
and then there are similar formulas as the dimensions increases it's hard to do this manually for two of them you can do
it manually for three of them it's hard to show manually which is why I changed it because I would not have been able to
do this for two way variables the formula becomes a lot more complicated for two
variables and which is why people don't use the formula for say 10 variables now what I want to do is I
want to talk a little bit about probability this the slide deck should also be there with you so you have to
cope with the idea of probability is to be able to cope with this uncertainty what is the uncertainty that we're
talking about here the uncertainty is that is that when you observe OB erve something you're not entirely sure what
the value is not because of a measurement perspective but because you do not know what the corresponding
population number is you do not know the truth of the number another sample will give you another number there is
uncertainty and this uncertainty is being me is usually captured by a probability H here is interesting
question what is the probability that a man lives for a thousand years the empirical probability what is empirical
probability mean empirical probability means you ask a question has anyone live for a th years if the answer is is no
then You' say that the answer is zero if anyone has lived for a th000 years you'd say tell me how many people have Liv for
a th years so one interpretation of probability is simply you see it there's a criticism to
this point of view of one of our teachers Professor dbas who many years ago would say that if you want to find
the probability that little girl is going to fall into the river how many little girls do you want to walk next to
the river to find out so in other words not all probabilities can be thought of as let
me just see how often it happened so you need a little bit more than
this so some words the words are often useful to know probability refers to the chance or likelihood of a particular
event taking place an event is an outcome of an experiment an experiment is a process that is performed to
understand and observe probable outcome probable outcomes the set of all outcomes of an experiment is called a
sample space this is correct and it's easy to understand with one problem who is performing this
experiment now when you use probability you are some you're in you're in two modes in one mode you are
performing the experiment what does that mean let's say you are running a marketing campaign or you are designing
a portfolio or you are manufacturing a product or you are recruiting people or you are testing a piece of code you are
doing the experiment and sometimes you are not doing the experiment somebody else is doing the experiment and you're
simply observing the customer is buying or is not buying the product is failing in the
field or it is not failing the portfolio is making money or it is not making money the person you've hired is staying
on or is quitting it is not your experiment you are simply observing the outcome of
it so sometimes you get to do the experiment and sometimes you do not we used to call these things
experimental studies and observational studies and experimental studies is something in which you begin by
designing the experiment and you have a handle over how much data you will collect an observational study is you
just watch and you see what data comes in you will in your careers mostly be working with observational studies
because of the nature of data today there's just a lot more that is simply being generated without any anyone
asking for it in certain very peculiar situations you do experimental studies for example nuclear explosions right why
why do countries want to test nuclear devices collect primarily to collect data primarily to figure out whether
this thing works or not or how does it work or not so they do little experiment to say boom let's see what happened
because otherwise it's all computer simulations and you got no idea whether this happens or not
I remember running into trouble with my engineering friends on this working on the design of a of a fairly large um
aircraft engine U and and there was a question of saying that you know what is the thrust
or what is the efficiency of the engine and I and I stupidly made the observation that why don't we test it
out and so they looked at me this side that side Etc as if you know how how do we going to explain to this
idiot and then patiently one of them said to me uh very kindly he was a very ctly
gentleman older than me and he and he took the responsibility of telling me where will it
go so his point was that if this engine fires up it's going to want to
move where will it go pointing to the difficulty that I cannot easily do
a full-blown test of a jet engine because if I do start it I've got to give it enough room to move
somewhere so where do you want it to go so where do you want it to go so you will not be in a situation to do that
very often so when you say experiment it is sometimes your
experiment and sometimes it is not in rare situations will you be in an experimental s like in AB testing and
websites for example it's a common job marketing people often asked to design websites and they asked to say does
which is a good website so you do an AB test what's an AB test you design a website of say type A or type B maybe
one is the old website and you let them loose and you find out how people react to the different websites this is a
little tricky but I want you to think about this we will not spend a lot of time on it in manufacturing unit three
parts of an assembly are selected we are observing whether they're defective or not defective determine the sample space
and the event of getting at least two defective Parts um what is the question that I'm asking the question that I'm
asking asking is here's a situation there are three [Music]
parts for these three parts I'm interested in knowing whether they're good or
bad the question is asking this describe for me all the possibilities which is what the sample
space is so what are the possibilities don't talk about probabilities now just talk about the
possibilities of what could happen we'll talk about the probabilities later all three could be good all three be okay so
all three could be one way of doing it is this all three are defective two of them are defective one of them is
defective and none of them are defective if you do it this way the sample space has four objects in
it correct that is one way of describing it one minus we haven't yet gotten to
probability but yes if you get to it you know it'll it'll be one minus that and the event of getting at least two
defective parts means two defective or three defective three defective which is good so this is
a this is this is one way of describing the sample space this is not the way the sample
space is typically described you're not wrong but there's a problem and the problem is this so let's
suppose I describe it this way in other words now I describe my sample space as let's say zero
defective one defective two defective and three defective let's say these are my
possibilities if I do it this way and this two defective thing is here now if I do it this way I will eventually have
to get around to calculating probabilities and let's say I want to calculate the probability of let's say
this event at least two defectives now how will I do that calculation now what happens is the way
the probability calculations are done is that you you try to split this up and say that I'm going to find the
probability as the sum of individual outcomes as the sum of individual events I'm going to split it into individual
components and then add it up so therefore I will ask for you therefore what is the probability of two
defect and what is the probability of three defect and what is the probability for
example of two defects so let's say I want to find now what is the chance of two defects how will I
find that how will I find the probability of there being two defects in this
situation yes and how will I how will I how will I do that calculation 1 and 2
and there is no see there is you have not allowed me to even think think in terms of 1 2 and three there is no 1 2
and three there's only zero defective one defective two defective or three defective your sample space has lost all
identity as to which one is defective so do you want to revise your opinion of what the sample space
is what do you want to Define it now as ah correct so what you can do is you can Define your sample space not in
terms of the count of defectives but in in terms of whether each individual item is actually defective or not correct in
other words what you're doing is you're essentially saying let's say good bad or good defective or G what does this mean
the first is good the second is defective and the third is good if you do it this way how many elements are
there in the sample space eight because each of these can be good
or good or bad these are your eight possibilities now from this what can happen is using
these events you can now add them up now what happens is if I'm looking at let's say two
defectives which ones are relevant say this one is this has two defectives this has two defectives
and so three of them have two defectives in it correct one of them has no defectives three of them have one
defective three of them have two defectives and one of them has all defectives so this is another way of
writing the sample space what this will do is this will allow the calculation to be a little
easier and your objective is to be able to make the calculation a little easier so in this particular case for
example just just to get the calculation out of the way let's suppose that the chance of a
defective let's suppose the probability of a single defect let's say is
20% let's say 20% there's a one in five chance that my unit is this seems too high you won't
survive let's say 10% one in 10 is defective one in 10 is
defective if one in 10 is defective the probability is now 10% then what are the chances of all of
these I'm asking for a common sense answer to the question we'll get to the concept A little later one would be
defective so the chance you understand the chance that a single one of them is defective is
10% the chance that a single one of them is defective is 10% and let's say that I want to solve
this problem what is the problem the event of getting at least two defective Parts in
other words I want to find probability of let's say two defectives what is
this let's work it out it's a good example to work out we we'll understand many things as we do
it the chance of a single defect is 10% I'm asking for the chance that I've
drawn three of them and that I will see two things two of them being two defectives this needs a little bit of
work let's do this patiently let's let's work this out right now the chance of two
defectives can happen in how many ways we just saw it right now let's suppose that I want to
calculate the chance of three defectives to calculate the chance of three defectives here is what I claim I
can do I can add up the chance of these three right equivalently I can do it this way probability of two defectives
is equal to probability of gbb or b g d or DD G is this
correct there are only three ways in which I can get two
defectives you're okay with this okay now I'm going to do something really interesting I'm going to write
this as P of g d d plus P of d g d plus P of ddg now let me explain what allows me to
do this what allows me to do this is the fact that if this
happens these two cannot happen they are mutually disjoint both cannot
happen together which means that if I draw a picture they're like this so if I want to find the chance of
being here or here or here I can simply add up the chance of being here plus the chance of being here
plus the chance of being here why can I do that because they're disjoint there is no common
thing if this happens then this does not happen these are two separate things
disjoint okay now let's look at each of this probability of g d and D this is what event the first is good the second
is defective and the third is defective I'm going to write this as P of G multiplied by P of D multiplied by P
of D I'm going to multiply I want yes I want yes because I want to use a technical term here and
the technical term that I want to hear is independent independent
means that the whether the first is good or bad tells me nothing about whether the
second is good or bad they are independently good or bad this is an
assumption but I think the problem allows me to make that assumption I'm making a part it's good or bad I'm
making another part good or bad and these are independent of each other I'm trying to sell a product to him and to
him whether he buys or not is independent of whether he buys or not that's an assumption it may be true
let's say they're from two different neighborhoods or maybe if they're neighbors and I'm going from one house
to the other maybe it is not independent maybe if he buys he's more inclined to buy so Independence is an
assumption in this case I'm making that assumption when events are independent I can multiply the
probabilities what does that mean for example let's say that he will buy a product for me let's say 10% of the time
in other words for every 10 people I want to sell my product to only one person Buys so there's a 10% chance that
he will buy my product and let's say there's an independent 10% chance that he will buy my product what is the
chance that they will both buy my product 10% multiply it by another 10% so first he has to buy that's a 10% and
then his 10% will be like 10% of that so 10% to 10% there's only a 1% chance that they will both by my
product multiplication is allowed when things are independent so Independence means that
the probability of both of them happening or let me re let me rephrase the question in this way let me write it
as one more step let me write this as probability of G and D and D I'm going to write this
g d DS as G and D and D which means the first is good and the second is bad and the third is bad this and I will now
write as g into D sorry into probability of D in other words if there's an
and then I can multiply when if things are independent these laws will be clearly written later
so if things are independent I can multiply if there is an
and if things are disjoint then I can add when there is a or common sense
rules but they require a little bit of sort of logic in calculating so I'm going going to take
this on take this to the top now this is going to be what this is going to equal p of g into P of D into P of
D plus P of D into P of g into P of D plus P of D into P of D into P of G now what
is p of G .9 90% .9 into
.9 into plus uh very right clever thinking into
three ah you guys are ahead of me here 3 into .9 into .1 into .1 even more generally let me even let
me be even smarter than you are I'm going to write this as 3 choose one
into 1 to the power 2 into .9 to the^
1 it's a sightly sophisticated we have writing the same thing
correct why did I write it as three choose one because why was it
three how many ways could there have been two defectives out of
three so correctly speaking I should actually have written this as three choose one or three choose two because
either I can choose it as one good or I can say it is too bad so three choose two is the same as
three choose one whichever way you want to write it so maybe a slightly better way to do it would be to say this is T
choose two what are these two the two bad defectives out of three what is this 0.1 the chance of a
one defective what is this two there were two of them what is this 0.9 the chance of the good
right so how many Goods how many bads were there two how many goods were there one in how many ways could I have chosen
two bads out of three three of them right this is the
answer this is an example of a distribution called the binomial distribution which we'll
see and this calculation you don't need to calculate your python will will do for you like all good
things right look and feel for many of these classes see it once understand it and then you know ignore it huh because
someone else can do the calculation for you we'll do it not to worry we'll get to it after the but what is the
answer 3 into say1 into .1 into .9 somebody tell me what that is I've got no
idea 2 point 4 2.43 2.43% 0.02 43 this
number someone verify on there 0.027 okay and about 2% 2.7% or a little
over 2% that is the chance of seeing two defects when there is a when the chance of seeing a single defect was
yes so now this is as you can see this calculation is not about defects or anything of that sort this is just a
counting argument this is just a counting argument so for example I could have
asked the question um that I'm I'm trying to sell a product to three people my chances of success is uh is uh
I don't know um 10% what's the chance that I'll be able to sell to two of them
today I'm going I'm a salesperson I know I can call upon I'm going to three houses
today let's say that I sell children's books I've gone to schools I've set up my stall Duan and there I've got three
addresses of parents who have been kind enough to say please come to my home and you know I'm willing to listen to you so
now I have on my on my cell phone three addresses I'm going to go to today I I know that my chances of selling this are
not good optimistically even 10% which means that if I try to sell to 10 people only one will probably buy so my chances
of success for a single person is about 10% so now I can ask myself what is going to happen at the end of today how
many will I sell what is the chance that nobody will buy what is the chance that one person will buy what is the chance
that two of them will buy and what what is the chance that all three of them will buy so what is the chance that two
of them will buy 2 2.7% there's only about a 2 and a half% or roughly 2 to 3% chance that I'll end
up with two of my of these people buy not no I for me I Define 10% as buying so which is I'm I'm saying that
this calculation doesn't depend upon whether is defective whether is buying anything what it depends on is the
probability of an event and you're asking the question how many times will this happen and that can be a defective
part that can be a sale that can be the loss of value of of a portfolio that can be the attrition of a of a person that
can be a hit on a website that can be a clickthrough rate it can be a very small number for those of you who are in
digital marketing what's a typical CTR what's a typical click-through rate any of you with that
industry so what's a typical clickthrough rate for for you website
clicks huh email clicks but what's a click through rate so what a click through rate typically means is of the
people who pass through an application for whom the application is an image in other words an impression as they say
what percentage of them actually click on it this is very important for digital marketing you so you're showing ads all
these websites come with ads Etc someone's paying for those ads and they want to know what the click through rate
is when I see the ad what percentage of people click on the ad and it's typically a very small number have you
ever clicked on an ad no most normal people don't but people still advertise people
still advertise clickr rates is very small let's say clickr rate is 3% let's say that means three out of a, people
can be expected to click through now I can ask the question for example that if I I want to have let's say you know so
how many Impressions should I have that depends on how many clicks I expect to have I expect to see so if I want to
have let's say 100 people clicking on my ad that gives me a rough idea as to how many how many I should reach how many
Impressions I should be I should be having I can also answer a question like this what is the chance that I will have
more or let's say less than 100 people clicking so you can ask the question what is the chance that less than 100
people click in a month how do I calculate that with this I can because what I need is I need an
estimate of how many Impressions there are in a month from that that is shall I say my n
now if that is an N I can then calculate yes this we
are yes all def I could have if I wanted to do at least
two right if I was solving this question at least two then you're absolutely right I should have added the last one
there's a question of so I've written it as this probability of two defectives if I did it as at least two you're
absolutely right I should have done that I could have done that sir how do you define this impression I'm not an
impression is basically the the so on a website if you see the ad in other words for a session so someone has gone to
that website and that ad is present on that website at that point in time that's an
impression if someone has actually clicked on that ad in that session that's a click so the click through rate
essentially is if I'm showing you the impression are you clicking on it so I can look at the number of
Impressions because basically that's that's the number of times that website has been visualized and that ad has been
on it I can also calculate the click through itate how many people are do are looking at that and now I can ask the
question what is the chance that I have less than this so so then what would I do I this number would be let's say the
number Impressions this would be say 100 or and this would be say my click
through rate and this would be my 1 minus my click through
rate so my 03 to the power say 100 those 100 people who clicked the the 19 the the the the 100
the number of Impressions minus 100 people who did not click and the number of ways in which I can get get 100
people out of let's say I don't know a million impressions I do a calculation like that I wouldn't do it I'd get
someone to do it for me so this is where we are heading now I'm going to slow down a
little bit take you through this conceptually just just to get these terms understood
slightly so first of all what is a probability a probability is a number between 0 and one it is often calculated
as a ratio the number of ways that is fa able divided by the total number of outcomes this is not the only way of
calculating a probability and it very rarely works but it is often a conceptually easy way to understand it's
a number between 0 and one zero means impossible one means certain the probability is a pure number it doesn't
have units the philosophical question of is the glass half full or half empty types
of probability different ways of doing it now here's what I was talking about as mutually exclusive events these are
two things that that have nothing in common mutually exclusive they exclude each other out an example if you're
drawing from a deck of cards you can either draw a king or you a queen or neither of them but if you're drawing
one card you cannot draw both a king and a queen just like if you're drawing a a
part it's either defective or it is not defective if you're a physicist you would think of Shing as
cat hm and so physicists have a lot of fun with this you know the story of shing's cat
right so shinger gave an example of a cat saying it's like the position of an electron so there's a cat in a box um
and this is very unfortunate for the cat and there's a vial of poison now that vile of poison is a
little unsteady so it could fall down it could break open and if it does then the then the Box fills up with fumes and the
cat dies so you know that there's a box of Po there's a vial of poison in the box
and there's a cat now the question is is the cat dead or alive it's a closed box you know that
there's poison in the box and there is a cat question is is the cat dead or alive and the answer
is you do not know until you open the box now if you open the box you can see whether the cat is alive or
dead this called collapse of the wave function in quantum physics which means that the event has
already happened but until the wave function is collapsed you do not know whether the cat is alive or dead if you
can observe an electron the electron is here but if you're not observing the electron you don't know where the
electron is it could be here or there or anywhere so the electron is buzzing around the room in physics this is an
important idea and a lot of probability theory has come from physical considerations if things are mutually
exclusive you can add of the probability as we had said this is king or a queen what about two independent events two
independent events are events such that if one of them happens then it no way influences the
occurrence of the other one in other words if he buys then nothing about it if one of them is defective it says
nothing about the other thing being a defective so let me ask you a question now let me go back to my previous
picture of mutually disjointed events are these two events independent no why are they not
independent yes if I know that the king is drawn I know something about whether the queen has been drawn or not I know
in fact that the queen has not been drawn these two are most certainly not independent so please don't confuse
these two concepts so you are talking about the next event for the next no I'm talking about the same event I'm talking
about King these two events so for example if I talk about let's say one particular one particular unit being G
or D good or defective if I'm talking about one of them then the picture looks like
this it can either be G or it can be D it cannot be both this is for one of them but if I am
talking about two of them then say this can be G1 and this can be say D2 in other words the chance
that the first is good and the second is defective now these two are no longer disjoint why because both these things
can happen together it is quite possible that the first is that the first is good and the second is defective that's quite
possible but they're independent independent means if I know that the first is good it tells me
nothing about whether the second is defective or not so if your picture sort of
intercepts then you know that you cannot add up the probability in fact you know a little
bit more you know that if you want to add up the probability you can but you have to somehow take out this little
common part so dis joint two separate things you add it up it's a
or this or this not both if such a situation happens you can add the probability up and you can also
add up but you need to assume Independence we
will break all these assumptions soon this is the simplest possible way to do calculations I have to get to a a little
bit of a nightmare called base theorem rule for comput rules for computing probabilities this um language here cup
and cup cup and cap language there's some set theory um some people find it comfort in
to see that language others find it complicating uh it's called the union so Union
means so Union in general means the collection of two things so you know those let's say
this this is a and b probability of a or b
if there is a common part then probability of A or
B is equal to probability of a plus probability of B minus probability of A and
B the chance that both happens is the chance that one happens plus the chance that the second happens minus the chance
that they both happen if things are disjoint then this becomes zero because
I know that both cannot happen but in general this term stays this is called the
intersection they both happen simultaneously here's an example what is the probability that the
selected card is a king or a queen so this assumes that you know what a card deck is so 52 cards 13 uh four
suits so how many Kings Four Kings how many queens Four Queens so what is the probability of a
king 4 by 52 1 by 30 what is the probability of a queen 13 what is the probability of a
king or a queen 1 by3 plus probability of a queen 2x13 the other way to do it is if
you want to how many ways can you get a king or a queen eight ways 8 divided by 52 which is also same
number what about the second one what is the probability that the SL is a king or a
diamond so again there are two ways of doing this P of king or
diamond is p of king plus P of diamond minus P of King and Diamond this is let's stay on 52s this
is so this is 4X 52 1X 13 is also correct plus probability of diamond 13x 52
2 minus King and Diamond there's only one such card 1 by 52 this is 15 by 52 another way of doing it is
how many ways can you get a king or a diamond 16 ways the whole suweet of diamonds and there are three remaining
Kings or there are 13 k 13 diamonds there are four Kings
but I've double counted one of them in both so I should subtract it once second statement
and um remind me what the second statement was king or a king or diamond oh the the
question okay you're saying there's a king selected card is a king or a diamond
youve drawing one card at random from a deck of cards and you're asking is this a king or a diamond let's say I'm trying
to I'm trying to sell him something correct one event that I'm interested in is is he going to buy my product or
not the other interesting question is let's say for example is he an IT professional or
not correct now is there relationship between these two things not really but I may be
interested in the joint probability of them not because of this event but because I want to calculate another
event that's interesting to me which is if I know that he's an IT professional can I sell him something in
other words suppose it is not independent suppose I now know that
whether he buys my product or not depends on whether he's an IT professional or something else let's say
I'm trying to sell him a computer peripheral and I may be assuming that if he's an IT professional he may be more
interested in a computer peripheral if he's not he may still be interested but if he's an IT professional he may be
more interested in this particular peripheral in that case what I try to do is I try to I try to use one unrelated
event as information about another one in other words I'm saying it is not actually
unrelated so these ands become interesting so effectively how will my calculation go my calculation will go
this way say that if I want to find the probability that he will buy my product given that he's an IT
professional then my answer will be let me find the probability that he's both will buy the product and an IT
professional divided by whether he's an IT professional why let me first calculate the chance he's an IT
professional within that let me now find the chance that he will buy my product a given B is equal to a and b
divided by B this trick this trick is always used in analytics to say this and we'll do it
before I've received an email is it spam or not which means I need to find tell me
the words and I will tell you whether it is Spam so now I need to relate the words to
spam so I have two unrelated Concepts but what I want to do is I want to say that if I know one of them maybe I can
get some information about the other similarly here I'm this may be about a color and this may be about a suit but
if I know about one of them maybe it gives me a little bit of information about the
other we'll see examples later just thinking so what if there was an additional
question or diamond or both it can't be both because I'm drawing one card can be oh you're asking just about this that's
one 152 so what of the question was or what is challenging is that is this an
exclusive R he's asking is this an XR in computer science in other words he's saying that
when I say or am I excluding the case that both are allowed but you a
single no that confusion Still Remains if he's very py so he could say he's making a
distinction between two statements king or a queen king or a diamond or king or a diamond or
both and need to specify both and in that yes you are correct needs to be mentioned explicit
huh so his mind works in ways in which the default is the exclusive your mind works in ways in
which the default is not the exclusive but it's a valid it's a it's a valid criticism to make that that in English
language when you use it do you which or do you mean in when I say this in in
probability theory if I say a union B and if there is an intersection I include that
intersection set theory is not confused about this for set theory a union B is just
this set and if there is a common part that's in it and in it only once is this
region so what I did was we translated this into set theory and he's saying that maybe I should have been a little
more careful because there's a difference between this set and the following set which is just this part
and this part multiplication rule when things are independent I'm allowed to multiply
an example there are two subjects the chance that you will do well in one of them is 70% the chance that you will do
well in the other is 35 is 5% the chance that you will do well in both of them or a and be the corresponding grades is is
the multiplication of the two which is 35% here comes the interesting part what happens to events which are not
independent what happens to the or I'm sorry what happens to the multiplication and there are various
ways in which this two parts written so the currently the way the formula is written is a and
b is equal to e multiplied by a yes multiplied by probability B given a
this is the way this expression is written sometimes it's easy to understand this way sometimes it's easy
to understand this way probability of B given a is equal to probability of A and
B divided by probability of a I want to know what is the chance that b will happen when I've already been
told that a will happen so first I find what is the chance that a will
happen and within that I take the fraction of both A and B happening this is the same as saying the
Top Line A and B is equal to a given B this means what this means A and B is first a
happens then given that a has happened B has happened
correct if a and b are independent what do I know if a and b are independent then A and B is a into B of
B that means that if a and b are independent independent probability of B given
a no is equal to probability of B stare at that for a while if they're independent then this will become P of
B and so P of B given a will equal p of B but is this not exactly what Independence is if I tell you that a has
happened I have not changed the chance of B that is almost by definition what
Independence is that by knowing that one of them has happened has told me nothing about the second one one by knowing that
the first unit was defective told me nothing about the second one by knowing that the first customer bought my
product told me nothing about whether the second one will buy it or not so this these statements are
understood in different ways sometimes this is a good way to understand it sometimes this is
sometimes this is but this is a more general form for doing it we'll see example of this this
one needs a little bit of work to understand from a pack of cards two cards are drawn in succession one after
the other after every draw the selected card is not replaced so you're drawing one it's like a normal deal the second
one now comes after the first one what is the probability that you get both draws you will get
Spades in other words you'll get two Spades two draws two Spades what is what is the chance of
that so here's a structuring of the problem a is that the you get a spade in the first draw B is you get a spade in
the second draw so what is the chance of a the chance of a is 13x 52 is the chance of
the first one is a spade now I want to find a and b and the way I
do it is this what is the chance of a and then what is the chance of B given a in other words I've drawn a
spade and then what is the chance that I will draw a spade given that I've already drawn a spade the first time and
the answer to that is minus one because there are now 51 cards left in the deck and there are 12
Spades remaining so 12 by 51 so the answer is 13x 52 multiplied by 12 by 51 now what would the answer have been
if I had replaced the first card it would have been 13x 52 multiplied by 13x 52 because of
Independence I put it back right if I put it back when I put it back the second draw looks exactly like the first
one so knowing that I had a sped to begin with has been lost because I've already put that sped back in it is it
is a situation of independent experiments this one however is the case that the result of the first or the
result of the second depends upon the result of the first but isn't it like we are assuming
the second one that we have already picked the first one as a spade huh because that is what is being asked
for what is the probability that in both the draws you will get Spades so I'm drawing one and I'm drawing a
second one what is the chance that they're both Spades here's a here's a here's a
similarish question um what is the chance that I will get two adjacent two adjacent
seats on my flight if I don't pre-book yeah so it's a similar kind of calculation why is it a similar kind of
calculation same seat again so you want two adjacent seats but for two adjacent seats to be
picked by you those two there must be two empty adjacent seats now two adjacent empty seats means
what that means can you calculate that probability yes you can but when somebody books
seats let's say that one particular seat has been booked what happens to the probability of the seat next to it being
booked so so the probability of a seat being booked of a single seat being booked let's say is um making up a
number let's say 50% a single seat being booked is 50% now I'm telling you that a one
particular seat has been booked let's say you know 15a has been booked now I'm asking the question given that 15a has
been booked what is the chance that 15b will be booked will it be 50% will be more than
50% will it be less than 50% it'll be more than 50% at least if you're modeling
reasonably well it would be because a whole bunch of people will be booking pairs we'll be booking pairs so now if I
know that one seat has been booked if I know that 15a has been booked now the chance that 15b has been booked is going
to be more than 50% which means that my chances of coming late and finding two adjacent cat is going to go down because
I'm looking for cats that are unbooked the chances will be more right no the chances will be less
because as people book so people book adjacent seats more than at random so the probability of two adest
seats being booked is not the product of the individual seats being booked it's more than that so the
probability of me finding two empty adjacent seats is going to be less because I'm looking for empty
seats so here's an example of doing this conditional calculation um marginal probability is a
term I'll explain when I do the example so here's an example a survey of 200 families was conducted information
regarding family income per year and whether the family buys a car given in the following
table so the 200 data points 200 surveys have come and they've been distributed in a cross tabulation like this we did a
cross tab like this yesterday as well this is the cross tab one access is did they buy a car or
did they not buy a car the other is an income statement income below 10 lakhs or income greater than 10 lakhs now why
might why might I be interested in this data which segment huh to figure out who buy my who buys my
cars can be sold whether cars can be sold and whether that has anything to do with income and if it does have anything
to do with income then is high better or is low better I don't know so what I've
done is I've arranged my data in this particular way and now was asking a few questions what is the probability that a
randomly selected person or what is the probability someone is a buyer of a car it's a it's you don't even need to look
at the Full Table this is 80 by 200 h probability of let's say car
this is called a marginal probability why marginal because from the picture it's at the margin it's at the margin of
the table which is where the term originally came from this called a marginal probability there are many
things going on but you're asking a question only about one margin in this case the margin of the car you're not
interested in the income this is called a marginal probability what is the probability that randomly selected
family is both a buyer of a car and belonging to income 10 lakhs or above both buying a car and income 10 lakhs or
above 42 on 421 200 okay a family C random is found to be belonging to an income of 10
lakhs and above what is the probability that the family is a buyer of a car if the income is more than 10 lakhs
what is the chance of a car so this is probability of car given greater than 10
L 42 by 80 interesting 42 by 80 why is this you're you you're
right is 80 that's a sample size right
you understand the logic but that is exactly the same as this probability of car and greater than 10
LHS divided by greater than 10 lakhs why because car greater than car and greater than 10 lakhs is 42 divided
by 200 and greater than 10 lakhs 80 divided by 200 200 200 cancel out this again becomes 42 by 80 but the thinking
is absolutely right this goes in the denominator because this somehow says that out of how many people am I going
to select and then on the top is how many are both this is called a conditional
probability this is called a conditional probability by the way what is this number this is for example less than 50%
sorry greater than 50% what is the chance of buying a car which is about
40% that means if I did not know your income I would guess that your chance of buying a car is
40% if I did know that your income was more than 10 lakhs now your chances of buying a car went up to over
50% therefore it's worth my while to find out whether your income is more than 10 lakhs
because it at least by the sample data tells me that that's going to influence in a positive deduction whether you will
buy my product or not so I'll try to find out this is in terms of words this is
called a marginal probability marginal and this is a conditional you might have a a little
bit of trouble with these words but conceptually this is not very hard and so this is the calculation that
we just did Bas when he originally wrote this paper so he talked about it nobody
understood him only after he died did somebody find it in his papers and I said okay this is
going to take a long time and then they explained it to others let me explain what it tries to
do yes sir middle one What what is the is it or no on the board card car and greater than 10 lakhs it's fine you said
marginal probability and this this this one okay this one is a joint probability this is a
marginal this is a joint and this is a conditional so conditional is a joint by a marginal a conditional is a joint
divided by a marginal a joint is a marginal multiplied by a
conditional so the base theorems idea is the following what it does is it switches
which event is being conditioned on it switches between a given B and B given
a now when would you need to do this here's an example you want to find out whether the
the whether the email that you're receiving is Spam do you use Gmail Gmail often identifies things as
spam and moves them somewhere how does it do that partly it it looks at the Mals and
headers and it uses a very very complicated algorithm but let's suppose you are building an application of this
sort and you want to do it based just on the content of the email so you want a following kind of
program you want a program that says that if I know the words of the email I can tell you whether it is Spam
or not which means I want the following thing I want the probability of spam
given words if I tell you the words can you tell me whether this is Spam or not this is what I want to
do correct but how will I solve the problem I'll solve the problem by finding the
opposite conditional what is the opposite conditional the opposite conditional is what is the
probability of words given spam now why do am I interested in this
because this one is easier for me to do in the following sense what I can do is let's say in my research lab I can
collect lots and lots of documents and I can identify them as spam or not spam in other words I can
manually go in and I can tag them so let's suppose that I've looked at a thousand of these and I've targeted
let's say say say 800 of them as spam and 200 of them as normal spam or maybe I go after things that are spam and find
5,000 of them and go after things that I know are not spam and find 5,000 of them now I can solve the opposite problem
which means that if I know that it is Spam I know the distribution of words and if I know that it is not spam I know
the distribution of words I can do this inside my analytics environment so now I know that if it is
Spam this is what the distribution of words looks like if it is not spam this is what the
distribution of words look like using that I will now twist the problem and say now if you give me the words I will
tell you whether it is Spam or not now how do I do that I do that doing this now this is a very easy formula to
understand why because this formula essentially says this that why is why is this equality true this equality is true
because let me rewrite it slightly let me say what is the probability of let's say
spam and words what is the chance of spam and words in other words there is an and there now
I'm going to write this Like A and B but here's the interesting thing when I wrote I can write a and b in two ways
I can write it as B multiplied by a given B but I can also write it as e
multiplied by B given I have a choice as to which is first and which is
second so therefore I can write this in two ways I can write this as spam given
words multiplied by words but I can also write it as words given
spam multiplied by spam do you understand the trick but what does that mean that means
these two things are equal no if these two things are equal that
expression now follows now I know that probability of
spam given words is equal to the probability of words given spam multiplied by probability of
spam divided by probability of words so to execute on this what do I need words given spam which I told you
what to do probability of spam which is an estimate of the proportion of emails that are spam or not
spam and probability of words that has no conditioning in it this is what's usually called a
lexicon or a dictionary so if you give me a dictionary of the language I can give
you this denominator if you give me shall we say an IT estimate or a sociological
estimate as to the proportion of words or proportion of emails that end up being spam I can give you the
probability of spam and if you give me things Tagg does spam I can find its dictionary distributions if you give me
things that are TAG does not spam I can find it so therefore I know the right hand side therefore I know the left hand
side and now if you give me the words I can tell you the probability that it is Spam so it's either thought of in the
way I just described it which is sort of flipping these two probabilities sometimes it is described
the following way spam given words is an update of just probability of
spam this probability of spam part is sometimes in beian language called a prior and spam given words is called a
posterior which means that if I know the words I have a greater idea as to whether it is Spam or not if I know his
income if I know he's an IT professional I have a better idea whether he'll buy the product or not if if I know the
income is more than 10 lakhs I have a better idea whether he'll buy a car or not if I know the words I have a better
idea whether it is Spam or not and to do that I flip it this way and because of applications like
this base theorem has become very very Central to machine learning because for
example think of the autonomous car what is the autonomous car's decision problem something is crossing the
road should I stop in other words given cow should I
stop now think of the think of the the problem that has to be solved to do that I can flip it now to flip it means what
to flip it means essentially flip it by saying cow then stop essentially I now have to tell the program so so I I say
stop given cow so now I to solve it by basum cow given
stop so I need to say these are the situations in which a car is stopped and these are the situations in which a car
has not stopped so in a stopped situation look at what that car saw and in a not stop situation look at what the
car saw like spam and not spam and now I can flip this and say therefore if this is
what I saw I now know whether to stop or or not it's a neat little
logic so this is this is what base theum essentially does so it will be a foundation to supervis learning right it
is one way of doing supervised learning it is one style of doing supervised learning and there are um there are
supervised learning algorithms that are explicitly this for example beian belief networks but
BBN there's some supervised learning algorithms that are this but aren't explicit Bally so for example linear
discriminant analysis where what you do is you find the posterior distribution of being in
this class given the data and so this class given the data is written as you know class given
data so and vice versa so there are at least two of these algorithms that you will study later distri analysis is one
and I think BBN I don't know where cul but in general you will find it to be a very useful trick I'll come back and
I'll show you the the theory behind it if you're interested but this is actually all
that's that needs to be remembered for its application so the question is an
autonomous car his question is why don't I do the simple thing of saying that if you see something
stop now from a for a computer following that logic the computer now has to know what should I
do when I see something not if I see something and stop so it could say if I see something on the road
then stop it'll then ask what happens if I don't see something I should keep
going so this becomes a very simple rule that says that if I see something stop if I if I sort of don't see anything
stop now what will this do to the car it won't stop in a signal so so this is a translation of a rule the difficulty
will be the following and you can try doing it the difficulty will be that what precisely will the car see and it
will follow that logic explicitly so if it sees a car that is coming quite far ahead it will stop you could say I'm
going to draw threshold if it is further away from this in front the car in front then
don't stop because you're expected to see a car in front and so if you're seeing a car in front please don't stop
because something is in front but you now have to encode that and so that way of doing things is
entirely feasible so for example there's a there's a whole branch of learning called case-based
reasoning case-based reasoning and case-based reasoning essentially lies on that give me all the cases and give me
the reasonings for all those cases but case-based reasoning sometimes becomes difficult if it becomes very
very difficult to enumerate all the possible cases for example example in the spam
problem I have to solve this problem for every conceivable word that the email might
see because email is going to decide based on the words and if you do if you do do a full
case-based approach if the email sees a word that it has not seen before the email will say what do you want me to
do so typically when ban methods are used when it sees that word it'll do precisely nothing in other words it'll
say if if certain words are there I will update my decision if those words are not there I won't it's irrelevant to it
there's no evidence that it has so the other is a probabilistic way of thinking that base theorem or any of
these related and this is probabilistic learning that when you do some when you when a when an autonomous system or any
machine Learning System decides then what does it decide on so you'll often find in data sets the
following situation I I should have had an example I pull it up all the X's are the same but the Y's are
different all the X's are the Same by the wise are different two people have exactly the
same characteristics but one has bought the product and one has not bought the product two people applying for a loan
have given you the same information they come from the same Village they have the same income they have the same you know
family circumstances they grow the same crops one farmer has replayed the loan the other farmer has
not H car being tested out there's someone crossing the road identical scene one test driver decide to stop the
other test driver decided not to stop same X different Y what should the computer
do now think of this from a computer's perspective what is the computer's problem the computer's problem is if you
give me an X I will give you a y now what do you want the computer to do in this particular situation because
in your real data the same X is leading to different Ys what's an ideal solution here what would you do how would you
think through this problem one possibility is to give it a probability that's one approach to the
problem what that means is this that in your data set let's say half your people who have seen this X have given a y of
zero and half your people who have seen this data set have given it a y of one the computer literally tosses a coin and
decides which one to predict that's called a randomized response and sometimes it's done but
that could be a disaster as well I'm sorry that could become a disaster as well it could but what would what give
me another alternative safest alternative we could go for right which is safe how does a
computer know that what condition is giving the same X its input is identical but action what are the
consequence of this action stop anything happen see that consequence has already been worked out by in
nature in nature if that consequence was there that would have already have been baked
in so if there is a consequence to it and if there was a good consequence and the test driver would have stopped in
all cases the cas driver would have stopped no the action of stopping of stopping going yes take that and
discretion which is more fatal going is always fatal stopping is fatal that that that decision would have been made by
the test driver as well would it not have been the raw data would also have shown
that bias or are you teaching a computer to have a sense of value that the real
human did not have two doctors look at the identical medical report one doctor says cancer
the other doctor says no cancer you are building an AI system for medicine what should it
say go for another test go for another test okay always you should see that you
should see a very nice video uh of Watson you know what Watson is you should see the Watson videos if you
haven't seen it and you want to be a AIML professional or an ml professional then you should see the Watson
videos wonderful videos and you can see you can see the the decisions at at the bottom you can see the um you can see
how Watson decides you know what whatson this is the Jeopardy videos so whatson playing
Jeopardy and so some Jeopardy is a quiz question in which basically the answer is given and you have to sort of say the
question or something of that sort so when you see the video you'll see at the bottom you'll see a bar and that bar is
basically a set of probability statements as to How likely is this the answer etc
etc and based on those probabilities Watson gives an answer and sometimes Watson does not give an answer because
it is unsure of even its best answer so you should so when you watch it watch the watch the bottom of the
screen the data that Watson is answering based on this particular we have doing
but in general this problem is a hard problem in machine learning because in the real world you will have this issue
if this was not the case if it was the case that that identical values of X give identical values of Y the machine
learning problem would be a mathematical function fitting problem it would be a problem of simply saying if this is the
x match map it to the Y just find the rule that Maps it to the Y it's not and the reason is not is because identical
inputs do not lead to identical outputs and resolution of that has many many um procedures and possibilities for
doing that one of them is a probabilistic way of doing things to answer the following question I will not
tell you whether Y is zero or one I will tell you what is the probability that Y is
one I will not tell you whether you have cancer or not I will tell you what is the probability that you have
cancer I will not tell you what the probability of hitting something will be if I continue not answer it's not a
definite answer I'm asking for a zero or a one and I'm not giving you a zero or a one I'm giving you a
probability so at every time the car when it is driving is calculating a number given the scene what is the
probability that I will hit something continuously based on what it is seeing now you decide based on that probability
whether you should stop or not based on you know your risks Etc the the learning system does not do that the learning
system does not say whether you should be diagnosed with cancer it simply says what is the chance that you have cancer
now you decide based on your logic as whether that's enough for me to State whether you have cancer or not the
learning system will not say what is the probability that you have defaulted on that that it will not say whether you
will default on your loan or not it will say what is the probability that you will default on the loan now you decide
how much risk you will bear that's U one solution to the problem it doesn't even try to predict
the right answer it simply gives you a distribution on the possible
answers now you decide as I said if you see the Jeopardy videos You'll see this in
action you'll see the the data on which it does the category is 19 Century novelists what Watson wants to do then
is preserve the lead not take a big risk especially with Final Jeopardy because just like for humans Final Jeopardy is
hard for Watson now we come to Watson who is brand stoker and the wager hello see the full video
973 total of [Applause] 77,4 I would have thought that
technology like this was years away but it's here now I have the bruised phenomenal why someone on a terror
Watson look at that what it's doing is it's given probabilities on the
answers H these don't add up to one these don't add up to one but what is the chance that list is the right
answer what is the chance shopan is etc etc this number if it is below this threshold whatson will say pass it won't
answer and it's there in the video a few number of times it doesn't know but it says that if I am more sure than a
certain threshold and if I'm uniquely sure it will also not answer if multiple of these cross
here which means both of them are probably right and I don't know which is right they both sound correct to me
again I might stop so for each question what will check the what is the probability of the he'll do that every
question based on hearing it so if probability is done by Python language or any of machine language thing then
what is that we are here for meaning what is our role in deciding that deep philosophical questions why are we why
are we existing at all H why why are we here at all so so yeah yeah yeah so um so one one reason you're there is to
provide test data to the system or what's called Ground truth in words you need to give it
spam and you need to tell it once that this is Spam just like he's saying I need to
tell it to stop I need to say that this is a dangerous thing so so human needs to initiate that but yes people are
asking that question a lot that is that human initiation necessary now the trouble with that is
that the the the value system that is necessary to decide that this is a good thing or a bad thing is something that
computers do not have and it's extremely difficult to encode that it's a lot easier to encode in a computer in some
way this is good or this is one decision this is one decision and also if you want to encode a cost to it and if I do
this this is what cost reinforcement learning does this if you take a wrong decision there's a penalty function that
hurts the computer in terms of an objective and the computer knows that if I want to reduce shall I say that pain
factor I should avoid doing this like babies learn that's called reinforcement learning I don't know whether you'll do
much reinforcement learning in this course or not but you will do that so you you so you so you so you build
algorithms of that kind there will come a time where that will not be necessary for us it is not necessary but
even we even humans have to come with our genetically coded information we also cannot begin from
scratch we already come coded with this there's a school of thought that says that that's all that there is that this
information is passing along in other words um a hen is an egg's way of making another
egg so an egg wants to make another egg right now how does an egg make another egg through a hen it makes a hen and
that hen makes the egg another egg right so which means that there is a basic information content the genus trying to
say I need to survive so there's a sequence of acds and G's that has a survival
Instinct and the only way it can do that is to get another organism to create a copy of it viruses do that
brilliantly right the big war going on on planet Earth for a few billion years and still continuing it's a deadly War
it's called no winners and is going to continue is a war between bacteria and viruses nobody
wins right these two are at each other for donkey ears because they have two very different ways of dealing with
information right a virus is retrovirus type thing a virus is basically just DNA with the protein around it the way it
reproduces is like certain Birds we learn in mythology that information gets into another organism typically a
bacteria so a virus forces a bacteria to make another virus and obviously the bacteria doesn't
like it and so the bacteria over billions of years have figured out how to prevent
doing this and viruses have consequently adapted and have repeatedly kept kept doing
this and so information transference has a long long history in the real world in the in the in the Computing world the
challenge of saying that how do I input the information how do I get the machine to learn is something that we are
rapidly evolving in the reason this this current generation is so excited about it and I I'm not that old but even in my
career and I've been doing this for I don't know about 25 years or so roughly speaking I've seen three or four waves
of it you know goes up it goes down it goes up it goes down and different the current version of it essentially is
based on certain deep learning algorithms that have come and have made it a lot easier to feedback
information so you know recurrent neural networks con all these neural networks now have the ability to feed context and
feed information a lot more efficiently which means this idea that a computer can pick up context and use it to get
better algorithms is there uh and that scares a few people mightily because what it means is that
as a car keeps driving very well it's knowing that it's driving very well and it'll keep doing certain
things so so the school of thought that says that therefore maybe the car should have a few
accidents just like maybe there should be a few nuclear explosions let's suppose that you go and
get an HIV test done HIV tests are routinely done let say you have surgery or anything like
that Etc HIV tests are done so let's suppose that for whatever be the reason an HIV test gets done and the test turns
out to be positive I hope it never happens to you but let's suppose the test turns out to be positive the
question is how scared should you be very that's a reasonable answer but let's work it
out so to do that trying to calculate the probability of
HIV given positive test this is what I'm interested in calculating because my life may depend
on it there are many ways to do this here's a suggested
root now what I'm going to do is I'm going to write this version of the formula
down H without necessarily and you'll see what what it means here so what I'm
going to do is this I'm going to write this as probability
of HIV and plus divide by probability of
positive correct conditional is joint divided by marginal now I'm going to write the
numerator as probability of positive given HIV multiplied by probability of
HIV I'm going to twist it it here's why these are
numbers that are much more available to me what is this number this number
means that if I have HIV what is the chance that the test will be positive that's called the
sensitivity of a test a test maker has to report that this is the proportion of people
who have HIV this is the incidence rate it has nothing to do with me it's like my dictionary it's just the fraction of
people who have HIV so these are numbers that I know one from epidemiology and one from my test
manufacturer divided by positive and I'm going to do something very interesting on the
positive I'm going to write this positive in two ways there are two ways in which
someone can become positive HIV and positive
plus not HIV and
positive okay disjoint there are two disjoint ways in which I can end up being
positive either I have the disease or I do not have the disease now I can write this
as this side already calculated is the same number probability
of positive given HIV multiplied by probability HIV plus probability of positive given not
HIV multiplied by probability not HIV this is this formula just exampled
out we're going to apply this and see what happens let's what are the numbers that
I need I need a number of probability of HIV probability of HIV is a incidence rate for HIV what's a good number for
this 01 Mo okay let's say .1% that's actually very low the
HIV rate is a lot higher oh let's say 1% 1% 1% of people have HIV and 99% don't what this also means is that
probability of not HIV is 99% okay I also need a few other things
I need for example this probability of positive
given HIV this is a measure of how good the test is if you have HIV what is the chance that it will
report that you have HIV what's a good number for this
99% 95% what does 95% mean that if you have HIV there's 95% chance that I will find
it equivalently for 100 people who have HIV for 95 of them I will find it yes
can which one I asked this is this will come from the this is called a sensitivity number
it comes from the test a very good test may have this at 99% 99.9% a not very good test or a cheap
test test may have this at 90% I'm assuming that this test has 95% pick your own
number its sensitivity is 90% the other number is sometimes called specificity so for example let's say I go the other
way positive of negative given not HIV which means if it if you do not have HIV what is the chance that it will say
you do not have HIV again 95% again 95 in other words I'm I I have a fairly simp simp test
which is 95% accurate whatever your disease state is 95% of the time it will give you the
right answer okay now let me re askk the question I've given you a test that is
95% accurate I'm now telling you that your test is
positive what is the chance that you are HIV positive 95% that's a reasonable guess right let's let's work it
out negative not HIV is 95% so what is positive given not HIV
5% correct okay now I have everything that I need to calculate this what is positive given
HIV 0.95 correct into what is probability HIV 01 if he's given it as 1%
% downstairs again 95 into 01 plus what is this positive and not
HIV 05 multiplied by probability not HIV 99 correct someone please work this
out on a calculator or on what is collectively exhausted it is depend means together
they cover everything yes which means in our particular case you have HIV or you do
not have HIV there are no other possibilities they exclusive why because either you have HIV or you do not have
HIV yeah yeah that is huh but exhaust exhaustive events means there are no other
things so this uh B uh given HIV positive is 95 so yes because of that that 95 we are not calculating this
which one the last one 5% this 5% this is I think one minus this for not HIV if negative was 95% then positive will be
5% what is this number point I have two I have high variance in
my answers anyone
else 0.16 0.16 there's 16% chance you have HIV if you test positive why is it that
a fairly accurate test a 95% accurate test my wife and I have a have a have a biotic company we're trying to release a
product on molecular diagnosis for infectious diseases if we get 95% we'd be thrilled our investors would be
thrilled we'd be in business this is not easy to attain particularly cheap we're trying to keep
the cost of our test fairly low for things like UTI and stuff like that but so where is the problem SLE size
false positives 95% Pro but there's a there's a there is a there is a there is a
problem of false positives here um so another way of seeing exactly this same calculation or pretty much exactly the
same calculation is the following thing so I'm going to rub out base theorem here which is exactly this I leave it to
you to link this to bi etc etc but sometimes it's easy to just understand it as an example as how it's done but
I'll show it to you as I'll now show it to you as a picture I leave this here and now let's assume that I begin with a
population of maybe 100,000 people let's suppose that I've got 100,000
people who are are being tested let's say now of these 100,000 people some of them have the disease some of them do
not have the disease some will I don't the total is this is my sample space so to speak now let's say how many of them
have HIV 1% 1% so that's how many, so a thousand of them are here so
these are HIV and how many are not HIV 999,000
correct now of these 1,000 how many of them test positive
950 and how many test negative 50 okay of this 999,000 how many tests
positive and how many tests negative so these guys should test negative so what is 95% or what is 5% of
99,500 of 999,000 4950 is 5% so 5% is a wrong which means 4 4950 are
here this is 5% of 999,000 and so how many are now here negative
94,000 about that 95,000 this number won't matter much anyway so
you're okay with the situation here now let's look at all the people who've tested positive where are all the people
who have tested positive these guys have tested positive and these guys have tested positive so
how many people have tested positive in all so 950 plus 4
4950 of them how many have the disease 950 calculate this this is exactly the same
calculation you did before arithmetically it is the same calculation 4950 is the cprit
here here 4950 is the culprit what does that mean it means that there were a lot of people who had a false positive now
why was there are a lot of people who had false positives because there were a lot of people who did not have the
disease for that large number of people who did not have the disease only a few positives will swamp the positives of
the people who had the disease which means most of the people who are testing positive are actually healthy
people who have had the misfortune of the test going wrong on them but because there were so many of
them it affected the probability so if it is an epidemic for example which is not very rare then I
think test is no but what is it for you so so what is the moral of the story now so therefore what will happen let's say
therefore let's say you go and let's I'm pretty sure this hasn't happened but if somebody gets a positive HIV test what
will the doctor say check one more get a retest done
why because let's suppose this is my test let's suppose this is my test and let's suppose now I've changed the test
to saying that I will say you have HIV only if you test positive twice in a row you test it twice and both times you
will end up you show up positive now what happens to these numbers what is now the positive given
HIV and what is now negative given HIV first of all what happens to what happens to this what happens to the What
is the chance of a false positive now so the chance of a false positive which was previously
5% now become yes now becomes you must it must go wrong twice so 05 into
05 and then one minus that 5% of 5% 5% of 5% is what it's a quarter of a percent or something like that or even
less maybe that becomes now a very large number so this number becomes much smaller the chance of a false positive
becomes much lower and because the chance of a false positive becomes much lower this number becomes a lot lower
and now the number begins to approximate what you think it would but for this to work I must be able to multiply the two
probabilities that both tests went wrong that multiplication comes from Independence which means the second test
that you should do should be from a different laboratory which would have its own biases it'll have its own
problems but they'll be independent of the first guy and you can multiply this out and this problem will go away if it
doesn't multiply out this if the same result happens in other words if the same thing shows up
then this5 will not go down so now this difficulty with based rule this also again for example this
shows up in many things even in even in business so if I if I'm trying to detect let's say
fraud I'm trying to detect fraud and I and have a fraud detection I'll go and I now say if I see this signal what
is the chance that it is fraud by base theorem that will be low the reason that will be low is
because most transactions are not fraudulent transactions and so even if there is a
small possibility of detecting a non-fr fraud transaction as a fraud transaction I have messed up my
algorithm does it mean if we run it twice we give the accur you have to do the test independently
running the same program twice will not help you huh so in the biological example you
need to run it again for in a different test in a in a in a machine learning situation what does that mean it means
you have to give it fresh data different data from the same situation shall we say which is a little
harder but that's fine so this is base theorem sir that last World and spam problem
how does it kind of map to this how does it map to this okay well it looks it looks completely different does it not
ah okay we'll do it this way what is the proportion of spam and not spam let's say this is
Spam and not spam H what is the prop so I need to know this this is the proportion of
things that are spam and not spam independent of what is in the text what's the proportion of emails at our
spam what do you think 5% huh 30% of spam okay you guys know your
inbox it also points to a healthy social life right so now what now let's suppose that we fix the problem and I'm going to
solve the problem not for not for words but for one word
so what's a Spam like word for example by congratulation
congratulations right okay okay P cool congratulation H so
now so now I want probability of congratulations given spam
what is probability of congratulation given spam if congratulation is there then if it is spam what is the
chance of the word congratulation will be there 100% that's little to
huh 75% let's say let's say this let's say this is
75% right then what else do I need because what is the problem I'm trying to
solve huh so I'm trying to solve the following problem I'm trying to find probability of
spam given congratulation this is what I want to find I want to say that if I see the
word congratulation what is the chance that this email is Spam that is the problem I want to solve now to solve
that I'm solving the opposite problem I'm saying what is spam what is not spam what is congratulation given spam and I
need and I need one more probability congratulations congratulations not
spam what is this 25% not necessarily one minus this this is a separate calculation but it
could be 25% if you want to let's make it 35 h huh which means if it is a genuine
email if it's not spam there's 35% chance of the word congratulations will be there now I don't need to make this
up as I said in a laboratory I can look at all Spam things and I can count how many times congratulations shows up in
it so now let's suppose let's suppose this is here let's suppose I know this now can
you do the calculation you can do it using base rule you can do it using the drag diagram if you want to just try
what is the answer so what we are saying that congratulations not 35% that is know
these four numbers are known to you well actually you know these are the same number so three numbers are known to
you if it is Spam then the chance of congratulation is 75% if it is not spam the chance of congratulation is
35% now I want to find what is the probability of spam given that there is congratulation now how do I how do I of
four three are known right all four are known this is my shall we say the information that's available to
me some of you can try using the formula some of you can try using the picture so if I do it using the
formula what will it look like spam given congratulations
is equal to probability of congrats I'm going toize this spam multiplied by
spam divided by probability of congrats given spam multiplied by probability of
spam plus probability of congrats given not spam multip IED by probability of not
spam this and this is what congrats given spam
is 75 into probability of spam is3 divided by 75 into 3 plus congrats given not
spam 35 multiplied by not spam is 7
point no is it 47 or you might want to draw a picture
like this like we had drawn before begin with another typical number let's say 100,000 you'll do it as spam not spam on
the spam side this is 100,000 emails on the spam side how many will there be 30,000 on this side
70,000 on this side how many will have congratulations this is on the stamp side 75% of them will have
congratulations so 75% off 30,000 that's what 22,000 500 or something like that and the remaining will not have
congratulations how many here will have congratulations um for not spam 35% of 70,000 what is 35% of
70,000 huh 24,500 and so what is my answer
22,500 divided by 22,500 + 24,500 which is presumably my 47% you can do this as
well so without opening the email without opening the email and
seeing the email the chance that it is Spam is 30% but if the word congratulation is
there in the email the chance that it is Spam has gone up to 47% now you would not do this just for
congratulations you do this for a whole bunch of words which means that instead of
congratulations congratulation and something and something Etc which means that instead of congratulations here
it'll be congratulations and something and something and something here which means for these probabilities you will
need to say congratulation and something else let's say another word what's another
word offer so you would now say what is the probability of spam given congratulation and offer now you would
need congratulation and offer but if you assume Independence there this can be congratulations given spam multiplied by
offer given spam so word by word the probability can be calculated and it can be put in this
approach you'll see studying text mining one of your courses it's called the bag of words
approach the words that put into a bag irrespective of their order and things like
that yeah for one
yes yes each yes so so each of these the a will
then be a new event and that new event would be different words and so that those different words
will be thought of as the product of each word so the chance that that the words congratulations and offer are
there in the email is the chance that congratulation is there in the email multiplied by the
chance that offer is there in the email that's an assumption an assumption that is built into the bag of words
model if you don't like it it what you have to do is you have to give me the joint probability of offer and words and
those models are also there they're called Byram models spam and not
no spam and not spam are where spam and not spam and not spam are in the bi right but in the
formula for each case yes we are adding two times these two spam and not spam
yes yes so you're relating it relating it to two here there were there are key possibilities number of possibility will
be combination of no the number of possibilities in this case no and there could be other
possibilities here here the things I'm deciding between are just two spam or not spam in this formula the number of
things that I'm deciding between are many for example in your Gmail how many categories are there
there's social there's promotions and primary so instead of it being spam I can Define it as primary social and
promotions so now I need to find what is the probability of primary given congratulation promotion given
congratulation and social given congratulation there are three of these now that can that now you can apply here
there's B1 B2 and B3 so you we've already seen an example of a distribution I'll simply tell you what
it is the binomial distribution what is the binomial distribution the binomial distribution is a distribution of Simply
counting the number of things the number of defective products H um the number of customers that receive service etc etc
exactly like the applications that we were talking about this is the statement we have already
seen the probability of getting X successes out of n trials is p of X is equal to n choose x
p ^ x 1 - p ^ x where the individual p is the probability of getting success in one
trial you remember my formula of Point 1 to the^ 2 so it's that formula
what does this formula say this formula says that if p is the probability of success of a single
trial then what is the probability of getting X successes out of n
trials n trials p
is the success probability of each trial what is the probability of X
successes n choose x p ^ x 1 - p ^ n minus X how do I think this through what is a trial a trial is the
total number of attempts that I'm making the total number of products that I'm making I'm making three
products the probability of each product being defective is
0.1 what is the chance that I will get two defects 3 ches
2.1 to the^ 2.9 to the^ 1 P successes P into P into
p n minus X failures what is not a success is a failure whose probability is 1
minus p and there are X ways of choosing that original
n sir in this case it's a like these trials are like with replacement these trials are not just
with replacement yes they're with replacement it's not like it's it's a it's a population so to speak in other
words an actual experiment is not being done um it's imagined that someone is doing this experiment
repeatedly so yes if you want to think of it as replacement as replacement it's a model for example here A Bank issues
card statements to customers under the scheme of MasterCard based on past data the bank has found that 60% of all
accounts pay on time following the bill if a sample of seven accounts is selected at random from the current
database construct the bin probability distribution of accounts paying on time what is the question being asked the
question being asked is this that I am looking at seven accounts and I'm trying to understand
how many of those accounts are paying up how many of those accounts are paying
up now what values can it take what what are the possible values that that that that my X can take
0 1 2 3 4 5 6 and seven six means none pay on
time I'm sorry zero means non pay on time one means one pays on time seven means all pay on
time the chance that every one of them individually pay on time is 60% and I'm going to make the assumption
that these people aren't talking to each other so they're behaving independently the 60% chance applies to everyone
separately which means that if one person has paid that has had no impact on whether another person has paid or
not correct let's do one of these calculations let's say what is the probability that um
let's say um how many people two people pay on time so 2 pay on
time what is the answer to this you can use this formula directly but two people pay on time means 6 into
2 6 into 6 not into 2 to the^ 24 to the^ 5 these are the five people who have not
paid on time these are the two people who have paid on time so this 6 into 6 into this 6 into 6 into point4 into
point4 into point4 into point4 into point4 the seven people now that is one Arrangement how many such arrangements
are possible seven choose two arrangements are possible those two could be the first
two they could be the next two they could be the first and the last there are seven choose two of those for each
of them is a pattern paid paid not paid not paid paid and every time you see a paid 6 every time you see a not do not
paid point4 the 6 you're going to see twice and the point four you're going to
see five times therefore this formula so can you expand choose one 7 7 choose two is a Formula which simply
says how many ways can I pick two things out of seven the formula for it is 7 factorial divided 2 factorial into 5
factorial H which is 7 in this case 7 into 6 divided by
2 which is I think 21 21 the 21 ways to pick two team two out of seven because I asked for
two I can do it and the problem asked for all combinations I've just solved it for
for one particular answer I need to do it for 0 1 2 3 4 all of them if I add them what answer will I
get I'll get the answer one because something must happen isn't the number of Trials eight no the number of Trials
is seven the number of outcomes is eight if I toss one coin I can see two things so there are seven outcomes there
are seven people so 0 1 2 3 4 5 6 7 that's eight the eight possible outcomes all right so
now there is a file here um it's called I think um binomial distribution example You' You' import a few things for
plotting and for the stat functions then I'm going to set up the problem how am I going to set up the problem in this
particular case just by specifying an n and specifying a p what is the n in this case n is the
total number of Trials why is it seven for me because there are seven customers correct p is 6 where do I get this 6
here right this 60% what am I doing here what I'm doing here is I'm creating the sample space
I'm creating the set of numbers for which I want to calculate the probability
so this one here the range function 0 to 8 so when I do this it creates an array of eight
numbers 0 to seven do that zero really has a value we don't need of course we do there is a there is a reasonable
probability that nobody pays on time same place wherever you got the other one
from can you repeat bu for the basis of the formula how it was how it was formed this
is X people have paid so this is p so think of it as P into P into p x times and think of 1 - P into 1 -
p n - x * because X people have paid and what allows me to multiply the probabilities
because because if there's 60% chance you pay there's also 60% chance you pay and so when I when I figure out the
chance that both of you pay is going to be 66 into 6 and if he doesn't pay and I want to multiply those 6 into 6 into
point4 now how many sixes are there how many successes I want how many point fours are there how many non successes
are there and how many such possibilities are there how many ways can I get two successes that is what I'm
calling 7 choose two which is 21 why is it 21 you are going to pick two people out of seven how many ways can
you pick them the first person you can pick is 7 Ways the first person who pays on time the second you can pick in six
ways 7 into six but if I pick U First and U second that's the same as picking U First and U second so I've double
counted so buy two so 7 into 6 by 2 which is my 21 so uh one quick question
when in Practical world I look out for binom distri this application this kind of application or another kind of
application for example I can change this to saying uh in sales I am I am selling my or I I am approaching seven
leads the chance of a conversion for a lead is 60% what is my sales distribution okay so I'll use that
information for example to to figure out um let's say that um how much budget should I have for the sales
team for example I could say um you know what I'm going to approach seven leads and I'm going to get sales
however how are those sales going to be made those sales are going to the sales are going to be made on the phone but to
confirm the sale I need to be able to send a sales person to the person's house and get their
signature this person is going to take a certain amount of time to travel through the famous city of
Bangalore and get stuck in the traffic jam and get there so I'll be able to get at most three signatures in a
day and if I lose it I lose it or four signatures or so let's suppose that therefore I employ one
person is that good enough so now I'm asking the question what is the probability that I'll end up
making more than three sales in a day because if I end up making more than three sales in a day I'll not be able to
close all the sales so this becomes a Salesforce question it becomes a question of saying
that based on my ability to sale I should have a sales team if my sales team is too short too small there's a
probability that they will not be able to close out all my sales and I leave money on the table if my sales team is
too big I'll be spaying for that sales team but they will not have enough to do so yes the binomial distribution is
used left right and Center big in contact Cent In in contact centers yes it's used same same argument in contact
Cent for example one reason it's used is how many escalations do you expect so in many of these so how do I
execute on this so I've given the I've I've I've I've created the array now here's the command that you
need to know this command calculates that formula that n choose K that
formula that formula is calculated right by the way you can manually do this if you want to Once
which is your 21 into 6 ^ 2 into .5 to ^ four does anyone want to manually do it once no one has any just to check
otherwise you'll just trust the output that's fine but if I do this binomial stats.
binomial pmf pmf stands for probability Mass function in case you want to know what
Earth that means huh probability Mass function so this thing is called a prob ility
Mass function probability clear Mass means it's almost as if you're thinking of a a
solid material and the probability as being physical Mass how much mass is in each number how much mass is in each
number so what it this number the pmf simply is this
number it's a calculation of this number so now if I ask for binomial if
you do it without the equal to it'll just give it directly all right so it done it just
takes a little bit of time so binomial is an array so what is this number
here for zero so what is this in the business context this is the chance that nobody pays on
time the number of people who pay on time is zero so it's about1 16% number of if
what is the chance that 1% pays on time 1.7 1.7% two people pay on time about
7.7% three people pay on time about 19% four people pay on time about 29% five people pay on time time 26% 6
people 133% 7 people about 2.7% okay curiosity question how many people would you expect to pay on
time seven no remember there's 60% chance that everyone will pay yes four or five in fact the right
answer is 7 into. 6 which is about 0 4.2% so you would expect to see about
four or a little more than four people pay on time and the chance of four people
paying on time is what 0 1 29% and the chance that five people pay on time is about 26% if you want to
plot this there's a there's a slightly sort of you know jazzed up version of a plot here so the first line says plot
it you know it says binomial then there's a title there's a labels and then finally the
plot command itself I think that's a plotting artifact I mean it tells you what to plot you can remove it and see
what happens here's an interesting thing someone's asked what happens when I add up all the
probabilities which is what I get here I don't need it it's a check sum so so one Poss one possibility of a
business outcome is what is the probability that say more than six people do not pay their bills on
time now in a collection team in a bank certainly is interested in that because you have to go after that
there's also a question of what is the entitlement on my on my on a specific month so a bank is going to make money
or a telephone company whoever is going to make money on the amount of Bill that's actually paid now the fact that a
bill has been given to a person doesn't necessarily mean they'll pay it like here so how much money does the bank
actually expect to make it has to have an estimate of its Revenue per month how does it get that
by doing a calculation of this kind here's a little formula if it wants to help you the average of a binomial
distribution is given by n into P we just discussed that total number of Trials into the probability 7
into 6 which means for example that if I think that my success probability of a
sale is 10% and I approach 10 people the number of people I expect number of sales I expect to make is 10 into .1
which is 1 does that mean I will make one sell no the distribution goes from 0 1 2 3 up
to 10 but the average is at one similarly the average of this distribution is where it's at
4.2 but where is the picture where is the average where is 4 4.2 somewhere here right somewhere here is 4.2 this is
the center gravity of the of the distribution the standard there's a standard deviation formula if you want
to know NP into 1 minus P the standard deviation will make a little more sense when we talk about the
normal distribution I hope I'll get there now there's another distribution which is used a little less in practice
you guys are all very practical types how is it how is it used any examples why would we use mean or standard
deviation the question the kind of question he asked so I want to make an estimate for example as to how many
people will pay pay my bills because based on that I will decide so I can do it two ways I can for
example say what is the number of people I expect to pay my bills 4.2 what is the number of number of
sales I expect to make what is the number of Errors I'd expect to have in my
code what is the number of defective products what is the number of expected customer recalls that I have whichever
industry you're in there are events that happen in that industry and you're trying to find out and estimate for it
one estimate for it is an expectation like we discussed yesterday but remember this one is not coming from
data 7 into 6 is not a calculation Based on data I didn't give you any data on people paying their bills on
time I give you a theoretical distribution this is an assumption that I
made H it's not an average computed on data so therefore when I make the distribution assumption and I say based
on that distribution what is the expected number I should see will I see that all the time no that's why there's
a distribution so there was that array that you gave like probability of one
person two in reality when you do real solution this this array is something which we have to chge with the
historical data in the lab right no so this would be used and and it is often used where what will come from the what
will come from the data one thing that can come from the data is the P yeah that's yeah okay the P just the P not
the distribution itself okay but probability of one person paying two person paying yes and so that will not
so for example so I want to find that next month next month for a new customer on next month how many people will pay
their bills on time that's user case now here's the way I do it I ask myself last month how many
people paid their bills on time but it come but it may come from the data so the P comes from the data
but the calculation for saying how many people will pay their bills on time comes from the next month it is done for
the next month it makes no sense to do it for this month because I already have this month exactly but let's take a
situation that the probability that we added right probability of 1% probability of 2% the exact array that
the python yes entire the data for the array will it come from the past data it already has because the p Has Come From
the Past data yeah that's the question I that normally in a real situation that probability has to be computed in a lab
based on past data right yes um Let me clarify that yes it came too quickly so there are complexities
one is you might be supposing that it changes with time you might be you might be in a situation that does this that
you know what I have two I have a collections problem means not enough people are
paying so I might have a problem that looks like this that my my the number of people who pay their bills on time is
60% and I'm saying it's too low correct now I want to increase that how to increase that I my manager comes and
says make it so such that the number of people say let's say more than five people not paying on time this number
must be less than let's say .1% that's the goal now to do that I now need to change my
P so I'll set my P so that the answer to this question becomes less than 0.1% that gives me a Target P now I must
reset my collection process so that that P is attained to achieve that P so I can do I
can create applications in various ways give me the p and I will tell you what happens or give me a situation that I
want to achieve and give me a Target P such that it gets there the constant and the variables keeps yes the constant in
the variable keeps changing what do I want to fix keeps changing so that dep this is a model this is a mathematical
model how you use it is up to you this is one particular use case but there'll be many use cases for this you
see one in logistic regression for example the PO distribution is a very similar distribution except that for the
poro distribution that has a mass function that looks like this now this Mass
function counts but does not count relative to a maximum the binomial goes from 0 to n 0
1 2 up to n the posa there is no n there is no total number of things for example I might ask the question how
many fraud cases do I expect to see there's no sort of Maximum to that I could frame it as saying that tell me
the total number of cases there are and that is my n and then I'll figure out based on a p how many fraud cases there
are but there are situations where this maximum is something that doesn't quite make sense how many fraud cases are
there how many cracks are there micr fractures are there on this bottle it's a count right how many eggs
will the chicken lay it's a count it's not in some way a proportion like thing so if it's if
you're in a pure count like situation you are in the situation of the so-called por distribution whose Mass
function has this slightly different form called e ^ minus Lambda Lambda to the^ X where Lambda is the average if on
an average six customers arrive every 2 minutes at a bank during busy working hours what is the probability that
exactly four customers arrive in a given minute what is the probability that more than three customers will arrive in a
given minute this is slightly different from a binomial why the reason is in the previous case
they were asking for how many customers did not pay but there was a total Universe of customers seven customers
there was a sample sample space here there isn't I'm not telling you how many could have come there's a series and
that series could go up to anything so to speak this is the typical situation of a
personal distribution where it's not a question of saying independent trials and how many were successes it is that
I'm simply counting how many there are and I have no ideas to how many there could have been potentially how many
fraud cases I do not know how many micro fractures I do not know how many customers could have arrived I do not
know there's no maximum to it so there's similar calculation here for the same thing if you open the personal
distribution example file now for the person distribution that
formula for the binomial there were two numbers you needed to put in the n and the P for the
Poo there is only one number there is only one number and that number is usually called the rate the
rate at which my customers are arriving the rate at which I get fraud the rate or the density of of my
cracks it's a rate number you can think of this rate number as a product of n and
p as as the total number of opportunities multiplied by the product if you want to think of it as that so
for the pora I need to be able to specify the rate and now I do exactly the same thing
I again calculate the poso probability stats. poso do pmf now for computational purposes I am setting the range from 0
to 20 I can set to be any High number that 20 is not coming from my data that 20 is coming for a computational reason
because I want to do the calculation for a finite number of points and as you'll see after 20 the
numbers are very very small so the 20 is not there from the problem the 20 is there for my
visualization but how do you come to that I can make it any make it any other number if you make it too low you'll be
leaving some probability to the more than 20 you make it too high you'll you will be calculating a lot of zeros so
what is my problem let's go here my problem is what is the probability that exactly four customers arrive in a given
minute six customers arrive every 2 minutes at a bank what is the probability that exactly four customers
arrive in a given minute what have I put my rate as six and here is my distribution this
is what 2.4 into 10 ^ minus 3 so this is what 0.2 let's see what happens so what is
the probability of 0 02 what is it for one1 for
two for three 8 for four no for what so no what is it for what is it for say this
zero 1 2 2 3 4 what is it for 4.13 133% what is it for
five 16% was it what is it for six 16% what is the average number of
customers I expect to see six 16% what is it what is that seven 133% for 8 10% now it start going down
and it'll go down and by the time I've reached 20 it is already 0000
1 so if you had gone beyond 20 I would have seen even smaller numbers but I could have stopped for example let's say
at 15 if I stopped at 15 where would this have stopped 1 2 3 4 5 it would have stopped
here which is fine approximation 20 20 is an approximation
20 is 20 is a guess here is a distribution plot the same thing this is the plot of the distribution function
whose average is at six by the way what is the answer to the question what is the probability that
exactly four customers arrive in a given minute be slightly careful be slightly careful six customers arrive every 2
minutes the question asks for exactly four customers arriving in 1 minute which
means if I'm yes if I'm putting six as the rate then I have to convert this
question to saying what is the probability that exactly how many customers arrive every 2
minutes each customers arrive every 2 minutes or what I can do is I can change my rate to three
this one is a distribution where you do most of the calculations with this is the normal
distribution the distribution that corresponds to age to the mean spad all the continuous variables that we were
looking at numbers numbers so if you're dealing with
numbers then you deal with a distribution that has a shape like that this is called the normal
distribution now the normal distribution the reason I wanted to get to is this because because of this picture
now this picture puts the standard deviation in context so yesterday we talked about the standard deviation and
a question often asked is what does a standard deviation mean what is standard about the standard deviation this
picture tells you what is standard about the standard deviation so this picture means that if I have a normal
distribution then the chance of being within one standard deviation is 68% as a numerical
quantity this distribution is a distribution that has a mean and it has a standard deviation now
the standard deviation has to be defined in such a way and the way the standard deviation is defined implies that the
chance of being within one standard deviation is 68% the chance of being within two
standard deviations is 95% the chance of being within three standard deviations is
99.3% so now if I tell you something like this that I'm telling you that for a group of
people the mean height is say 5' 10 in with a standard deviation of 2 in mean height
is 5.2 in and a standard deviation of 2 in right so mu so let's say 5 ft um 8 in and a standard deviation of
sometimes denoted by Sigma of say 2 in I've told you some interesting things if you allow me a normal
distribution I've now told you that 68% or roughly 2/3 of the people are between 5' 6 in and 6
ft oh 10 in same Stu this is 58 this is one standard deviation which is
two and two so this is 510 and this is 56 and this is about 68% sometimes it's easy to remember it as
2/3 close enough two out of three are between these two heights 95% are between what
and what 6 and 54 95 5% are between these two
heights one and 20 are outside this range so therefore if I tell you the mean and the standard deviation I've
actually told you a reasonable amount as to how the data is spread so sometimes the mean and the
standard deviation are are reverse engineered so to speak so if you're a professional say I often do this so
people say people often ask where is the data they said nobody has any data H so I say so so you know you're trying to
figure out what what work to get so so so so you might ask a question um when do you typically arrive and someone says
oh uh 9:00 thereabouts what's your earliest arrival time 8:30 what is your
latest 10:00 so looking at this you'll now say so you you can decide as to what you
should assume that the whole range of the distribution is say from say 8 8:30 to
10:00 and now this pattern tells you that if I go for three sigma covering 99.7% this whole range is about six
standard deviations so to ex to look find the mean you just take the middle of it and
to find the standard deviation you take the whole range and divide by six so I can get an idea of what the
average is and what the standard deviation is without even getting any data from you but just getting a sense
of the extremes it's a nonsense way of doing things but what it does is it allows you
to cheat with essentially very minimal information so remember this remember these pictures they're helpful they give
you an idea of what the distribution is like now by the way these numbers are easy enough to calculate so we'll do
some calculations the normal distribution has a bell-shaped distribution so it's
symmetrical the Tails could be extended it depends on two parameters mu and sigma see the power of it by giving you
two numbers I've given you characteristics like this so and I can do calculations and this is the density
function that equation if you want to think of it nobody does anything with this but and then you can do
calculations on it so here's a here's a calculation I'm not sure whether this is a calculation that we had worked on um
this is a calculation that we actually do in in some detail let's do it so the mean weight of normal of a morning break
serial pack is 295 kg with a standard deviation of 025 kg a random a random variable weight of the pack follows a
normal distribution what is the probability that the pack weighs less than 280 G now why would someone be
interested in this one possibility perhaps is that maybe the target for the for the pack is
something like 300 G and you're trying to understand whether you are
with in tolerances or more or less or something of that sort so what is the probability that the
pack weighs less than 280 kg so what do I need to do what is my
picture like my average is
295 standard deviation of 25 on the gram scale and I want to find the CH of being to the left
of 280 I need this area calculating this area is actually
quite easy so let me calculate that area so I'm going to do it this way
stats dot Norm dot
CDF CDF stands for cumulative distribution function I'll tell you what's cumulative about it
CDF now what is the number that I'm interested in probability of being less than 280 or if I want to be very clear
about this point Sorry 28 now I'm going to do something here comma location equal to
location means the middle of the distribution for me what is the mean 2
95 comma scale is equal to what is the standard
deviation is that right are the numbers correct 27% this one here instead of0 28 you
saying it should be 27 no I'm calculating the answer to this question what is the probability that
the pack weighs less than 280 G this is the question to answer this the way I set it
up was to say that what is the chance of being less than
280 when the mean is 295 and the standard deviation is25 because of certain technical
aspects of other functions the mean here is referred to as location and the standard deviation is referred to as
scale huh so if those terms location and scale confuse you just ignore
it huh this first term is the is the number but otherwise huh this this this one
here this one here makes more sense fine go ahead with this all right do you understand how the
code works all right let's do the second
problem what is the probability that the pack weighs more than 350 G what do you think the answer should be guess
oneus yes one minus what stats Norm 1 minus stats do Norm now what should I do sorry norm.
CDF 350 comma same thing
about 1 39% 39% the chance of being more than 380 clear so what does CDF do
CDF cumulative distribution function what does it do calculate the
area to the left of less than therefore if I want to calculate the area probability more than I need to go one
minus why because the whole probability is one what about the thirdd
one one what is the probability that the pack weighs between 260 g and 340 G how to do
this yes 340 so I now need to be between 340 and what is it
2 260 so less than 340 minus less than so it should be
again let's say let's get lazy what is this
number 340 and this is 260 right
88% 8 8% of my packets are going to lie between 260 g and 340 G like this it's an assumption it's an assumption we are
making remember there isn't any data at all here there isn't any data at all here
what numbers am I using mean and standard deviation so what I'm doing is what is
the advantage that I have I don't need the data all I need is this mean and standard deviation what is the price I
pay an assumption on the distribution no so the I could instead of using Norm have another distribution
sitting there there's a whole range other other possibilities Bome is one there there are other distributions if
you want to you would you would decide based on whichever distribution makes most sense
for your application now in certain cases you know what those nature of those distributions look like
for example if you're looking at lifetimes of things it's an exponential distribution or gamma distribution or
something of that sort but there's a certain advantage to the normal distribution because of something called
the central limit theorem and we'll cover that a little bit of it will be mentioned when in the in in in in the
next residency Central limit theorem essentially says that if I take the averages of things or the totals of
things I end up with the normal distribution the normal distribution is a result of
averaging so if my observation is a total of little things then probably the normality
assumption is a good assumption for that large data doesn't necessarily mean normal but if the observation is the
total or the accumulation of lots of things so for example height is often normal why because our height is a is in
some way a random combination of many things maybe the height of each of our cells and things of that
sort so the normal distribution is often used as an assumption based on the central limit theorem the other part of
it is that even if the data doesn't look like a normal distribution the the sort of generation
for it the sample from a normal distribution doesn't necessarily look like a sample from a normal
distribution so even like we saw yesterday the B shaped curve so it's hard to look at the data and say that it
is not normal so the normal distribution is person to the that is often made um in the absence of you any other
information on the data um it is obviously wrong in cases where the data has a very strong
skew in one sense to another but remember in many cases you're not even talking about the data the question that
you're asking is not a data question the question that you're asking is a probability question it's a situational
question you're asking for effectively the following thing why would some why why is this an analysis of this kind
done what data is it going after if anything you're talking about the data being normal or not normal what data is
it even referring to why do I care about the first question what is the probability that a
pack weighs less than 280 Gam one context for it could be that if a person buys a pack what is the chance that
they're getting a a light pack in other words something that is less than 280 G the way you have to design your
packaging also right true but my question is this where in all of that is a
data where is the data in this how do you even think of the data is it a data problem at all I'm asking the question
that is my product in Spec in other words what data are you referring to what is this a data science issue at
all or is it not we asking the question is it normal is it not is is it a data question how you reach the customer yes
and what kind of packaging sizes so what what data is that so data of
what data of my skus how many data observations which data observations for whom for which customer when what
data huh so kog quality check for what I could argue for example that this is about saying that if he goes in and buys
that breakfast cereal will he get something that is below 2 180 g for the value of the price we pay yes but where
is the data in the supermarkets for examp there is no it's a business
question what dat dat does it apply to what I'm trying to say is that it's not a data problem at
all you can solve it using you can say I'm going to gather a lot of data to solve the
problem the data we already have on the basis of which we have no I'm telling you that this could
come from the past mean this could so you could say that I'm going to I'm going to gather the data to get this
number and get this number that's a good answer that in order to solve my business problem I need a mean and a
standard deviation so that I can get a handle of what is the chance that it'll be
underweight now that mean and standard deviation has to come from somewhere and I can say I will use data to get that
mean and the standard deviation that's a good answer that you'll now say why do I need
data in order to calculate mean and standard deviation why do I mean mean and standard deviation because that's
the that's the least data I need in order to be able to answer this question which is the question I'm interested in
answering will he buy the product will my network go down will I be under product there's a business question I'm
interested in answering or there's a tech question that I'm interested in answering and often that is made
independently of the data so for example the car has to stop autonomous
vehicles right the the data that the car is going to react to is the scene that the car sees in front of it but that's
not the data on which the algorithm is going to be based so the the so the data that the
car sees is what it is reacting to similarly this is reacting to only one number 280
G I'm now solving the 280 G Problem by saying is it this so I'm giving you a packet and I'm asking the question is
this underweight does this have less water than it should I'm interested only in that I'm
not interested in any data so in hypothesis testing what we'll do when we come back is to be able to
close out that question and say therefore from data how do we get to numbers like
this which now means that I have to put the two pieces of this residency together I have to put together the idea
of calculating means and standard deviations from data to the idea that it is a parameter
being estimated to solve a problem so you would say that that data this 295 comes from data that
immediately raises an issue but if it comes from data it comes from a sample and if it comes from a sample it's not
accurate and if it comes if it's not accurate then how well does it solve my problem and life keeps going in circles
like that so this is the probability side to it which explains why I need to have
means and standard deviations in order to do a calculation and the descriptive part
says I have the means and the standard deviations to do the calculations so does that mean that when when I had the
sample size yes uh sample set that if it had normal distribution then I'm more reli no no if it had a normal
distribution then maybe I'd be able to get good numbers around this and the plus minuses would be
symmetric this calculation doesn't rely on the normality behind the 4 295 estimate this calculation lies on the
normal ity of the future data which doesn't exist at all but what I'm asking is Will these numbers be more reliable
the MU and the sigma if I had normal distribution no not necessarily not necessarily if I have normal
distributions I'll be able to use certain very specific formulas that we'll see if it is not normal those
formulas may break down a little bit so those formulas help me calculate huh so normality helps me
calculate it helps me calculate how good these numbers are it also helps me calculate using normality
what the answers to questions such as these are but the normality that I use right
now 10 minutes ago had nothing to do with data and that to some extent is the
power of probability that you're being able to answer a question like saying do I expect that the weight is going to be
less than 280 G without having data in place for it the simpler answer would be give me the
data and count how many are less than 280 G that's the simplest answer right what is the chance that the
pack less than 250 g empirical go collect 100 packets and find out how many of them have weight less than 280
gam that's the answer to that question so why are we doing all of this because you don't have
that because you don't have that data why don't you have that data because that's not the question I'm
asking I'm asking the question is it less than 200 80 g I'm looking at a computer program in front and I'm asking
what is the chance that there are more than five bugs in this code I'm looking at all the computers in
my office and I'm asking um what is the chance that all of the employees today there's going to be more than two
hacks or malicious attempts on my server there is no data yet there will be but by that time the
hacks happened but I still need those numbers and I get those numbers using these
distributions to operationalize those distributions I need certain numbers and I can guess them I can beg them I can
borrow them I can steal them I can estimate them from data I can ask for a friend I can read a
book see a standard I can look at market research yes I can do any number of things in order to get at those numbers
I can look at an industry standard those two pieces will put together Shi is getting really nervous H
noral this this picture is definitional for the normal distribution this picture this is
definitional for the normal distribution so if you look at Six Sigma 6 Sigma will cover
99.7% 3 out of a th000 will lie outside the plusus 3 Sigma range not everything but roughly
3,000 this is 3 Sigma 6 Sigma 3 Sigma usually says 3.4 defects per million
opportunities which is actually not 6 3 Sigma is not 6 Sigma it's 4.5 Sigma so 4.5 Sigma is about 3.4 into 10^
minus 6 that's 4.5 Sigma so if you look at Six Sigma literature there's a confusion
there basically what it says is that if you have in order to get 3.4 defects per
million to the customer you have to be within Six Sigma which is about one in a billion this is at this is at three
standard deviations plusus three standard deviations if I go to plus- 4.5 standard deviations I'll be at around
3.4 into the^ minus 6 to reach that for the customer I need to go to Six Sigma here which is about one in a billion I
must be more accurate in my factory floor for my customer so if I reach Six Sigma my customer will reach 4.5 Sigma
and four customer 4.5 Sigma is the 3.4 10 the^ minus 6 so if you look at 3.4 the^ minus 6 it doesn't correspond to 6
Sigma little confusing but that's the way Six Sigma literature is written normal distribution is the
normal distribution is just this as a formula Plus or plus plus or plus orus 2 Sigma is 95% actually actually plus or
minus 1.96 Sigma is 95% and 3 Sigma is about 99.7%
Infinity by definition goes to Infinity you want to cover everything plus minus infinite standard
deviation
Statistics starts with a specific question (making the question 'expensive') and then collects data to answer it. Machine learning, conversely, starts with large amounts of data (making data 'expensive') and asks the data to reveal patterns or insights.
The three types are descriptive, predictive, and prescriptive analytics. Descriptive analytics summarizes what happened, predictive analytics uses data to forecast future outcomes, and prescriptive analytics recommends specific actions to take based on those predictions.
You should use the median over the mean when your data is skewed, such as with income data, because extreme high or low outliers can distort the mean. The median gives a more accurate representation of the ‘central’ value by separating the bottom 50% from the top 50% of the data.
The five-number summary consists of the minimum, 25th percentile (Q1), median (Q2), 75th percentile (Q3), and maximum. It provides a quick, powerful snapshot of a dataset's distribution, location, and spread without needing to visualize the entire set.
Correlation measures only the direction and strength of a linear relationship between two variables, not that one causes the other. A hidden third factor or pure coincidence can cause two variables to move together, so you cannot infer a cause-and-effect relationship from correlation alone.
A highly accurate test (e.g., 95% sensitivity) can still yield many false positives if the disease is rare (e.g., only 1% prevalence). Bayes' Theorem shows that a positive result might give only a 16% chance of actually having the disease, because the large number of healthy people generates many false positives.
For a Normal distribution, about 68% of data falls within one standard deviation of the mean, 95% within two standard deviations, and 99.7% within three standard deviations. This helps quickly estimate probabilities and identify outliers in normally distributed data.
Keep this summary
Save it to LunaNotes and it becomes a real note in your library — editable, searchable, and ready to turn into flashcards or a diagram. Free to start.
Save to LunaNotesOr summarise for another video.
This summary and transcript were automatically generated using AI with the Free YouTube Transcript Summary Tool by LunaNotes.
Related summaries

Probability & Statistics: The Ultimate Guide to Modeling Uncertainty (Course Intro)
Professor Steve Brunton launches an exciting new short course on probability and statistics. This introductory overview explains why probability is a foundational tool for data science and machine learning, provides real-world examples from thermodynamics to weather, and outlines what you will learn in the first 10 hours dedicated to probability.
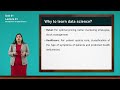
Understanding Data Science: Concepts, Importance, and Analytics Lifecycle
Explore the fundamentals of data science, its critical role across industries, and the detailed six-phase data analytics lifecycle. Learn how data transforms from raw, unstructured form into meaningful insights using various tools and techniques for effective decision-making.
Unlocking the Power of Statistics: Understanding Our Data-Driven World
Discover how statistics transform data from noise to insight, empowering citizens and reshaping scientific discovery.

Comprehensive Introduction to Statistical Methods for Economic Analysis
This module provides a detailed overview of statistical methods essential for understanding and analyzing economic activities. It covers key concepts such as data types, measurement scales, sources of data, survey methods, and the practical application of statistics in various fields including economics, commerce, and production.
Top 120 Data Science Interview Questions & Answers (Playlist)
This comprehensive video starts a new playlist for data science interview preparation, covering 120 of the most frequently asked questions. The instructor explains concepts in detail using practical examples, from algorithms like Decision Trees vs. Random Forest to key theoretical foundations like the No Free Lunch theorem and semi-supervised learning.
Most viewed summaries

A Comprehensive Guide to Using Stable Diffusion Forge UI
Explore the Stable Diffusion Forge UI, customizable settings, models, and more to enhance your image generation experience.

Kolonyalismo at Imperyalismo: Ang Kasaysayan ng Pagsakop sa Pilipinas
Tuklasin ang kasaysayan ng kolonyalismo at imperyalismo sa Pilipinas sa pamamagitan ni Ferdinand Magellan.

Mastering Inpainting with Stable Diffusion: Fix Mistakes and Enhance Your Images
Learn to fix mistakes and enhance images with Stable Diffusion's inpainting features effectively.

Pamamaraan at Patakarang Kolonyal ng mga Espanyol sa Pilipinas
Tuklasin ang mga pamamaraan at patakaran ng mga Espanyol sa Pilipinas, at ang epekto nito sa mga Pilipino.

How to Install and Configure Forge: A New Stable Diffusion Web UI
Learn to install and configure the new Forge web UI for Stable Diffusion, with tips on models and settings.
Found this summary useful?
Take it with you. One click puts it in your own LunaNotes library.
Save to LunaNotes